

1. Introduction
Of the three main glacier systems that drain the West Antarctic ice sheet, the one comprising Pine Island and Thwaites Glaciers is thought to be the most unstable (Reference HughesHughes, 1981; Reference BentleyBentley, 1997). Loss of the ice contained in the ice-drainage basins and glaciers that disgorge into the Amundsen Sea (Fig. 1) could raise global sea level by 1.2 m (this estimate is obtained from the ice volume above sea level extracted from the BEDMAP thickness map (Reference Lythe and VaughanLythe and others, 2001) over the drainage basins occupied by the glaciers) and promote increased discharge of the remainder of the West Antarctic ice sheet. Earlier assessments of input vs output of ice from these basins have not shown measurable imbalance (Reference Bentley, Giovinetto, Weller, Wilson and SeverinBentley and Giovinetto, 1991), but these assessments contained major uncertainties (Reference Vaughan, Alley and BindschadlerVaughan and others, 2001).

Fig. 1. Location map of Pine Island and Thwaites Glaciers, West Antarctica.
More recently, satellite radar interferometry data showed that the grounding line of Pine Island Glacier retreated rapidly in the early 1990s (Reference RignotRignot, 1998) and that the glacier mass balance might well be negative. A similar analysis conducted on Thwaites Glacier also indicated rapid grounding-line retreat and thinning (Reference RignotRignot, 2001). Satellite radar altimetry data subsequently confirmed the thinning of Pine Island Glacier, with a thinning rate approaching 1.6ma–1 near the grounding line (Reference Shepherd, Wingham, Mansley and CorrShepherd and others, 2001). At larger scale, the drainage basins of Pine Island and Thwaites Glaciers thinned 10 cma–1 in the 1990s (Reference Wingham, Ridout, Scharroo, Arthern and ShumWingham and others, 1998). While these data indicate that important changes are taking place in this part of West Antarctica, they are not sufficient to determine the cause of the changes.
Here, we apply a satellite interferometry technique (Reference Rignot, Gogineni, Krabill and EkholmRignot and others, 1997) to synthetic aperture radar images acquired by the European Remote-sensing Satellites ERS-1 and -2. The resulting images allow us to map the flow of Pine Island and Thwaites Glaciers with sufficient precision to measure substantial changes in flow velocity between 1992 and 2000.
2. Methods
For the period 1996–2000, measurements of flow velocity are obtained in the same line-of-sight direction of the radar, ![]() using interferometric pairs spanning a 1 day time interval, acquired along descending track 81 of ERS (Table 1), and corrected for topography. Topography is calculated from interferometric pairs between which there is negligible change in glacier velocity (Table 1), and controlled by a digital elevation model of Antarctica (Reference Bamber and BindschadlerBamber and Bindschadler, 1997). The line-of-sight velocities,
using interferometric pairs spanning a 1 day time interval, acquired along descending track 81 of ERS (Table 1), and corrected for topography. Topography is calculated from interferometric pairs between which there is negligible change in glacier velocity (Table 1), and controlled by a digital elevation model of Antarctica (Reference Bamber and BindschadlerBamber and Bindschadler, 1997). The line-of-sight velocities, ![]() and
and ![]() are
are

where ![]() and
and ![]() are the vector velocities in 1996 and 2000, respectively. Comparison of the line-of-sight velocities yields a map of changes in velocity with a precision of ±5ma–1 (Fig. 2).
are the vector velocities in 1996 and 2000, respectively. Comparison of the line-of-sight velocities yields a map of changes in velocity with a precision of ±5ma–1 (Fig. 2).

Fig. 2. (a) Line-of-sight velocity of Pine Island Glacier (positive down-glacier), 11 November 1995; grounding-line position in 1992 (red), 1996 (white) and 2000 (black), profile A–B with white dots every 10 km, and location of A’ and B’ discussed in the text (black dots). Each color cycle (from blue to red, yellow and blue again) in (a–c) represents a 350 m a–1 increment in velocity, and 50 m a–1 in (d–e). (b) Increase in along-track velocity measured between 15 February 1992 and 11 November 1995 (1365 days). Increase in line-of-sight velocity measured between(c) 11 November 1995 and 20 November 1999 (1470 days), (d) 11 November 1995 and 24 February 1996 (105 days), and (e) 20 November 1999 and 4 March 2000 (105 days).
Table 1. List of ERS-1/-2 dates and orbits used for Pine Island Glacier
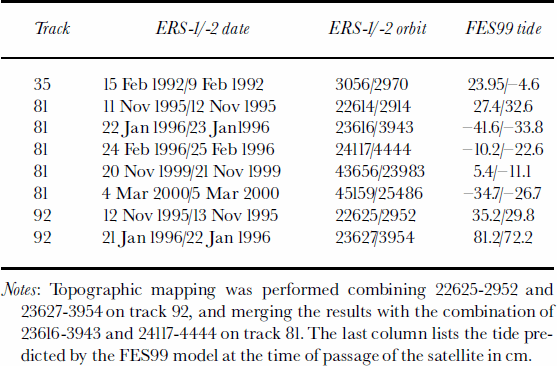
From late 1995 to early 1996, sufficient tracks are available along both the ascending and descending paths of ERS to allow a vector mapping of ice velocity, (![]() Table 1). The measurements of ice velocity were corrected for tide on the ice shelf using tidal predictions from the FES99 model (Reference Lefevre, Lyard and ProvostLefevre and others, 2000) listed in Table 1. The vector map is used to convert the 1996–2000 changes in line-of-sight velocity into changes in velocity magnitude assuming no change in ice-flow direction between those years:
Table 1). The measurements of ice velocity were corrected for tide on the ice shelf using tidal predictions from the FES99 model (Reference Lefevre, Lyard and ProvostLefevre and others, 2000) listed in Table 1. The vector map is used to convert the 1996–2000 changes in line-of-sight velocity into changes in velocity magnitude assuming no change in ice-flow direction between those years:
For the period 1992–96, the same method cannot be used since the 1992 interferometric pairs span 6 days instead of 1day (Table 1), causing significant aliasing of the interferometric phase. In addition, the 1992 tracks do not exactly coincide with the 1996 tracks. Instead, we measure the 1992 flow velocity, V 92 ST, using a speckle-tracking (ST) technique (Reference Michel and RignotMichel and Rignot, 1999) in the along-track direction, t, of an ascending pass of ERS:
where ![]() is the 1992 vector velocity. The precision of speckle tracking is 1/30 of a pixel, which is 4m long in the along-track direction. Over a period of 6 days, this means a precision in V 92
ST of 10 ma–1. However, small undulations in pixel offset, probably caused by ionospheric disturbances (1992 was near solar maximum), limit the precision in the present case to ± 30ma–1. Speckle tracking is also applicable in the cross-track (line-of-sight) direction, but the pixel size in that direction is too large (20 m) to measure changes in ice velocity with sufficient precision.
is the 1992 vector velocity. The precision of speckle tracking is 1/30 of a pixel, which is 4m long in the along-track direction. Over a period of 6 days, this means a precision in V 92
ST of 10 ma–1. However, small undulations in pixel offset, probably caused by ionospheric disturbances (1992 was near solar maximum), limit the precision in the present case to ± 30ma–1. Speckle tracking is also applicable in the cross-track (line-of-sight) direction, but the pixel size in that direction is too large (20 m) to measure changes in ice velocity with sufficient precision.
The along-track velocity, ![]() is compared to its 1996 equivalent by projecting the 1996 vector velocity along the same direction,
is compared to its 1996 equivalent by projecting the 1996 vector velocity along the same direction,
Assuming no change in flow direction between 1992 and 1996, the 1992 flow vector is deduced from the 1996 flow vector using
The 1992 and 2000 velocity changes (Fig.2b and c) are compared to the 1996 reference velocity (Fig. 2a) in Figure 3 along the approximate center line of the glacier. Note that the 1992 along-track direction, t, and the 1996 line-of-sight direction, Los, differ only by 11°.
3. Results
Figure 3 shows that the flow acceleration of Pine Island Glacier coincides with the fast-flowing part of the glacier. It is largest at the grounding line, and affects both 4100 km of grounded ice and the floating ice shelf. The velocity increase is 100ma–1 at the inlandedge of the scene, or 8.5% of the 1996 velocity. It becomes 250ma–1 at the grounding line, or 10% of the 1996 velocity. The flow acceleration therefore decreases inland, decreases on the floating ice shelf (visible in Fig. 2, but not in Fig. 3) and is largest near the grounding zone.

Fig. 3. Increase in velocity magnitude of Pine Island Glacier, from A (distance=0) to B(distance=90) in Figure 2a, from 15 February 1992 to 11 November 1995 in green, 11 November 1995 to 20 November 1999 in red, 11 November 1995 to 24 February 1996 in dark blue, and 20 November 1999 to 4 March 2000 in light blue. The thin black lines represent a percentage of the 1996 velocity, varying linearly from 6.5% in Ato 8% in B for the time interval 1992–96, and from 8.5% in A to 10% in B for the time interval 1996–2000, and fixed at 0.8% for the two 105 day time intervals (blue curves). The thick black line represents 1/10 of the ice thickness from BEDMAP from A to B.
The 1992–96 flow acceleration varies from 6.5% of the 1996 velocity near km 0 to 8% near the grounding line. If the 1992 velocity is used as a reference, the percentage flow change becomes 6% and 7.5%, respectively. Within the uncertainty of the 1992–96 measurement (± 1%), the flow acceleration is therefore larger in 1996–2000 than in 1992– 96, and hence increases with time.
Table 2. List of ERS-1/-2 dates and orbits used for Thwaites Glacier
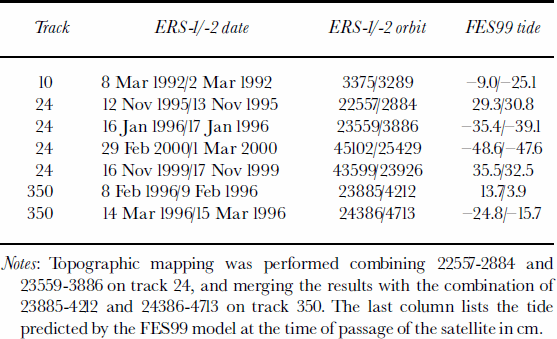
Image pairs acquired 105 days apart in late 1996 and 2000 (Fig. 2d and e) also show a flow acceleration, which suggests that the flow change is nearly continuous through time. The result also shows that flow changes over just 2 months are large enough to be detected with interferometric synthetic aperture radar (InSAR).
No flow acceleration is detected across the central part of Thwaites Glacier(Fig.4) between 1996 and 2000. In fact, the central part of the glacier experienced a slight reduction in ice velocity. However, two sectors about 10 km wide by 30 km long, near the grounding line, along the shear margins of the glacier, accelerated 4–20% (Fig. 5). This pattern of flow change indicates that the glacier shear margins migrated outward, by several km. The widening of the fas-flow portion of the glacier increased the mean velocity, and hence ice discharge, by about 4%, despite the relative slow-down of the central part of the glacier.

Fig. 4. (a) Line-of-sight velocity of Thwaites Glacier, 7 November 1995, track 24 (positive down-glacier); grounding-line position in 1992 (red), 1996 (white) and 2000 (black; incomplete data). Color code is the same as in Figure 2a–c. (b) Increase in line-of-sight velocity between 7 November 1995 and 29 February 2000 (1575 days). Profile A–B used in Figure 5 is black, with white dots spaced every 10 km.

Fig. 5. Increase in velocity magnitude of Thwaites Glacier, from A (distance = 0) to B (distance = 107), November 1995–February 2000, in red. The thin black line represents 10% of the 1996 velocity for reference.
4. Discussion
4.1. Mass balance
A consequence of the flow acceleration of Pine Island Glacier is that its basin is now certainly losing mass. Using ice thickness from BEDMAP (Reference Lythe and VaughanLythe and Vaughan, 2001) and the 1996 vector velocity map, the grounding-line flux is 75.1 ± 4 km3 ice a–1 in 1996, with a precision limited by a ± 50 muncertainty in thickness. This result compares well with the 76.1 ± 2 km3 ice a–1 grounding-line flux estimated using an ice thickness deduced from hydrostatic equilibrium (Reference RignotRignot, 1998). Using Equation (2), the flux is estimated at 82.6±4km3 ice a–1 in 2000, which is 10% higher. The 159120km2 basin of Pine Island Glacier accumulates 68.0 km3 icea–1 according to Reference Vaughan, Bamber, Giovinetto, Russell and CooperVaughan and others’ (1999) accumulation map, and 71.6 km3 icea–1 according to Reference Giovinetto and ZwallyGiovinetto and Zwally’s (2000). The average value is 69.8 km3 icea–1, with a 3 km3 ice a–1 uncertainty. The glacier mass balance is thus –12.8±5km3 icea–1 in 2000, compared to –5.3±5km3 ice a–1 in 1996. Similarly, using Equation (5), the glacier mass balance was only –0.7±5 km3 icea–1 in 1992.
The grounding-line discharge of Thwaites Glacier was estimated at 77 ± 8km3 ice a–1 in 1996, with an accumulation of 60.0 ± 3 km3 ice a–1 (average of the two accumulation maps) over a basin area of 166500 km2 (Reference RignotRignot, 2001). In 2000, the grounding-line discharge is 80.1 ± 8 km3 ice a–1, or 4% higher, and the mass balance is thus –20.1± 9 km3 ice a–1.
The combined mass balance of the basins of Pine Island and Thwaites Glaciers is –33 ± 10 km3 ice a–1, or 30 ± 9 Gt a–1 using an ice density of 917 kgm–3. If correct, this contributes a 0.08 ± 0.02 mma–1 global sea-level rise, using 360 Gt a–1 as the equivalent to a 1mm sea-level rise (Reference Jacobs, Hellmer, Doake, Jenkins and FrolichJacobs and others, 1992).
Using the BEDMAP thickness models, we calculate that Pine Island and Thwaites Glaciers contain 396330 and 306 910 km3 of ice, respectively, of which 250590 and 210 460 km3, respectively, are above sea level. Complete removal of ice from the basins would raise sea level by 0.7 and 0.55 m, respectively, for a combined total of 1.25 m. Hence, a sustained mass loss from this sector of West Antarctica would have a significant impact on sea level.
4.2. Ice thinning
The flow acceleration of Pine Island Glacier could either thin or thicken the ice, depending on the rate of flow change. Thicker ice advected from upstream causes thickening downstream, while enhanced longitudinal stretching of the ice creates a negative vertical strain which causes ice to thin. This is illustrated through the conservation-of-mass relationship applied to a vertical column of ice:
where ∂H/∂t is the glacier thickening rate, ȧ is the surface accumulation, ḃ is basal accumulation, V is the velocity vector, ▽ is the horizontal gradient operator, and ɛ̇ z is the vertically averaged vertical strain rate. The third term on the righthand side of the equation corresponds to thickening from advection, while the fourth term corresponds to thinning from vertical strain. If the glacier velocity increases by ![]() the thickening rate will change by
the thickening rate will change by
where ![]() is the change in strain rate. The change in ice thickness, δH = 1–2ma–1 according to Reference Shepherd, Wingham, Mansley and CorrShepherd and others (2001), is here neglected.
is the change in strain rate. The change in ice thickness, δH = 1–2ma–1 according to Reference Shepherd, Wingham, Mansley and CorrShepherd and others (2001), is here neglected.
We apply Equation (7) at two locations along profile A–B: (1) at km 25 (point A in Fig. 2) between km 0 and 50; and (2) at km 60 (point B’ in Fig. 2) between km 50 and 70. At A in 2000, we use: H =1850m, ▽H =(1700–1850)/(5x 104), ![]() = 130ma–1, and δ ɛ̇ z =– (150–100)/(5x 104) a–1. The calculated change in ice thickness is –0.4 ±0.2ma–1 for 1996–2000. The 0.2 ma–1 uncertainty is deduced from a ±10ma–1 uncertainty in velocity and a ± 50 m uncertainty in thickness. At B’, we have H = 1450m, ▽H = (1350–1700)/(2x 104),
= 130ma–1, and δ ɛ̇ z =– (150–100)/(5x 104) a–1. The calculated change in ice thickness is –0.4 ±0.2ma–1 for 1996–2000. The 0.2 ma–1 uncertainty is deduced from a ±10ma–1 uncertainty in velocity and a ± 50 m uncertainty in thickness. At B’, we have H = 1450m, ▽H = (1350–1700)/(2x 104), ![]() = 200 ma–1, and δ ɛ̇z =– (250–150)/(2x 104) a–1.The calculated rate of thickness change is –0.94± 0.4 m ice a–1 for 1996–2000.
= 200 ma–1, and δ ɛ̇z =– (250–150)/(2x 104) a–1.The calculated rate of thickness change is –0.94± 0.4 m ice a–1 for 1996–2000.
At A’ in 1996, ![]() = 110 ma–1, and
= 110 ma–1, and ![]() =– (115–65)/(56104) a–1 yield a thickness change of –0.4 ± 0.2 ma–1 for 1992–96. At B’, δV = 115 ma–1 and δ ɛ̇z =– (210–115)/(26104) a–1 yield a change in thickness of –0.95 ± 0.4m ice a–1 for 1992–96.
=– (115–65)/(56104) a–1 yield a thickness change of –0.4 ± 0.2 ma–1 for 1992–96. At B’, δV = 115 ma–1 and δ ɛ̇z =– (210–115)/(26104) a–1 yield a change in thickness of –0.95 ± 0.4m ice a–1 for 1992–96.
Hence, despite slight changes in flow acceleration between the two time intervals, the inferred rates of thinning are consistent from 1992 to 2000: 0.4m ice a–1 about 65 km upstream of the grounding line, and 0.95m ice a–1 about 15 km upstream of the grounding line.
These results compare well with Reference Shepherd, Wingham, Mansley and CorrShepherd and others’ (2001), but are probably lower in the case of B’. They report a mean thinning of 0.75 ± 0.07mice a–1 in the lower 150 km of the glacier, and 1.6 ± 0.2ma–1 about 13 km upstream of the grounding line. The thinning rate calculated using Equation (7), however, is in addition to that given by Equation (6), which is not known. The larger-magnitude thinning reported from satellite radar altimetry therefore suggests that the result of Equation (6) is negative, which means that the mass budget of the glacier would remain negative in the lower reaches even if there had been no acceleration in 1992–2000.
Thwaites Glacier, in contrast, shows no acceleration of its main trunk in 1992–2000. The estimate of the mass budget of its basin is, however, strongly negative, which means that the result of Equation (6) is negative. The migration of its shear margins in 1996–2000 suggests that the glacier has not reached stable flow conditions and that ice discharge may increase further in the future, augmenting the glacier mass deficit.
Thwaites Glacier must have accelerated in the past compared to equilibrium conditions. The flow increase, of the order of 30%, must have taken place well before 1992. The flow change of Thwaites Glacier is therefore likely of much older origin than that of Pine Island Glacier.
4.3. Nature of flow changes
The flow acceleration of Pine Island Glacier is unlike a conventional glacier surge, in which a bulge or surge front moves down-glacier as a kinematic wave at many times the ice velocity. A surge is usually expressed by a simultaneous acceleration and thickening of the glacier. Here, the flow change is accompanied by thinning (Reference RignotRignot, 1998; Reference Shepherd, Wingham, Mansley and CorrShepherd and others, 2001) over an extended period. Similarly, there is no evidence for a kinematic wave traveling up-glacier (Fig. 3), which would be expected if an abrupt change in ice-shelf condition were the cause of the acceleration.
Pine Island Glacier flows too rapidly to be frozen to its bed (Reference Vaughan, Alley and BindschadlerVaughan and others, 2001). It moves predominantly either by sliding over a non-deforming bed, or by resting on highly deformable basal sediments, or by a mix of the two mechanisms. In either case, the presence of basal water at a pressure close to the overburden pressure is required. An increase in basal water pressure would reduce the basal shear stress and enhance ice flow. The meltwater present beneath the glacier is produced in comparable amounts by both geothermal and frictional heating. An average geothermal flux of 54 mWm–2 over the basin of Pine Island Glacier melts 0.8 Gt a–1, if we assume that only half of the available heat melts the ice. Given a basal shear stress of 115 kPa, a sliding velocity of 1kma–1, and a sliding area of 306100 km (Reference Vaughan, Alley and BindschadlerVaughan and others, 2001), frictional heating melts about 0.7 Gt a–1. Frictional heating will not change unless the glacier speeds up considerably. Geothermal heating could be enhanced by several orders of magnitude near active volcanoes (Reference Clarke, Cross and BensonClarke and others, 1989), some of which are known to be present in the area (Reference LeMasurier and ThomsonLeMasurier and Thompson, 1990). Yet we have no evidence for recent volcanic activity in the area; and it is also unclear how sub-glacial volcanic activity could sustain a nearly constant rate of flow acceleration for well over a decade.
No remarkable change in ice-front position has been detected on Pine Island Glacier (Reference Jenkins, Vaughan, Jacobs, Hellmer and KeysJenkins and others, 1997). This situation may now be changing, however, as there is new evidence of cracking and fissuring of the ice shelf in Pine Island Bay (Rignot, in press). Assuming that the ice shelf exerts a buttressing effect on the inland ice, its progressive disappearance could in principle yield a flow acceleration similar to that observed with InSAR. This possibility is being investigated at present using numerical modeling, and the results will be reported in the future.
Although recent changes in ice velocity were reported in another main ice-stream/glacier system draining the West Antarctic ice sheet, the Siple Coast (Reference Whillans, Bentley and VeenWhillans and others, 2001) flow either slowed down or reverted to what it was beforehand, which was viewed by Reference BentleyBentley (1997) as being consistent with long-term equilibrium. The third major drainage route from West Antarctica, the Ronne Ice Shelf, shows no pronounced evidence of large imbalance or flow acceleration on the ice shelf (Reference Doake, Alley and BindschadlerDoake and others, 2001). Observed flow changes on Pine Island and Thwaites Glaciers therefore constitute the most compelling evidence for substantial contemporary ice-sheet retreat in West Antarctica. The observed changes are large, well documented, faster than anticipated and affect large areas. The consequences for the basins drained by these glaciers are significant in terms of their contribution to sea-level change.
5. Conclusions
Using satellite radar interferometry data, the grounding line of Pine Island Glacier was shown to retreat rapidly. Satellite altimetry data showed that thinning extended inland, over a large area, and was coincident with the area of fast flow of the ice. These observations suggested a dynamic effect was responsible for the observed thinning and grounding-line retreat. The data presented here fully demonstrate the dynamic nature of ice thinning in this region. The results, in turn, illustrate the high complementarity of satellite altimetry and satellite interferometry for documenting glacier changes.
Acknowledgements
This work was performed at the Jet Propulsion Laboratory, California Institute of Technology, under a contract with the National Aeronautics and Space Administration, Polar Program. The European Space Agency and the Canadian Space Agency are acknowledged for collecting and distributing the radar data employed in this study. We also thank T. Scambos, B. Lucchitta and S. Price for their reviews.


