

1. Introduction
The valuation of environmental goods is crucial for policy making. However, for non-market environmental goods, due to the absence of prices, obtaining valuation through the market fails. A common method used to measure willingness to pay (WTP) in non-market valuation is contingent valuation (CV), which recovers the preference by posing contingent questions to respondents, where they are asked to report how much they are willing to pay should an environmental improvement program be implemented. To ensure that the values thus obtained are not inconsistent or unstable, a scope test is often conducted that checks whether subjects value environmental improvement more when a greater environmental good is offered, that is, more is better. This property is known as scope sensitivity in CV studies. According to the CV National Oceanic and Atmospheric Administration (NOAA) Blue Ribbon Panel, the presence of scope sensitivity indicates internal or construct validity of the value estimates (Arrow et al., Reference Arrow, Solow, Portney, Leamer, Radner and Schuman1993). This recommendation was recently reaffirmed in Johnston et al.’s (Reference Johnston, Boyle, Adamowicz, Bennett, Brouwer, Cameron, Hanemann, Hanley, Ryan, Scarpa and Tourangeau2017) general principles for research of stated preference.
There are two ways in which scope tests have been conducted in the literature, namely, external scope (e.g., Heberlein et al., Reference Heberlein and Bishop2005; Sardana, Reference Sardana2019) and internal scope (e.g., Bateman et al., Reference Bateman, Cole, Cooper, Georgiou, Hadley and Poe2004; Smith, 2005; Breffle et al., Reference Breffle, Eiswerth, Muralidharan and Thornton2015). The external scope refers to the intra-subject scope test, i.e., different subjects are offered different levels (amounts) of the same environmental good. In contrast, the internal scope refers to the inter-subject scope test, i.e., the same subject is offered different levels (amounts) of the same environmental good. However, several papers conducting CV studies have reported scope insensitivity, that is, failure of the scope test (both internal and external) in CV studies (Kahneman and Knetsch, Reference Kahneman and Knetsch1992; Desvousges et al., Reference Desvousges, Gable, Dunford and Hudson1993; Diamond and Hausman, Reference Diamond and Hausman1994). Several papers (Kahneman, Reference Kahneman, Cummings, Brookshire and Schulze1986; Ajzen and Peterson, Reference Ajzen, Peterson, Peterson, Driver and Gregory1988; Heberlein et al., Reference Heberlein and Bishop2005) have argued that scope tests may fail even for consistent and stable preferences.
Kahneman and Knetsch (Reference Kahneman and Knetsch1992) used an embedding experiment to discover that the same good has a lower WTP when valued as part of a bundle rather than on its own. The authors found that for respondents who are willing to pay to obtain moral satisfaction rather than revealing their true preferences for the environmental good, changing the scope of the good should have little effect on WTP. Heberlein et al. (Reference Heberlein and Bishop2005) explored the role of non-economic factors (behavioral) in the scope test. They explored whether there exists evidence of a non-economic scope between the more and the less (that is, does the respondent like, know or think more about the more rather than the less of the environmental good.) In Heberlein et al. (Reference Heberlein and Bishop2005), the scope is introduced at the beginning before the non-economic factor questions appear, thus introducing a possible channel through which the WTP can be affected by scope in the non-economic factors. However, in Sardana (Reference Sardana2019), the scope is introduced after respondents answer questions about non-economic factors, thus ensuring a direct channel of noneconomic scope explaining WTP differences (for more and less) is not present.
Behavioral anomalies may create scope insensitivity even if the usual preference axioms of consumer theory hold (Banerjee and Murphy, Reference Banerjee and Murphy2005; Whitehead, Reference Whitehead2016). Heberlein et al. (Reference Heberlein and Bishop2005) discovered that knowing more, liking more, and having more experience at a local level than at a larger level leads respondents to appreciate local diversity more than biodiversity in a broader region.
In the same vein, we argue that scope insensitivity may imply neither an inconsistent nor unstable preference. We extend the possible set of behavioral explanations to include the mental accounting theory, as proposed by Thaler (Reference Thaler1985). Our theoretical and empirical exercises show that we can accommodate consistent and stable preferences with scope insensitivity. Applying the extended mental accounting theory for non-market goods, we show that if subjects in CV studies use mental accounts, then under some conditions, they may violate scope insensitivity tests even when their valuation of more of the environmental goods is indeed higher than less of it. Our empirical analysis in this paper which is based on Sardana (Reference Sardana2019) suggests that, if researchers incorporate mental accounting into a CV questionnaire, the resulting estimation of WTP will be more robust.
The subsequent sections are organized as follows. Section 2 introduces mental accounting theory, extends it for non-market goods, and shows how it works in our context through an illustrative example. Section 3 elaborates on the empirical application and produces predictions in context using the results of Section 2. Section 4 reports all results. Section 5 discusses our assumption and specification; and, finally, Section 6 concludes the research.
2. Theoretical framework
2.1. Mental accounting
Thaler (Reference Thaler1985) first proposed mental accounting theory as a possible explanation for non-standard behavior. According to this theory, agents have different mental accounts for topically and temporally separate purchases. This idea implies that even if agents have a rational preference, their choices can be different from those of a standard, neoclassical agent due to use of mental accounts.
In this paper, we consider a model of mental accounting with only topical separation of psychological accounts.Footnote 1 For example, consumers can have different mental accounts for food, recreation, and education. The critical assumption of the model is that money is not fungible in these different mental accounts.
Consider an agent who maintains  $n$ mental accounts that are topically separate. For simplicity, assume that $\mathbf{x}_{i}$ denotes the vector of goods in account i, and $u_{i}(\mathbf{x}_{i})$ denotes the utility function for account $\textit{i}$. Suppose that the total utility is additive on all accounts and is given by
 \begin{equation}
U(\mathbf{x}_{1} ,\dots, \mathbf{x}_{n}) = \sum_{i=1}^{n}u_{i}(\mathbf{x}_{i}).
\end{equation}
\begin{equation}
U(\mathbf{x}_{1} ,\dots, \mathbf{x}_{n}) = \sum_{i=1}^{n}u_{i}(\mathbf{x}_{i}).
\end{equation} Let  $M$ be the total income of the agent in a given period, and $\theta_{i}$ denotes the proportion of income they have set aside for account $i$, that is, $\theta_{i}M$ denotes the budget for account $i$.Footnote 2 Thus, the budget constraint of the agent with a mental account would be different from the same for a neoclassical agent. Let $\mathbf{p}_{i}$ denote the price vector in account $i$ and $\mathbf{x}_{i}$ denote the consumption vector. Then we can rewrite the budget constraints as follows:
 \begin{align}\!\!\!\!\!\!\!\!\!\!\!\!\!\!\!\!\!\!\!\!\!\!\!\!\!\!\!\!\!\!\!\!\!\!\!\!\!\!\!\!\!\ NC: \quad \sum_{i}\mathbf{p}_{i}\mathbf{x}_{i} \leq M
\end{align}
\begin{align}\!\!\!\!\!\!\!\!\!\!\!\!\!\!\!\!\!\!\!\!\!\!\!\!\!\!\!\!\!\!\!\!\!\!\!\!\!\!\!\!\!\ NC: \quad \sum_{i}\mathbf{p}_{i}\mathbf{x}_{i} \leq M
\end{align} \begin{align} MA: \quad \mathbf{p}_{i}\mathbf{x}_{i}\leq \theta_{i}M \quad \forall i\in\left\lbrace 1, \dots, n\right\rbrace,
\end{align}
\begin{align} MA: \quad \mathbf{p}_{i}\mathbf{x}_{i}\leq \theta_{i}M \quad \forall i\in\left\lbrace 1, \dots, n\right\rbrace,
\end{align} where  $\mathbf{p}_{i}\mathbf{x}_{i}$ denotes the total expenditure in account $i$. Inequality (2) denotes the budget equation for a neoclassical agent (NC), and the second set of inequalities (Equation (3)) refers to an agent with mental accounting (MA).
We extend this model to incorporate non-market goods for which prices are not available. Suppose that the account  $j$ contains only two goods, a non-market good $x_{j}$ and a composite good $x_{-j}$. For simplicity, we write the utility function for account $j$ as
 \begin{equation} u_{j}(\mathbf{x}_{j}) = v(x_{j}) + x_{-j}.
\end{equation}
\begin{equation} u_{j}(\mathbf{x}_{j}) = v(x_{j}) + x_{-j}.
\end{equation} That is, the utility function in account  $j$ is quasi-linear in the non-market good $x_{j}$.Footnote 3 Instead of a price, we assume that the consumer is offered a choice of a given amount $\bar{x}_{j}$ of the non-market good $x_{j}$. The agent can respond “yes” or “no” to the offered bid $b$ for $\bar{x}_{j}$. Let $v(\bar{x}_{j})$ and $v(0)$ denote the levels of utility when the consumer chooses “yes” or “no”, respectively. Under the neoclassical paradigm, the agent would be willing to opt for $\bar{x}_{j}$ if and only if
 \begin{equation}\sum_{i\neq j} u_{i}(\hat{\mathbf{x}}_{i}) + v(\bar{x}_{j}) + \hat{x}_{-j} \geq \sum_{i\neq j} u_{i}(\hat{\mathbf{x}}_{i}^{\prime}) + v(0) + \hat{x}_{-j}^{\prime}
\end{equation}
\begin{equation}\sum_{i\neq j} u_{i}(\hat{\mathbf{x}}_{i}) + v(\bar{x}_{j}) + \hat{x}_{-j} \geq \sum_{i\neq j} u_{i}(\hat{\mathbf{x}}_{i}^{\prime}) + v(0) + \hat{x}_{-j}^{\prime}
\end{equation} \begin{equation} \sum_{i\neq j} \mathbf{p}_{i}\hat{\mathbf{x}}_{i} + b + p_{-j}\hat{x}_{-j} = \sum_{i\neq j} \mathbf{p}_{i}\hat{\mathbf{x}}_{i}^{\prime} + p_{-j}\hat{x}_{-j}^{\prime}\leq M,
\end{equation}
\begin{equation} \sum_{i\neq j} \mathbf{p}_{i}\hat{\mathbf{x}}_{i} + b + p_{-j}\hat{x}_{-j} = \sum_{i\neq j} \mathbf{p}_{i}\hat{\mathbf{x}}_{i}^{\prime} + p_{-j}\hat{x}_{-j}^{\prime}\leq M,
\end{equation} where  $\hat{\mathbf{x}}_{i}$ and $\hat{\mathbf{x}}_{i}^{\prime}$ in Equations (5) and (6) denote the optimal choices for all other accounts $i\neq j$; $\hat{x}_{-j}$ and $\hat{x}_{-j}^{\prime}$ denote the optimal choices in account $j$, excluding the non-market good under “yes” or “no” options, respectively; and $p_{-j}$ refers to the price in account $j$ excluding the non-market good. Thus, the NC agent would say “yes” to bid $b$ if the non-market good improves their total utility, subject to their overall budget constraint.
However, the agent faces a different choice problem under the mental accounting framework. Note that the choice of “yes” or “no” in account  $j$ does not affect the choices in any other account, since the MA agent has separate mental accounts for different types of expenditure. Thus, the MA agent would be willing to opt for $\bar{x}_{j}$ if and only if
 \begin{equation} v(\bar{x}_{j}) +x_{-j} \geq v(0) + x_{-j}^{\prime}
\end{equation}
\begin{equation} v(\bar{x}_{j}) +x_{-j} \geq v(0) + x_{-j}^{\prime}
\end{equation} \begin{equation} b+ p_{-j}x_{-j} \leq \theta_{j}M;\!\!\!\!\!\!\!\!\!\!\!\!\!\!\!\!\!\!\!\!\!\!
\end{equation}
\begin{equation} b+ p_{-j}x_{-j} \leq \theta_{j}M;\!\!\!\!\!\!\!\!\!\!\!\!\!\!\!\!\!\!\!\!\!\!
\end{equation} \begin{equation}
p_{-j}x_{-j}^{\prime} \leq \theta_{j} M,\!\!\!\!\!\!\!\!\!\!\!\!\!\!\!\!\!\!\!\!\!\!\!\!\!\!\!\!\!\!\!\!\!\!\end{equation}
\begin{equation}
p_{-j}x_{-j}^{\prime} \leq \theta_{j} M,\!\!\!\!\!\!\!\!\!\!\!\!\!\!\!\!\!\!\!\!\!\!\!\!\!\!\!\!\!\!\!\!\!\!\end{equation} where  $x_{-j}$ and $x_{-j}^{\prime}$ denote the optimal levels of all other goods except the non-market good $x_{j}$ in account $j$ under “yes” or “no” choices, respectively. The inequality in Equation (7) implies that the net value of opting for the non-market good in account $j$ is better than not opting for it. The inequality in Equation(8) ensures that the budget constraint for account $j$ is satisfied. Thus the MA agent would say “yes” to bid $b$ if the non-market good improves their total utility, subject to the budget constraint in the relevant mental account $j$.
$j$.
To explore these inequalities further, assume that 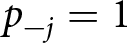 $p_{-j} =1$.Footnote 4 If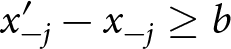 $x_{-j}^{\prime}-x_{-j}\geq b$, then we can rewrite Equation (7) for the MA agent as
 \begin{equation} v(\bar{x}_{j}) + \theta_{j}M -b \geq v(0) + \theta_{j}M.
\end{equation}
\begin{equation} v(\bar{x}_{j}) + \theta_{j}M -b \geq v(0) + \theta_{j}M.
\end{equation}Upon simplification, we can rewrite the optimization condition of MA agents as
 \begin{equation}
\quad\quad v(\bar{x}_{j}) -b \geq v(0)
\end{equation}
\begin{equation}
\quad\quad v(\bar{x}_{j}) -b \geq v(0)
\end{equation} \begin{equation} b \leq \theta_{j}M - x_{-j} \equiv M_{j}.
\end{equation}
\begin{equation} b \leq \theta_{j}M - x_{-j} \equiv M_{j}.
\end{equation}Combining the two inequalities in Equations (11) and (12), we find that the agent would be willing to opt for “yes” if and only if the following inequality holds:
 \begin{equation} b \leq \min \left\lbrace M_{j}, v(\bar{x}_{j})-v(0) \right\rbrace.
\end{equation}
\begin{equation} b \leq \min \left\lbrace M_{j}, v(\bar{x}_{j})-v(0) \right\rbrace.
\end{equation} Using this framework, we want to investigate the scope sensitivity of an MA agent. In this model, we only consider the external scope. To define the external scope, we consider two different levels of the environmental good offered in account  $j$, such that one level is strictly higher than the other. Proposition 1 explains the impact of mental accounts on the sensitivity of external scope.
Proposition 1. Suppose that  $v(x_{j})$ increases strictly monotonically in the amount of $x_{j}$ and $b$ is given. For an MA agent, the probability of opting for the non-market good in account $j$ (i.e., choosing “yes”), will not be monotonically increasing in $v(x_{j})$ if $M_{j}$ is sufficiently small.
Proof. Consider two possible levels of the non-market environmental good  $\bar{x}^{1}_{j}$ and $\bar{x}^{2}_{j}$ and a bid $b$. If $\bar{x}^{1}_{j}$ denotes a strictly higher amount of environmental good, then by strict monotonicity of $v(x_{j})$,
 \begin{equation}
v(\bar{x}^{1}_{j}) \gt v(\bar{x}^{2}_{j}).
\end{equation}
\begin{equation}
v(\bar{x}^{1}_{j}) \gt v(\bar{x}^{2}_{j}).
\end{equation} Thus, if  $v(\bar{x}^{2}_{j}) - v(0) \gt b$, then with probability 1 we have $v(\bar{x}^{1}_{j}) -v(0) \gt b$.
However, we also need to consider the budget constraint of the MA agent here. Suppose that  $M_{j}$ is sufficiently small such that
 \begin{equation} b \gt \theta_{j}M -x_{-j} \equiv M_{j}.
\end{equation}
\begin{equation} b \gt \theta_{j}M -x_{-j} \equiv M_{j}.
\end{equation} This can happen if either  $\theta_{j}$ is sufficiently small, i.e., the consumer has allotted a small budget for account $j$, or $x_{-j}$ is sufficiently large, i.e., the consumer has already spent a significant amount out of account $j$.
$j$.
Under Equation (15), the optimal choice for the MA agent would be “no” under both offers  $\bar{x}^{1}_{j}$ and $\bar{x}^{2}_{j}$ as given in Equations (16) and (17),
 \begin{equation}
b \gt \min \left\lbrace M_{j}, v(\bar{x}^{1}_{j})-v(0) \right\rbrace
\end{equation}
\begin{equation}
b \gt \min \left\lbrace M_{j}, v(\bar{x}^{1}_{j})-v(0) \right\rbrace
\end{equation} \begin{equation}
b \gt \min \left\lbrace M_{j}, v(\bar{x}^{2}_{j})-v(0) \right\rbrace.
\end{equation}
\begin{equation}
b \gt \min \left\lbrace M_{j}, v(\bar{x}^{2}_{j})-v(0) \right\rbrace.
\end{equation} $M_{j}$ is sufficiently small, i.e., when Equation (15) is satisfied.
This shows that, even if 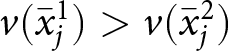 $v(\bar{x}^{1}_{j}) \gt v(\bar{x}^{2}_{j})$, the probability of choosing “yes” is not strictly higher when $v(\bar{x}^{1}_{j})$ is offered for bid $b$. Hence, proved.
Note that the same would not be valid for an NC agent. Since they do not use separate mental accounts, they would be willing to choose “yes” if the benefit of doing so is higher than the cost, assuming that the budget constraint is not binding. That is, if  $M$ is sufficiently high compared to $b$.
$b$.
2.2. An illustrative example
Consider an agent who decides whether to pay for a non-market good in a single bounded dichotomous choice questionnaire. The agent chooses whether to pay a bid  $b$ based on two principles: first, the standard neoclassical argument, given by Equation (18) as
 \begin{equation} w \geq b,
\end{equation}
\begin{equation} w \geq b,
\end{equation} where  $w$ denotes the marginal value of the environmental good, that is,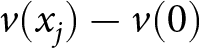 $v(x_{j})-v(0)$, and $b$ denotes the bid price. If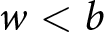 $w \lt b$, that is, if the agent’s WTP is less than the proposed bid, they would not contribute. Second, whether the total expenditure, that is, the bid amount $b$ exceeds the amount $M_{j}$ (that is,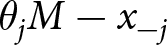 $\theta_{j}M-x_{-j}$, the residual budget for the environmental good) specified by the mental account $j$ that contains the environmental good, given as
 \begin{equation} b \leq M_{j}.
\end{equation}
\begin{equation} b \leq M_{j}.
\end{equation}Motivated by our specification, consider an external scope test in this questionnaire, where subjects are offered one of the two scopes. The large scope is one unit of the environmental good, and the small scope is one-third of the environmental good.
Note that if  $w$ is sufficiently higher than the bid, but $M_{j}$ (the residual budget of the environmental good) is sufficiently small, the second constraint is binding, while the first is not. For example, suppose that a respondent has a marginal value of $ w = 900$ for one unit of the environmental good. This implies that if offered to restore only one-third unit of the environmental good, their marginal valuation would be $w=300$. Consider now a bid price of $ b=250$. If the respondent does not have mental account constraints, they would be willing to pay regardless of how much environmental good is offered. In summary, for any $b\in (300, 900)$, the NC respondents will only pay for one unit, not a one-third unit of the environmental good. Using similar logic, for any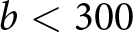 $b \lt 300$, the NC respondent will pay for both; and, if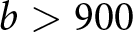 $b \gt 900$, the NC respondent will pay for neither.
Now consider a respondent who has a residual budget of 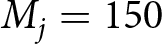 $M_{j} = 150$ for the environmental good in question. If $b=250$, they will not pay, irrespective of the amount of the environmental good offered, whereas if $M_{j}=300$, they will pay for both amounts, again irrespective of the amount of the good offered. Thus, a strict mental accounting constraint can create sensitivity to the external scope.
3. Empirical application
3.1. Survey design and data collection
Data from the Sardana (Reference Sardana2019) field experiment was used for empirical estimation. The field experiment was based on an on-site survey sample of 1,027 visitors. Tourists visiting three adjoining sites (National Park and Wildlife Sanctuaries that are declared protected areas) to the coffee plantations, namely Nagarhole National Park, Iruppu Falls, and Mandalpatti, in the Kodagu district of Karnataka, India, were intercepted. A random sample composed of an equal number of observations from the three sites was collected. The survey was conducted on weekends in January 2016. The respondents were randomly selected at the ticket counter or at the exit gate. The policy described to the respondents was to raise revenue to restore native trees in private coffee plantations. For this purpose, a coercive payment was introduced, in the form of a surcharge on the entrance fee to protected areas, which would be levied on all respondents above the age of 18 years, if they voted in favor of the restoration program. The survey instrumentFootnote 5 was randomized according to seven bids and two split samples. There were a total of 14 schedules for every instrument that were randomized among respondents.
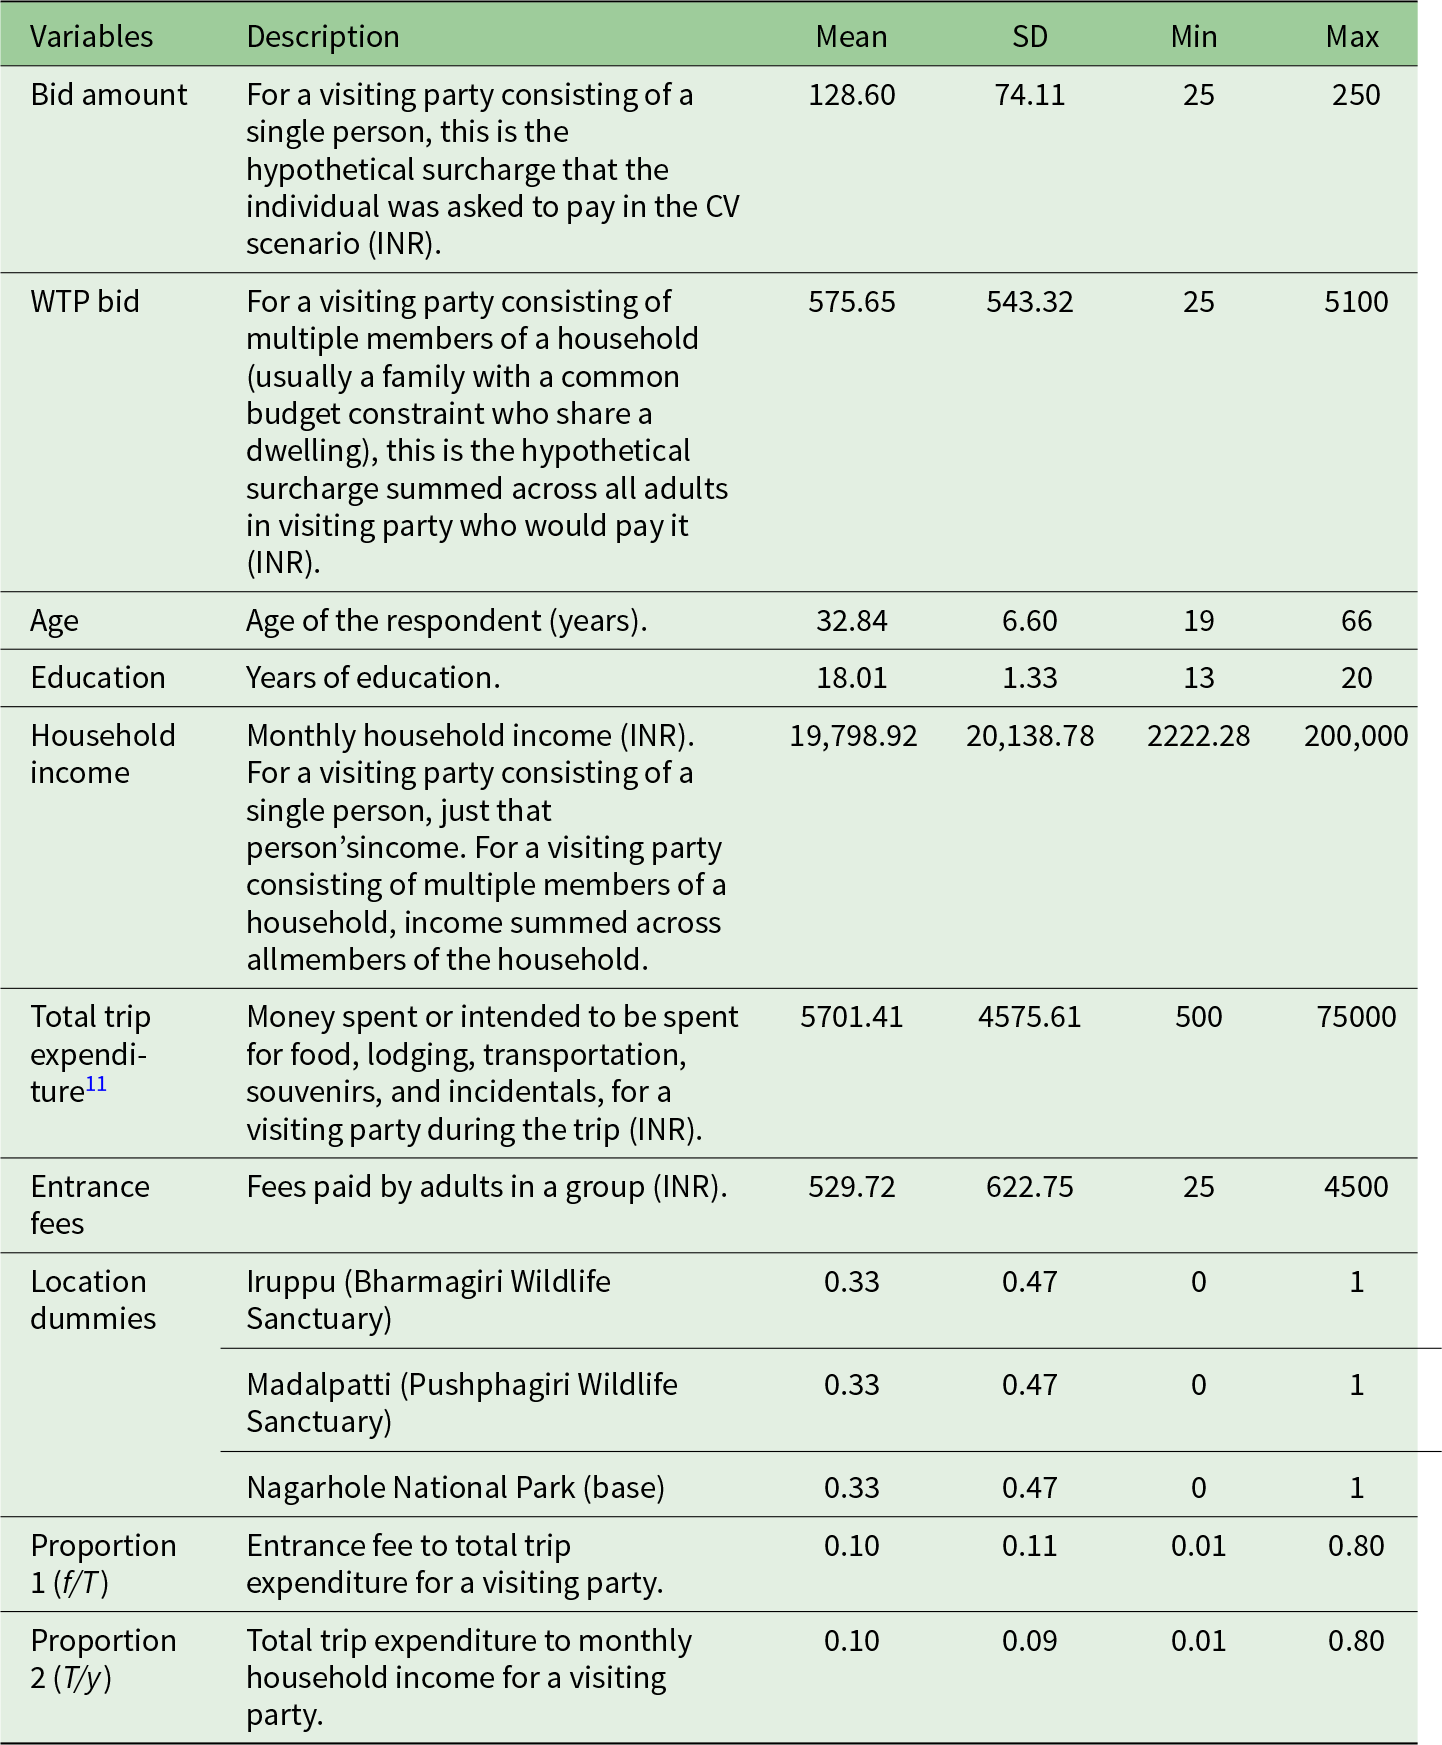
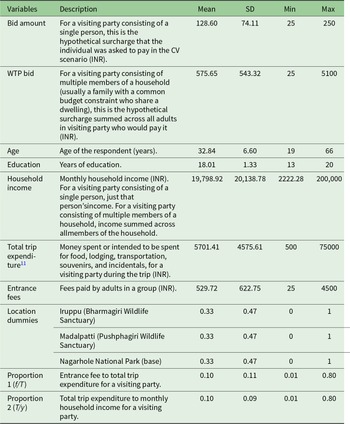
Fifty-six per cent of respondents said “yes” to paying the surcharge and forty-four percent said “no”. The binary response to the WTP question is the dependent variable in our analysis. Additionally, information on socio-economic variables and site-specific variables was collected. Table 1 in Section 3.4.2 describes the variables used in our analysis and their summary statistics.
Description of variables used for statistical analysis ( $n=1027$)
3.2. Measuring mental accounts
In the study, respondents’ valuations for restoring native trees is measured using the CV method. The respondents were asked if they would be willing to pay the offered bid (in the form of a surcharge above the entrance fees). In split sample I, for every visitor who paid the higher entrance fee, one native tree would be restored. In split sample II, for every visitor who paid the higher entrance fee, one-third of a native tree would be restored. Therefore, split sample I is the larger scope (with more of the environmental good) and split sample II is the smaller scope (with less of the environmental good) in our study.
To apply the mental accounting model in this context, we need to measure the relevant mental accounts that respondents might be using when deciding how much to pay for a restoration program in the form of a surcharge. Since the surcharge will be paid on the entrance fees to the national park, we assume that the subjects put the expenditure for it in their recreational budget. In the absence of a direct measure of the recreational budget, we use the spending data, namely total trip expenditure (amount spent during their trip, excluding entrance fees to the park) and the entrance fees paid by the respondents. Using their spending data, we can show that subjects who are more likely to be constrained by their mental account for recreational goods are less likely to pay for the restoration program.
Egan et al. (Reference Egan, Corrigan and Dwyer2015) tested the mental accounting hypothesis in a CV model by providing a split sample treatment where payment schedules differ. They found evidence that mental accounting explains a modest difference between one-time and annual WTP when presented with ongoing payments. Since in our study, the time dimension across the split sample is irrelevant, a similar analysis would not be informative. To implement the idea of mental accounting in our empirical model, we need to know the mental account that the subject had assigned for the environmental good and how to estimate it. Unfortunately, these data were not collected in the original survey (Sardana, Reference Sardana2019). To avoid this issue, we instead considered data regarding the actual financial decision that we can observe in the data.
In the survey, subjects were asked to report their payment of the entrance fee to the national park. Since the environmental good in question (native tree restoration) enhances the recreational experience of visiting national parks, we assume that both these expenditures – the entrance fee and the contribution to restoring native trees (as a surcharge above the entrance fee) – would belong to the same mental account, which we refer to as  $R$ (for recreation). In addition, in the field experiment, subjects were asked about their WTP to restore native trees through a surcharge on the entrance fee, which further strengthens our argument.
Suppose that an agent has a residual budget of 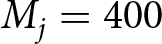 $M_{j} = 400$ for the account $R$ before paying the entrance fee. If they now paid the entrance fee of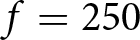 $f = 250$, they would have only $150$ remaining in the account and would not be willing to contribute for the restoration program if the bid-amount (for the restoration program in the form of surcharge) was $b=250$. On the other hand, they might be willing to contribute to the restoration program if they pay only $f = 75$ and are left with $325$. Assuming that both types of expenditures are part of the same account, we can use the heterogeneity of one to learn about the other, assuming $R$ is known.Footnote 6
We argue that the total trip expenditure, called  $T$, can proxy for the unobserved value of $R$. For each respondent, we measure the ratio of the entrance fee paid ( $f$) to the total trip expenditure ( $T$).Footnote 7 Conceptually, the residual budget left to pay the surcharge would be given by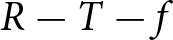 $R-T-f$; alternatively, it would be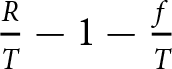 $\frac{R}{T}-1-\frac{f}{T}$. If we assume $\frac{R}{T}$ to be constant for our subjects (as we assume $T$ is a good proxy for $R$), a higher $\frac{f}{T}$ would imply a lower residual budget left to pay the surcharge.Footnote 8
Based on this ratio ( $\frac{f}{T}$), we divide the entire sample into seven expenditure classes with a range of subjects who spend from 1–8 per cent to more than 40 per cent of their trip expenditures on visits to the national park.Footnote 9
3.3. Predictions
We conjecture that agents for whom the proportion of entrance fee to the total trip expenditure is high, that is, who belong to a higher expenditure class would be more likely to be constrained by the mental account, that is, 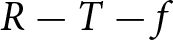 $R-T-f$. Consequently, the probability of choosing “yes” would be more likely to be lower for the higher expenditure classes. Since MA constraints directly affect WTP for agents, we would instead consider the probability of choosing “yes” for a random $b$ offered to agents. Thus, using Proposition 1, we make the following predictions.
Prediction 1.
If respondents are subject to mental accounting constraints, the probability of choosing “yes” would be lower for a higher expenditure class (less residual budget).
Note that standard neoclassical arguments cannot explain this decreasing pattern.Footnote 10 If we argue that agents in a higher expenditure class have a higher valuation for recreational activities, then they will be more likely to say “yes”. Moreover, Proposition 1 also shows the impact of mental accounting on scope insensitivity. If mental accounting constraints are binding, that is, 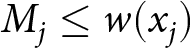 $M_{j} \leq w(x_{j})$, then the probability of saying “yes” would not increase monotonically for $x_{j}$ offered, implying the following prediction.
Prediction 2.
Suppose that the respondents are subject to binding mental accounting constraints for the environmental good. In that case, the probability of choosing “yes” will not vary monotonically with the level of environmental good offered, that is, scope insensitivity would be observed.
Following Proposition 1, when respondents are subject to binding mental accounting constraints for the environmental good, the relevant inequality for decision making becomes whether 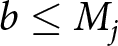 $b\leq M_{j}$. Thus, even if the value of the offered good is higher than the bid amount, the agent will not choose “yes”.
3.4. Methods
3.4.1. Predicting probabilities and measuring WTP
Given that respondents would respond with a “yes” or “no” to a single bid amount, the probability of respondents paying a given bid amount is statistically estimated using a qualitative choice model. However, the statistical distribution of the WTP must be established before the model can be estimated. We use the logit model for the parametric model and the Turnbull estimator for the non-parametric model.
3.4.2. Parametric model
We predict the probability that the respondent will say “yes” and their WTP using the logit model in Equation (20) as
 \begin{equation} Pr(Y=1|X)=G(X\beta),
\end{equation}
\begin{equation} Pr(Y=1|X)=G(X\beta),
\end{equation} where X is the matrix of explanatory variables and G(.) takes on values in the open unit interval  $0 \lt G(z) \lt 1$ for all $z \in \mathbb{R}$.
 \begin{equation} G(z) \equiv\Delta(z)\equiv \dfrac{exp(z)}{1+exp(z)},
\end{equation}
\begin{equation} G(z) \equiv\Delta(z)\equiv \dfrac{exp(z)}{1+exp(z)},
\end{equation}is the standard logistic distribution in Equation (21). Explained variation in response probabilities, that is, X in Equation (20), is given by the variables described in Table 1.
WTP is estimated using Equation (22) as
 \begin{equation}WTP= -X\beta/\beta_{\textit{bid}.}
\end{equation}
\begin{equation}WTP= -X\beta/\beta_{\textit{bid}.}
\end{equation}3.4.3. Non-parametric model
We use the Turnbull estimator for the non-parametric model. The benefit of this technique is that it eliminates the need for a precise WTP distribution assumption. The lower bound WTP is given by Equation (23) (Haab and McConnell, Reference Haab and McConnell2002) as
 \begin{equation} E_{LB}(WTP)= \sum _{j=0} ^{M^{*}}t_{j}(F^{*}_{j+1}-F^{*}_{j}).
\end{equation}
\begin{equation} E_{LB}(WTP)= \sum _{j=0} ^{M^{*}}t_{j}(F^{*}_{j+1}-F^{*}_{j}).
\end{equation}  $F^{*}_{j+1}$ is the Turnbull estimated cumulative distribution function with the property that the proportion of “no” responses decreases as the bid price increases and is for bids indexed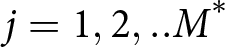 $j=1,2,..M^{*}$, where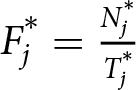 $F^{*}_{j}= \frac{N^{*}_{j}}{T^{*}_{j}}$, $N^{*}_{j}$ is the number of “no” responses to the bid $t_{j}$ and $T^{*}_{j}$ is the total number of bids offered $t_{j}$.
4. Results
4.1. Observations summary and further analysis
Sardana (Reference Sardana2019) finds scope sensitivity (that is, respondents who are offered more environmental good have a higher probability of saying “yes” to the WTP question). The study uses the standard way to check the sensitivity of the scope using the dummy for split samples in the probability model. Borzykowski et al. (Reference Borzykowski, Baranzini and Maradan2018) discuss the importance of systematic scope tests, both parametric and non-parametric, for revealing their scope effects. This indicates further investigation of the data to establish the scope effects.
4.2. Systematic scope test
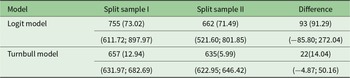
For routine scope tests, we bootstrap WTP and differences in WTP across two split-samples using the parametric model (logit specification) and non-parametric model (Turnbull specification) in Table 2.
Group WTP estimates from parametric and non-parametric models ( $n=1027$)
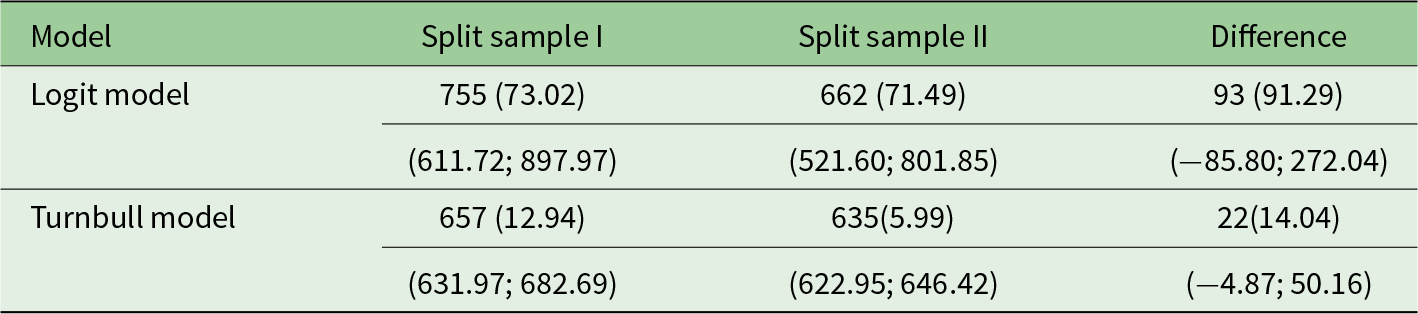
Note: Bootstrap standard errors and 95% confidence intervals are shown by the first and second numbers in parentheses, respectively.
The WTP per group in Indian rupees (INR) for split-sample 1 and 2 is INR 755 and 662, respectively. We also estimate mean WTP using the Turnbull estimator. Mean WTP is INR 657 and 635 for split sample 1 and 2, respectively. An average number of four adults can be used to calculate an individual mean WTP for the logit model at INR 188.75 and 165.50 for split sample 1 and split sample 2, respectively, and INR 164.25 and 158.75 for split sample 1 and split sample 2, respectively for the Turnbull estimate. We find that the difference in the mean WTP across two split samples is statistically insignificant in both specifications, logit and Turnbull, pointing to scope insensitivity.
Furthermore, we also estimate the arc elasticity, proposed by Whitehead (Reference Whitehead2016), to test the scope elasticity of the WTP estimate. The standard scope test relates to statistical significance. The elasticity measure is a way to assess the plausibility of economic significance. The arc elasticity is therefore used as another measure thats test presence of scope in our analysis. According to Lopes and Kipperberg (Reference Lopes and Kipperberg2020), elasticities with confidence intervals in the [0;1] range are feasible since they follow the positive but declining marginal utility theory. More precisely, Whitehead (Reference Whitehead2016) conducted Monte Carlo simulations of the WTP and elasticity estimates and found a 95 per cent confidence interval of elasticity estimates ranging from 0.17 to 0.99. This simulation is not definitive, but it does point to a range of realistic elasticities that could be expected from WTP functions with statistically significant scope effects.
In Table 3, we report arc elasticity estimates (assuming a quasi-linear utility function), bootstrap standard errors, and 95 per cent confidence intervals for parametric model (logit specification) and non-parametric (Turnbull specification). For both parametric and non-parametric specifications, in this case, the 95 per cent confidence interval is suggestive of scope insensitivity.
Arc scope elasticity estimates for parametric and non-parametric model ( $n=1027$)

Note: Bootstrap standard errors and 95% confidence intervals are shown by the first and second numbers in parentheses, respectively.
4.3. Testing presence of mental accounts
In this section, we test for prediction 1. Prediction 1 says that, for an MA agent, there will be a negative relationship between the probability of saying “yes” and expenditure classes. We test this when we consider two hypotheses.
Hypothesis 1.
The probability of saying “yes”, which is measured by the logit regression mentioned in Section 3.4.2, will be identical across different expenditure classes. Mental accounting can only be a valid explanation for our data if Hypothesis 1 is rejected.
Hypothesis 2.
If we reject Hypothesis 1, we want to test whether the proportion of respondents who say “yes” has a negative relationship with expenditure class.
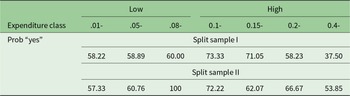
Our main results are shown in Table 4. We report the proportion of respondents who say “yes” to the WTP question (based on predicted probabilities estimated using the logit model) for each expenditure class. Expenditure classes are characterized as low group and high group based on the proportion of entrance fees to total trip expenditures. A low group indicates respondents with a lower proportion of entrance fees to total trip expenditures and vice versa. We perform the chi-square test with the null hypothesis that the percentage of respondents who say “yes” to the WTP question is the same for different expenditure classes. Our chi-square statistic is 10.5 with 6 degrees of freedom, with a p-value of 0.10. We reject the null in favor of the alternative, that is, the proportion of respondents who say “yes” to the WTP question is statistically different between the expenditure classes at a 10 per cent significance level. The rejection of Hypothesis 1 implies that the application of mental accounting is valid in our context.
Percentage of “yes” respondents to the WTP question, by expenditure class, based on the logit equation ( $n=1027$)

However, we did not find consistent evidence of Hypothesis 2 in all expenditure classes. To differentiate between the subgroup for which Hypothesis 2 is satisfied, we divide all expenditure classes into two groups. As shown in Table 4, in the high group as the proportion increases, the probability of saying “yes” to the WTP question decreases. This aligns with our mental accounting hypothesis. For this group, the total trip expenditure is more likely to proxy for account  $R$ (recreational budget as explained in Section 3.2). As a result, as the proportion increases, the respondents are more likely to be constrained in their budget for $R$. In this case, the mental accounting theory would predict that the higher the proportion, the lower the probability of saying “yes” to the WTP question, which is, indeed, the case here.
For the low group, however, we do not find evidence supporting Hypothesis 2. Since too little of a portion of their total trip expenditure is spent on the national park visit, it is unclear whether the expenditure share variable (i.e., the share of entrance fee to total trip expenditure), would proxy for the mental account that is applied for the relevant decision making here. We observe that the proportion of people saying “yes” increases with the increase in expenditure share for the group. This can be due to various reasons, including mental accounting, but we cannot test it given our data limitation.
4.3.1. Robustness check
Mental accounting theory introduces additional budget constraints in the valuation problem. For any substantial change, since MA agents have a more restricted budget compared to NC agents, they would be more likely to be constrained by disposable (or residual) income. In our regression results (see appendix A), we find evidence of statistical significance of the income variable in explaining probability of saying “yes” to the WTP question. In Tables 5 and 6, we report robustness check by evaluating the role of income in mental accounting only for high expenditure class. This is because we find evidence supporting Hypothesis 2 for high expenditure class.
Percentage of “yes” respondents to WTP question, by classification based on income, based on the logit equation ( $n=1027$)

Percentage of “yes” Respondents to WTP question, for High Expenditure Class, based on the logit equation according to income quartiles ( $n=1027$)

For this purpose, we create a new classification based on the ratio of total trip expenditure to income (T/y). We report respondents’ probability of saying “yes” for high expenditure class. We observe a declining probability of saying “yes” to the WTP question with an increase in the proportion of total expenditure to income.Footnote 12 Our results are therefore robust to the classification of expenditure classes as a ratio of income.
In environmental valuation, the inequality in the reported WTP between the rich and poor can be starker. Breffle et al. (Reference Breffle, Eiswerth, Muralidharan and Thornton2015) showed that the difference in the valuation of the sum of two public goods and the sum of the valuations of two public goods separately is more likely to manifest itself for the poorer respondent. What this implies for the mental accounting framework is that if poorer people set aside a smaller proportion (smaller  $\theta_{j}$) for a mental account for the public good, then they would be disproportionately more likely to be budget-constrained. As mentioned in Champonnois and Chanel (Reference Champonnois and Chanel2023), if poorer people need to set aside a budget for subsistence consumption, then the $\theta_{j}$ assigned to the mental account for the public good can be lower for them. Thus, the mental account can lead to further over-representation of richer subjects in the valuation problem. To test the impact of income inequality in our analysis, we divide our sample population according to income quartiles. In Table 6, we report the probability of saying “yes” for high expenditure class according to the top and bottom income quartile groups (Q1 and Q4, respectively). We find that the percentage of respondents willing to pay the offered bid amount decreases as the ratio of group fees to total trip expenditure increases for both income quartiles. We do not find evidence that the lower income group may be more budget constrained than the high income group. This may due to the fact that all respondents in our study were homogeneous in their usage of the public good, namely, everyone considered the national park visit as a recreation activity.
4.4. Testing for scope differences using mental accounts
In this section, we test for prediction 2 which states that if mental accounting constraints are binding, then the respondents will exhibit scope insensitivity. Given our results from the previous section, we can only claim a scope insensitivity result for the high group.
Table 7 shows the predicted probabilities of respondents saying “yes” to the WTP questions across expenditure classes for the two split samples. We conduct the chi-square test of differences across the split sample for different expenditure classes. Our chi-square statistic is 8.65 with 6 degrees of freedom and with a p-value of 0.19. We fail to reject the null that there are no statistically significant differences across the two split samples for the different expenditure classes. This means that for the high group, the mental accounts are binding, and we observe scope insensitivity.
Percentage of “yes” respondents to the WTP question by expenditure class ( $n=1027$)

The same cannot be argued about the low group for whom the entrance fee was a small portion of their total trip expenditure. But we observe scope insensitivity for this group as well. Our chi-square statistic is 0.249 with 1 degree of freedom and a p-value of 0.62. This neither contradicts nor supports our hypothesis since our measure for mental accounting is not applicable to this subset of respondents. To shed further light on this, we explore the relationship between expenditure class and the probability of saying “yes”. We find that, for both of the sub-samples, we observe an inverted U-shape for the proportion of people saying “yes”. However, the peak of the U varies across the two sub-samples, thus making it difficult to compare the high group across them. Despite this, using our definition of high group (i.e., respondents spending more than 10 per cent of their total trip expenditure on entrance fees), we find no statistically significant difference across the two sub-samples.
We further analyzed the data for the low group to identify the characteristics of this population. We find that this group of individuals are coming from far off locations and engage in specific recreational activities distinct from other activities (i.e., they are mainly engaging in wildlife safari and wildlife photography as compared to picnicking, trekking, or bird watching). Different motivations among respondents (and their locations) could partly explain the insignificant results obtained for the low group.
5. Discussion
5.1. Extensions
Although the theoretical framework above focuses on the case where a CV survey respondent is asked a single bounded dichotomous choice valuation question, the framework and its implications naturally extend to other valuation contexts. For example, consider two different elicitation formats of payment cards and open-ended questions. Furthermore, we also consider the case of internal scope where the same subject is offered multiple levels of the same environmental good.
5.1.1. Payment cards
The analysis with payment cards is similar to that of a single dichotomous choice problem. Here, the agent is offered a sequence of bids  $k=1, 2, \dots m$ (increasing or decreasing) to which they can say “yes” or “no”. Since for each possible bid the MA agent would consider an additional constraint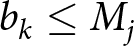 $b_{k}\leq M_{j}$ for all $k=1, 2, \dots m$, the reported WTP would be weakly lower, and a lack of scope sensitivity can also be observed.
5.1.2. Open-ended valuation questions
Consider the case of an open-ended CV question. Under this method, the subjects are asked to report their maximum WTP for the environmental good in question. Continuing with our main model, suppose that the change in utility due to the environmental good is given by
 \begin{align*}
\Delta\equiv \sum_{i\neq j} u_{i}(\hat{\mathbf{x}}_{i}) + v(\bar{x}_{j}) + \hat{x}_{-j}- \sum_{i\neq j} u_{i}(\hat{\mathbf{x}}_{i}^{\prime}) + v(x_{0}) + \hat{x}_{-j}^{\prime}.
\end{align*}
\begin{align*}
\Delta\equiv \sum_{i\neq j} u_{i}(\hat{\mathbf{x}}_{i}) + v(\bar{x}_{j}) + \hat{x}_{-j}- \sum_{i\neq j} u_{i}(\hat{\mathbf{x}}_{i}^{\prime}) + v(x_{0}) + \hat{x}_{-j}^{\prime}.
\end{align*} Then the maximum WTP for the environmental good would be  $ v(\bar{x}_{j}) - v(x_{0}) \equiv v(\bar{x}_{j}) - v(0)$. Without strategic consideration, an NC agent will report this in an open-ended question. However, for an MA agent, the maximum WTP would also depend on the residual income in the mental account. Hence the maximum WTP would be $\min\left\lbrace v(\bar{x}_{j}) - v(0), M_{j}\right\rbrace $. Thus, an MA agent would report a lower maximum WTP and can also demonstrate a lack of scope sensitivity.
5.1.3. Internal scope
Our model readily extends to quantitative internal scope.Footnote 13 Following similar logic, if two different bids ( $b_{1}$ and ${b_{2}}$) are offered to the same respondent for the larger and smaller scope respectively, where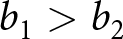 $b_{1} \gt b_{2}$, the respondent will be more likely to be constrained in their mental account for $b_{1}$, and hence would be more likely to say “no” to the WTP question. In the online appendix, we consider how the mental accounting framework affects the qualitative internal scope.Footnote 14
5.2. Need for testing mental accounts for internal validation of CV estimates
Mental accounting assumes that agents have cognitive constraints and cannot solve the neoclassical optimization problem involving all goods and time periods. Thus, the deviation from neoclassical predictions is due to the deviation from the standard decision-making process where agents behave as if money is not fungible.
In our study, similar to a rational agent, respondents’ WTP decreases with the bid amount, but the lack of scope sensitivity challenges the assumption of homo economicus. Moreover, the mental accounting constraints lead to scope insensitivity; incorporating them implicitly into the questionnaire or explicitly testing for them would generate consistent WTP values.
Note that the estimated WTP data we use for our results control for income and other socio-economically relevant variables. Thus, the result we obtain is unlikely to be due to the income effect. This is further affirmed by robustness check on our estimates. More importantly, the inverted U-shape of the probability of saying “yes” data (in both sub-samples) across expenditure classes suggests that the responses are neither random nor due to the valuation effect (people pay higher amounts if they have a higher valuation for the same recreational experience). The former would imply the proportions are random, and the latter would imply it is monotonically increasing.
5.3. Difficulty interpreting WTP data
One important finding of our study is that if respondents are subject to mental accounting constraints, then WTP conveys information about both the valuation of the environmental good and the extent of the mental accounting constraints. More specifically, such constraints put downward biases on the WTP estimates, since the discrepancy occurs when agents have high valuation of the environmental good but are constrained by their mental accounting budget.
Traditional survey methods, assuming neoclassical agents, do not explore the extent of mental accounting constraints. We argue that doing so will benefit the measurement of WTP in two ways. First, it would separate the role of valuation and the mental accounting constraints, and, second, it can possibly increase the reported estimate of WTP if agents can be made to think about a larger (less constrained) mental account.
5.4. Application for revealed preference method
This paper focuses solely on the non-market CV method but the mental accounting constraints would likely apply to the revealed preference method as well. Consider the canonical travel cost method, where the public good is valued using a weakly complementary private good. Since the two goods are consumed together, we can assume that both the public and the private good belong to the same mental account.
In the literature, it is argued that if the consumer is willing to pay a higher amount for the private good, then by complementarity, the WTP for the public good would also be higher. However, we show that this need not be the case for the MA agent. This is because there are two counter-interacting forces. A higher WTP for the private good would increase the WTP for the public good through complementarity. But if they both belong to the same mental account, a higher WTP for the private good will lead to a lower residual budget, reducing the WTP for the public good. It is a priori unclear which effect will dominate. Further empirical research is needed to investigate the relationship in more detail.
5.5. Limitation of the study
The temporal dimension is one possible variation in psychological accounts that we fail to capture here. Mental accounting theory suggests money is not temporally fungible as well. However, since the survey asked for a one-time payment as part of the entrance fee, we cannot test the temporal nature of the mental accounting model.
6. Conclusion
In this paper, we show that scope insensitivity may not necessarily imply that the preferences are inconsistent or unstable. We propose that mental accounting theory can plausibly explain the observed scope insensitivity.
According to this theory, since agents use separate and non-fungible accounts for various expenditures, they are more likely to be budget constrained than a neoclassical agent. We conjecture that the relevant psychological account is related to recreational experience and find a proxy for that in our study. We find support for our mental accounting theory in the sub-group for which this proxy is meaningful. However, keeping this explanation in mind, since we do not observe the budgeting decision of the subjects, we cannot directly test whether indeed our subjects were subjected to mental accounting constraints. More research is needed to understand this phenomenon.
Given our analysis, we hope future CV studies will generate more robust valuation. If researchers can analyze which mental account the subjects refer to when asked to pay for a bid, they can ensure that the relevant constraints are considered. Alternatively, the future researcher can evoke mental accounts experimentally and obtain a more robust WTP value.
Supplementary material
The supplementary material for this article can be found at https://doi.org/10.1017/S1355770X25100399.
Acknowledgements
We would like to acknowledge Prof. Christian Vossler for his comments on an earlier draft of the manuscript that improved the quality of this work.
Funding statement
The data used in this research was obtained under financial support from the South Asian Network for Development and Environmental Economics (SANDEE); Research Grant No. SANDEE / 2014-13.
Competing interests
The authors declare none.















 Open access

