





Introduction
Wheat (Triticum aestivum L.) is the most widely grown crop in the world, and billions of people consume it as a staple diet (Arshad et al. Reference Arshad, Abbas, Policarpo, Tonelli, Baloch, Haq, Ahmad, Zulfiqar, Djalovic, Prasad and Alshaharni2025). One of the important reasons for low wheat productivity is weed infestation, which significantly decreases yield and quality of crop (Bajwa et al. Reference Bajwa, Farooq, Al-Sadi, Nawaz, Jabran and Siddique2020a; Jabran et al. Reference Jabran, Mahmood, Melander, Bajwa and Kudsk2017). Wheat yield can be increased by 24% to 39% with effective weed control (Anderson Reference Anderson2010; Oad et al. Reference Oad, Siddiqui and Buriro2007). The presence of weeds not only increases cost of crop production for their management, but also increases competition for resources (e.g., light, water, nutrients) and infestation of pathogens and insect pests (Malik Reference Malik2009; Owen et al. Reference Owen, Martinez and Powles2015).
One of the major troublesome weeds in many winter grain crops, including wheat, is wild radish (Raphanus raphanistrum L.) (Ashworth et al. Reference Ashworth, Rocha, Baxter and Flower2024; Kebaso et al. Reference Kebaso, Frimpong, Iqbal, Bajwa, Namubiru, Ali and Chauhan2020). This weed flourishes in a variety of habitats because of its genetic and phenotypic heterogeneity (Cheam Reference Cheam2008; Zhang et al. Reference Zhang, Liu, Wang, Wang, Qiu, Zhao, Pang, Li, Wang, Song, Zhang, Yang, Sun and Li2021). Raphanus raphanistrum is a common annual broadleaf weed in the Brassicaceae family (Zhang et al. Reference Zhang, Liu, Wang, Wang, Qiu, Zhao, Pang, Li, Wang, Song, Zhang, Yang, Sun and Li2021). It is identified as one of the 180 worst agricultural weeds, causing significant issues in 65 countries and 45 distinct crop species (Kebaso et al. Reference Kebaso, Frimpong, Iqbal, Bajwa, Namubiru, Ali and Chauhan2020). Even though R. raphanistrum is native to the Mediterranean regions, it has spread and become a common weed in South Africa, Australia, the United Kingdom, Kenya, the United States, and Canada (Bajpai et al. Reference Bajpai, Harel, Ziffer-Berger, Waitz, Mummenhoff and Barazani2025; Kebaso et al. Reference Kebaso, Frimpong, Iqbal, Bajwa, Namubiru, Ali and Chauhan2020). Raphanus raphanistrum plants that emerge late in the season have the ability to produce enough seeds to lead to further invasions (Somerville and Ashworth Reference Somerville and Ashworth2024). It has developed resistance to many herbicides with different modes of action, thus making it difficult to manage (Broster et al. Reference Broster, Boutsalis, Gill and Preston2025; Heap Reference Heap2025; Walsh et al. Reference Walsh, Powles, Beard, Parkin and Porter2004). Wheat grain yield, number of grains, aboveground dry matter, and leaf area index have all been reported to decrease due to R. raphanistrum competition (Eslami et al. Reference Eslami, Gill, Bellotti and McDonald2006; Walsh Reference Walsh2019).
While chemical control is the most effective way to control weeds, herbicide options are limited and expensive in developing countries such as Pakistan (Bajwa Reference Bajwa2014). In addition, rising levels of herbicide-resistance evolution warrant the use of alternative, cultural weed control methods. Agronomic practices such as planting density, row spacing, and planting geometry influence weed growth and competition and can therefore be manipulated to suppress weeds through improved crop competition (Bajwa et al. Reference Bajwa, Mahajan and Chauhan2015, Reference Bajwa, Walsh and Chauhan2017). Farmers are often unaware of the proper row to row and plant to plant spacing to minimize weed growth and optimize plant populations for higher crop yields (Kolb et al. Reference Kolb, Gallandt and Mallory2012).
Research on crop competition with R. raphanistrum revealed that factors such as emergence time, the method of sowing the crop, the length of the competition, and weed density would ultimately have an impact on yield loss and the intensity of the competition (Vercellino et al. Reference Vercellino, Pandolfo, Cantamutto and Presotto2021). Increasing wheat crop density decreased the leaf area index and dry matter of R. raphanistrum (Eslami et al. Reference Eslami, Gill, Bellotti and McDonald2006). Under low wheat density, R. raphanistrum had significant competitive advantage against wheat, not only in resource capture but also in producing a large number of seeds (Cechin et al. Reference Cechin, Vargas, Agostinetto, Lamego, Mariani and Dal Magro2017; Eslami et al. Reference Eslami, Gill, Bellotti and McDonald2006). Increasing wheat seeding rates from 60 kg ha−1 to 180 kg ha−1 had a suppressive effect on the development and spread of R. raphanistrum (Walsh and Minkey Reference Walsh and Minkey2006). Although sowing geometries have been used for effective weed control in wheat, their potential to improve R. raphanistrum suppression and boost wheat productivity remains underexplored under field conditions in irrigated cropping systems of Pakistan. This knowledge gap is critical, considering the significant yield losses in wheat caused by R. raphanistrum weed competition.
The present study evaluated varying plant spacing and sowing geometries of wheat to determine their effects on R. raphanistrum suppression, wheat growth, and yield performance under field conditions in Pakistan. Specifically, the objectives were to: (1) identify the most effective row spacings (e.g., narrow vs. wide) and sowing geometry (e.g., lines, ridges, beds, or cross) for optimum yield and yield-related components of wheat; and (2) quantify the effect of varying row spacing and sowing geometries on the density and dry biomass of R. raphanistrum. It was hypothesized that narrow spacing in lines would be more effective in suppressing R. raphanistrum and enhancing wheat yield compared with the wide row spacing lines or sowing in ridges, beds, or cross sowing. The results of this research will help in development of efficient weed management strategies that improve the overall productivity of wheat.
Materials and Methods
Study Area Description
A field experiment was conducted at the Agronomic Farm, Department of Agronomy, University of Agriculture, Faisalabad, Pakistan, during the winter period of 2022 and was repeated in 2023 (31.4504°N, 73.1350°E; altitude: 186.4 m). Climatic conditions varied between the two experimental years. Total rainfall was 240 mm in the 2022 growing season, which was supplemented with an additional 140 mm applied as irrigation for optimal crop growth. In 2023, the growing season rainfall was 210 mm, and an additional 145 mm was applied as irrigation based on the crop growth requirements. Minimum temperatures were 11.2 and 13.0 C, while maximum temperatures were 25.0 and 27.0 C for 2022 and 2023, respectively. The soil at the experimental site was sandy loam; however, year-wise variations in soil properties were observed and are reported accordingly. Soil pH was 7.7 and 7.5, total nitrogen content was 0.13% and 0.16%, and organic matter content was 0.89% and 0.95%, respectively, for 2022 and 2023.
Experimental Design and Treatments
The experiment was laid out in a randomized complete block design with three replicated blocks. A total of 21 experimental plots, each 5-m long by 2.25-m wide, were used to implement seven treatments. Wheat variety (‘Faisalabad 2008’ obtained from Directorate of Farm, University of Agriculture, Faisalabad) was sown at a seed rate of 125 kg ha−1. The row spacing and sowing geometry treatments included: T1: 11-cm line sowing, T2: 22-cm line sowing, T3: 33-cm line sowing, T4: broadcast sowing, T5: ridge sowing (30 cm), T6: bed sowing (60 cm), T7: cross sowing (22 cm). Based on the fixed plot width (2.25 m), the number of rows varied with row spacing, resulting in 20, 10, and 7 rows per plot for 11-cm, 22-cm, and 33-cm spacings, respectively. In ridge sowing (30 cm), there were 8 ridges (rows) per plot and bed sowing (60 cm) had 4 beds per plot, with 2 rows planted per bed, while cross sowing (22 cm) contained two perpendicular direction grids (22 cm by 22 cm) resulting in 10 rows in each direction. Broadcast sowing did not follow a specific row arrangement, and seeds were uniformly distributed across the plot area. Buffer zones were maintained between plots to minimize edge effects and ensure that light interception and other environmental factors were comparable across all treatments, allowing accurate evaluation of the influence of different sowing geometries on wheat growth and yield.
In all the treatments, sowing was done using a single-row hand drill with specific spacing and geometries. The land was prepared and leveled using a cultivator to create a well-pulverized seedbed. The crop was irrigated before planting (Z00–Z09), at the tillering stage (Z21–Z29), and at the booting stage (Z41–Z49) to avoid water stress. The crop experienced rainfall during the grain-filling stage (Z71–Z79) during both years. Each experimental unit received the recommended fertilizer dosage of 111, 76, and 66 kg ha−1 of N, P, and K, respectively. Phosphorus was applied as a single dose at the time of sowing. Nitrogen was applied in the form of granular urea (46% N) using the broadcast method in three equal doses: one-third at sowing (basal application), one-third at the tillering stage, and the remaining one-third at the booting stage, coinciding with the second and third irrigations to enhance nitrogen use efficiency and crop uptake.
Weed Flora and Infestation Patterns
In both years, a total of 12 weed species were identified throughout the crop growth phase. These species included two sedges, three grasses, and seven broadleaf weeds. In 2022, broadleaf weeds, including R. raphanistrum, showed high infestation levels ranging from 60% to 90%. R. raphanistrum was the most dominant species, while other broadleaf species such as field bindweed (Convolvulus arvensis L.), lesser swinecress [Coronopus didymus (L.) Sm.], toothed dock (Rumex dentatus L.), California burclover (Medicago polymorpha L.), and little mallow (Malva parviflora L.) were also present. Among grasses, wild oat (Avena fatua L.) and littleseed canarygrass (Phalaris minor Retz.) showed moderate infestation, while poison ryegrass (Lolium temulentum L.) had low infestation levels (1% to 29%). In 2023, the infestation patterns were similar for R. raphanistrum, but lower infestations of C. didymus and R. dentatus were recorded, while L. temulentum was not noticeable. Because natural infestation of R. raphanistrum was the most dominant in the selected field, it aligned well with the study objectives and requirements. No chemical weed control was implemented across the experiment to evaluate the true effect of experimental treatments on weed suppression.
Yield Data Collection
Data were collected for several growth, yield, and related parameters of wheat, including plant height (cm), number of productive tillers (m−2), number of spikelets per spike, number of grains per spike, spike length (cm), 1,000-grain weight (g), grain yield (Mg ha−1), biological yield (Mg ha−1) and harvest index (%) following well-established, standard procedures (Bajwa et al. Reference Bajwa, Nawaz and Farooq2020b). The harvesting was carried out manually at physiological maturity using a hand sickle. The wheat was wrapped in bundles and left out in the sun for 2 d to dry. Wheat was threshed using an electrical small thresher.
Assessment of Raphanus raphanistrum
In the present study, weed density and biomass data were collected using a 0.5 m by 0.5 m quadrat (0.25 m2) placed randomly at three locations within each plot at 15, 30, and 45 d after sowing (DAS). For data reporting, the counts and biomass were scaled to 1 m2 for standardization and comparison purposes. Weed samples were removed by cutting at ground level, while the wheat crop within the quadrat was left intact. These sampling locations were avoided during subsequent harvests to prevent interference with crop yield measurements. Dry biomass was recorded at each sampling interval after samples had been oven-dried at 70 C for 72 h. The final values were expressed as grams per square meter (g m−2). This approach ensured accurate assessment of weed pressure without affecting the overall crop performance in the net plot area (5 m by 2.25 m).
Statistical Analysis
The data on all dependent response variables were subjected to statistical analyses using Statistix 8.1 software and Origin Pro 2025. Statistical significance among treatments was assessed through ANOVA and the LSD test was used to compare the treatment means at 5% probability level (P < 0.05). Data are presented separately for two years for variables where the interaction between years and treatments was significant (P < 0.05). For variables where the interaction between years and treatments was nonsignificant (P > 0.05), the data for both years were pooled. Correlation analysis was performed using Pearson’s correlation coefficient to quantify the relationships among weed attributes and wheat growth and yield parameters based on pooled data across years. Principal component analysis (PCA) was conducted to explore multivariate relationships and to visualize the contribution of measured variables and treatment differentiation using the first two principal components.
Results and Discussion
Effect of Study Year
A significant interaction (P < 0.05) was observed between years and treatments for density and biomass of R. raphanistrum at all intervals. Therefore, data are presented separately for both years. On the other hand, the interaction between years and treatments was nonsignificant (P > 0.05) for crop plant height, yield, and yield-related variables. Therefore, data were pooled for the 2 yr for these variables. The greater variability in weed response between 2022 and 2023 is likely due to differences in seasonal conditions affecting weed emergence and early growth dynamics. Slightly warmer temperatures and improved soil fertility in 2023 (higher nitrogen and organic matter) may have enhanced crop establishment and early canopy development, leading to stronger suppression of R. raphanistrum compared with 2022. In contrast, wheat, as a well-adapted and managed crop with controlled inputs (e.g., irrigation and fertilization), exhibited buffered growth and yield responses across years, minimizing interannual variability. This differential sensitivity is consistent with previous studies showing that weed populations are more responsive to environmental fluctuations than crops, particularly during early establishment stages when small differences in temperature, moisture, and nutrient availability can significantly alter weed emergence patterns and competitive outcomes (Bajwa et al. Reference Bajwa, Walsh and Chauhan2017; Lemerle et al. Reference Lemerle, Verbeek and Coombes1995). Consequently, weed data required year-wise presentation, whereas crop data could be validly pooled across years.
Effect of Sowing Geometry on Density and Dry Biomass of Raphanus raphanistrum
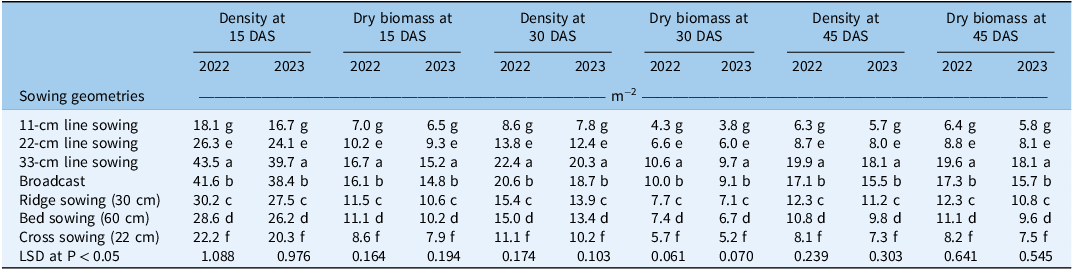
The sowing geometries had significant effect on R. raphanistrum density and dry biomass across all study intervals, that is, 15, 30, and 45 DAS (Table 1). The narrow row spacing (11 cm line sowing) significantly reduced R. raphanistrum density and dry biomass at critical early growth stages (15 to 45 DAS) in both years compared with wider spacing and other planting geometries. This suggests that narrower geometries increased canopy closure and improved crop competitiveness, which reduced resource availability for R. raphanistrum. These results are consistent with those of Walsh and Minkey (Reference Walsh and Minkey2006), who reported suppressive effects of narrow row spacing on weed biomass and yield loss. Other studies have reported that higher crop density suppressed weed emergence (Borger et al. Reference Borger, Hashem and Pathan2010). These results are also in line with those of Fahad et al. (Reference Fahad, Hussain, Chauhan, Saud, Wu, Hassan, Tanveer, Jan and Huang2015) and Kebaso et al. (Reference Kebaso, Frimpong, Iqbal, Bajwa, Namubiru, Ali and Chauhan2020), who reported that narrower row spacing (<76 cm) suppressed R. raphanistrum density by around 34%, biomass by 55%, and seed production by nearly 45%. The predominance of R. raphanistrum over other broadleaf and grass weeds in our study highlights its adaptive advantage, resilience, and persistence.
Effect of different sowing geometries on Raphanus raphanistrum density and dry biomass at 15, 30, and 45 d after sowing (DAS) during 2022 and 2023 in Faisalabad, Pakistan. a

Table 1. Long description
The table presents data on the effect of different sowing geometries on Raphanus raphanistrum density and dry biomass at 15, 30, and 45 days after sowing (DAS) during 2022 and 2023. The table has 10 rows and 12 columns. The columns are labeled as Sowing geometries, Density at 15 DAS, Dry biomass at 15 DAS, Density at 30 DAS, Dry biomass at 30 DAS, Density at 45 DAS, and Dry biomass at 45 DAS. Each of these columns is further divided into two sub-columns for the years 2022 and 2023. The sowing geometries include 11-centimeter line sowing, 22-centimeter line sowing, 33-centimeter line sowing, broadcast, ridge sowing, bed sowing, and cross sowing. The table shows that narrow row spacing significantly reduced Raphanus raphanistrum density and dry biomass at critical early growth stages in both years compared with wider spacing and other planting geometries. This suggests that narrower geometries increased canopy closure and improved crop competitiveness, reducing resource availability for Raphanus raphanistrum. The data indicates that 11-centimeter line sowing had the lowest density and dry biomass across all intervals, while broadcast sowing had the highest. The least significant difference (LSD) at P is less than 0.05 is also provided for each measurement.
a Means sharing the same letter in a column do not differ significantly according to the LSD test at P < 0.05. The data for the 2 yr (2022 and 2023) are analyzed and presented separately, as the treatment × year interaction was significant (P < 0.001).
Our results clearly show that wider spacings allowed more light and soil resources for the weed plants, which promoted their growth and increased competition with wheat. Incremental increases in R. raphanistrum densities and biomass production along the increasing line spacing demonstrate a strong correlation between weed growth and open space available. Similarly, the intermediate effect on weed density and biomass observed in broadcast or ridge sowing (Table 1) could be attributed to reduced space available to weed plants and higher crop competition, as thoroughly reviewed by Bajwa et al. (Reference Bajwa, Walsh and Chauhan2017). Our results validate the need for optimum sowing geometries that have optimum plant densities for equal distribution of resources (Olsen et al. Reference Olsen, Griepentrog, Nielsen and Weiner2012; Walsh Reference Walsh2019). Reduced row spacing gave the crop a competitive advantage by forming a higher crop population and a denser crop canopy, which shaded out the weeds (Lemerle et al. Reference Lemerle, Cousens, Gill, Peltzer, Moerkerk, Murphy, Collins and Cullis2004). These findings are in line with the previous studies showing that higher seed rates create more crop competitiveness against R. raphanistrum, resulting in reduced growth and reproduction of the weed (Jha et al. Reference Jha, Kumar, Godara and Chauhan2017; Mason et al. Reference Mason, Navabi, Frick, O’Donovan and Spaner2007).
While not measured in the current study, narrow row spacing or planting geometries promoting more crop competition could also result in better light interception for crop plants while depriving weed plants that often grow interrow. The suppression of R. raphanistrum in our study potentially enhanced the interception of photosynthetically active radiation by the wheat canopy. Additionally, higher crop density per unit area enhanced leaf area development and canopy expansion, which limit soil exposure for emergent of R. raphanistrum seedlings. Therefore, by adopting an 11-cm sowing geometry in wheat, farmers can control R. raphanistrum and implement a cultural weed control management strategy that minimizes reliance on herbicides.
Effect of Sowing Geometry on Growth and Yield Components of Wheat
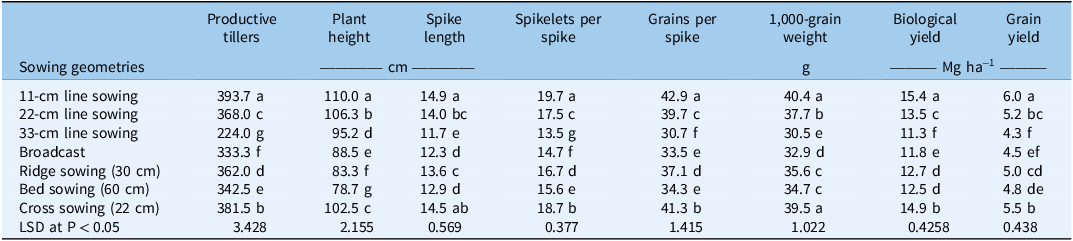
Crop growth, yield components and final grain yield were significantly influenced by sowing geometry, with consistent trends across both years allowing pooled analysis (Table 2). Narrower row spacing (11 cm) produced the highest values for most parameters, including productive tillers (393.7 m−2), plant height (110.0 cm), spike length (14.9 cm), spikelets per spike (19.7), grains per spike (42.9), 1,000-grain weight (40.4 g), biological yield (15.4 Mg ha−1), and grain yield (6.0 Mg ha−1) (Table 2). Cross sowing (22 cm) performed comparably, recording slightly lower but statistically similar values for several traits, with grain yield reaching 5.5 Mg ha−1. In contrast, wider row spacing (33 cm) consistently resulted in the lowest performance, with reductions of approximately 40% to 45% in productive tillers and 25% to 30% in grain yield compared with 11-cm spacing (Table 2). Broadcast sowing and other intermediate geometries (ridge and bed sowing) showed moderate performance, with grain yields ranging from 4.5 to 5.0 Mg ha−1.
Effect of different sowing geometries on various crop growth and yield-related parameters of wheat in Faisalabad, Pakistan.

Table 2. Long description
The table presents data on the impact of various sowing geometries on wheat crop growth and yield-related parameters in Faisalabad, Pakistan. It includes measurements for productive tillers, plant height, spike length, spikelets per spike, grains per spike, 1,000-grain weight, biological yield, and grain yield. The table has eight rows and nine columns, with each row representing a different sowing geometry, such as 11-centimeter line sowing, 22-centimeter line sowing, 33-centimeter line sowing, broadcast sowing, ridge sowing, bed sowing, and cross sowing. The columns are labeled with the parameters being measured. Notable trends include the highest values for most parameters observed with 11-centimeter line sowing, while 33-centimeter line sowing consistently shows the lowest performance. Cross sowing performs comparably to 11-centimeter line sowing but with slightly lower values. The data highlights significant differences in crop growth and yield based on sowing geometry.
Means sharing the same letter in a column do not differ significantly according to the LSD test at P < 0.05. The data for the 2 yr (2022 and 2023) were pooled, as the treatment × year interaction was nonsignificant for these parameters (P > 0.05).
Productive tillers are a good indication of yield potential in cereal crops, especially wheat. The higher number of productive tillers in narrow rows in our study are similar to the findings of Busi and Powles (Reference Busi and Powles2017) and Owen and Powles (Reference Owen and Powles2018), who stated that reduced row spacing resulted in an increased number of productive tillers by providing minimal space for weed growth. A higher number of productive tillers was directly linked to the higher final yield (Abbas et al. Reference Abbas, Saleem, Maqsood, Mujahid, Mahmood-ul-Hassan and Saleem2009; Marwat Reference Marwat2002). Wider rows allowed plants to have flexible lateral growth, while narrow rows encouraged taller plants to intercept light efficiently. Broadcast and bed sowing resulted in shorter plants, indicating poor vegetative growth under these sowing geometries (Table 2). This pattern indicates that closer row spacing, as in line sowing, may reduce competition for resources such as water, light, and nutrients, allowing plants to achieve greater height. Eslami et al. (Reference Eslami, Gill, Bellotti and McDonald2006) also reported that plant height is substantially affected by sowing geometry, supporting our results that row spacing plays an important role in plant vegetative growth. In addition, taller plants under closer line spacing likely intercepted more light, which can also contribute to weed suppression through shading and limited resource availability (Devi et al. Reference Devi, Hooda, Singh and Kumar2017; Parajuli and Dhital Reference Parajuli and Dhital2023).
The effect of planting geometry on vegetative growth also translated into reproductive attributes such as spike length, number of spikelets per spike, and grains per spike. These attributes are important components of the final crop yield. The results indicate that narrow row spacing provided favorable growth conditions, which enhanced spike formation and reproductive potential compared with wider sowing patterns and other geometries. Spike length is a crucial trait for yield, as it is directly related to the number of grains per spike and has a significant impact on determining the final grain yield (Abbas et al. Reference Abbas, Saleem, Maqsood, Mujahid, Mahmood-ul-Hassan and Saleem2009). Eslami et al. (Reference Eslami, Gill, Bellotti and McDonald2006) reported that using an appropriate sowing geometry led to the maximum spike length. Walsh (Reference Walsh2019) reported that yield-related parameters such as number of spikelets per spike respond significantly to various sowing geometries and weed−crop competition.
The number of grains per spike is another crucial factor determining the yield of wheat crops, as higher numbers of grains per spike are directly related to increased crop yield. Previous studies have reported that sowing geometry can significantly affect grains per spike and eventually crop yield (Marwat et al. Reference Marwat, Khan, Hashim, Nawab and Khattak2011). Fahad et al. (Reference Fahad, Hussain, Chauhan, Saud, Wu, Hassan, Tanveer, Jan and Huang2015) demonstrated that narrow rows suppressed R. raphanistrum and maximized grains per spike, while Owen and Powles (Reference Owen and Powles2018) reported that increased weed competition can decrease number of grains per spike. Additionally, the higher 1,000-grain weight was potentially achieved through improved photosynthetic efficiency and nutrient uptake (Hozayn et al. Reference Hozayn, El-Shahawy and Sharara2012). Overall, these findings indicate that sowing geometry promoting crop competition not only improves reproductive traits but also contributes to higher yield and better weed management.
Effect of Sowing Geometries on Biological and Grain Yield of Wheat
Biological yield, which is the total dry matter accumulation of both grain and straw yield, is a crucial trait for the farming communities in Pakistan, as they require grain for food and income and straw for animal feed. In this study, 11-cm line sowing produced the highest biological yield (15.4 Mg ha−1) followed by cross sowing at 22 cm (14.9 Mg ha−1), demonstrating the consistent positive effect of narrow rows or high planting densities on crop growth and yield (Table 2). It is an indicator of photosynthetic efficiency, where the vegetative growth of the crop can be represented by the trend of biological yield (Abbas et al. Reference Abbas, Saleem, Maqsood, Mujahid, Mahmood-ul-Hassan and Saleem2009; Marwat Reference Marwat2002). The number of productive tillers directly influences the biological yield, with a greater number of tillers leading to a higher yield and increased profitability for farmers. Consequently, an increase in biological yield results in an increase in both grain and straw yield, and this relationship has been established in previous studies. The higher biological yield in narrower geometries was due to greater plant population density and lower R. raphanistrum interference, which improved resource-use efficiency and biomass accumulation, whereas wider spacing increased R. raphanistrum interference and competition with wheat plants.
The grain yield is a result of various yield-contributing traits such as productive tillers, spikelets per spike, grains per spike, and grain weight. Improving these traits can enhance grain yield. Our results show that 11-cm line sowing produced the highest grain yield (6.0 Mg ha−1) due to superior crop growth and lower weed competition (Table 2). Wider spacing negatively affected grain production due to enhanced competition from R. raphanistrum. Broadcast and bed-sowing geometries also showed lower grain yield compared with narrow line spacing, most likely due to poor crop establishment and enhanced intraspecific competition. However, this study did not record the crop establishment, which is a limitation.
While some previous studies have reported significant effect of row spacing on harvest index, which is the ratio of grain yield to biological yield (Busi and Powles Reference Busi and Powles2017), we did not observe significant differences across treatments (data not presented). It is important to note that throughout the crop growing season, about 60% yield can be lost due to weed competition, which often translates into variation in harvest index (Owen and Powles Reference Owen and Powles2018). However, this was not the case in our study, mainly because both grain yield and biological yield responded proportionally to changes in planting geometry. Treatments that produced higher biomass (e.g., 11 cm and cross sowing) also produced higher grain yield, while treatments with lower biomass (e.g., 33-cm spacing) had correspondingly lower grain yield. Because both components changed in the same direction and magnitude, their ratio (harvest index) remained relatively stable across treatments. Such stability in the harvest index is typical in wheat under well-managed conditions, where assimilate partitioning is under strong physiological and genetic control, and grain yield and biomass tend to increase proportionally, resulting in relatively stable harvest index values across environments and management practices (Chen et al. Reference Chen, Wutanbieke, Zhong, Chen, Huo and Dong2025).
Correlation Among Various Study Variables
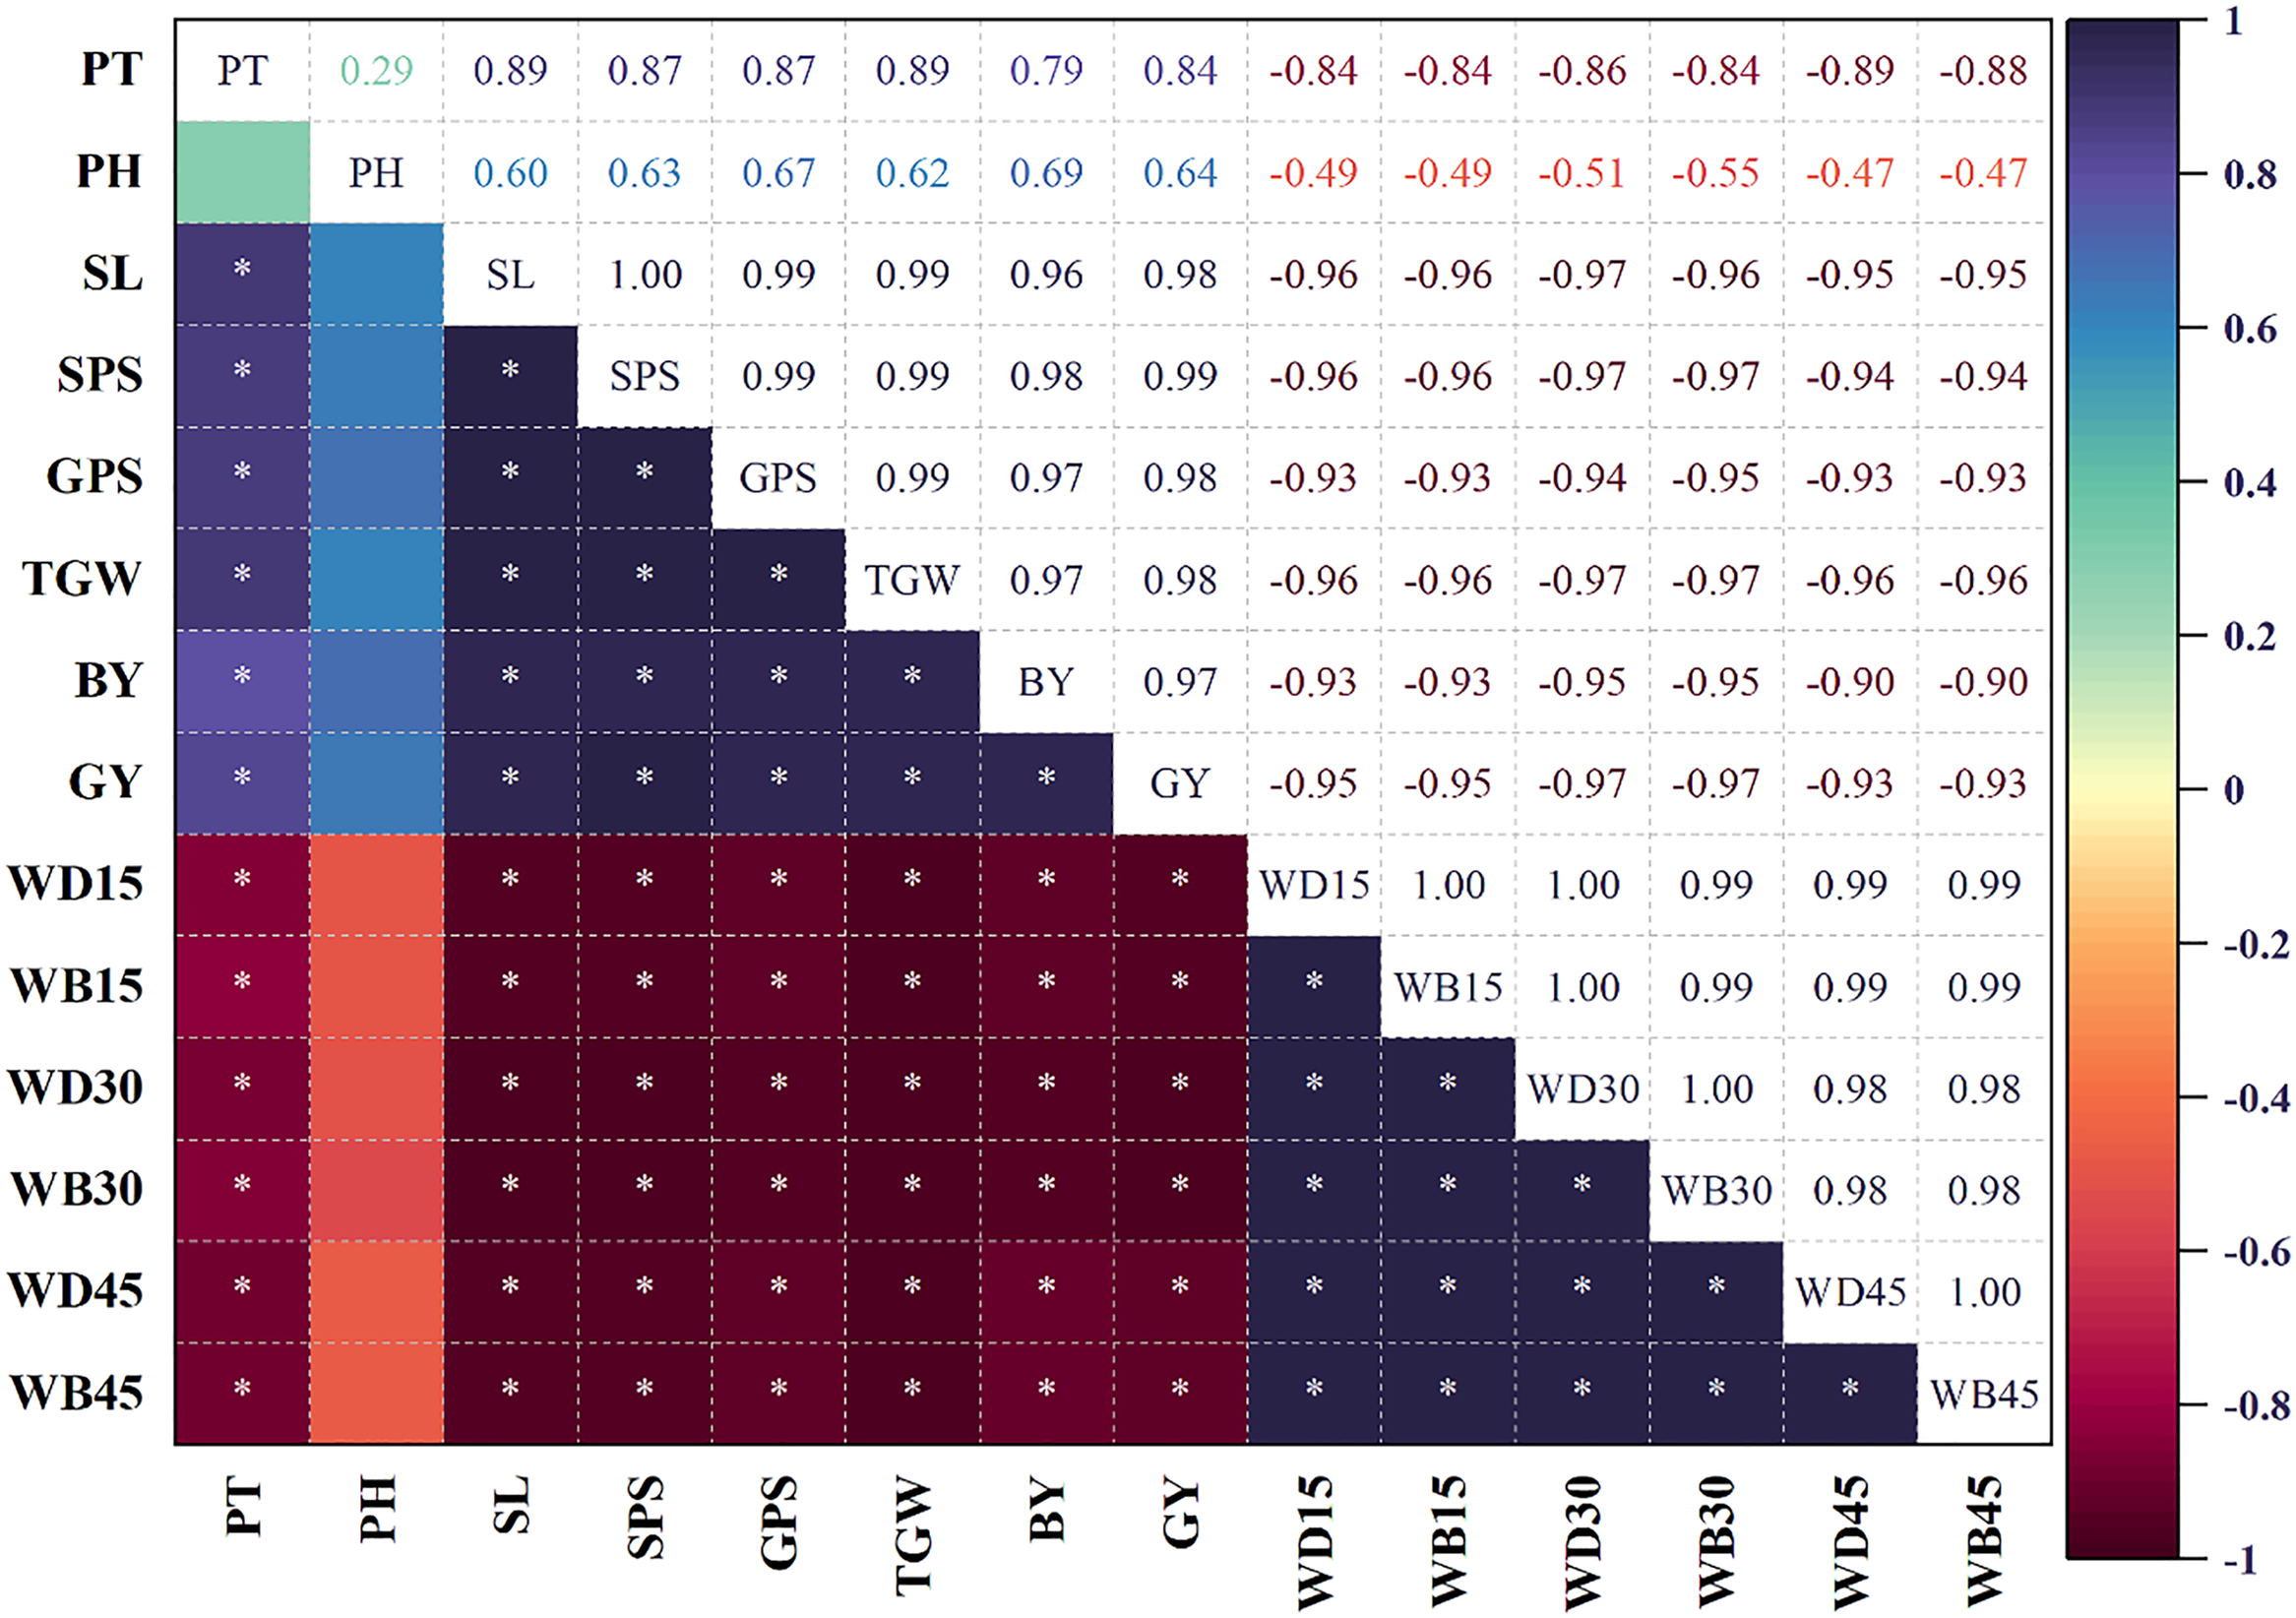
The correlation analysis of pooled data (2022 and 2023) revealed a strong and consistent antagonistic relationship between R. raphanistrum interference and wheat productivity (Figure 1). Weed attributes, particularly late-stage weed biomass (WB-45) and density (WD-45), were negatively correlated with key crop traits, including grain yield, biological yield, productive tillers, and grains per spike. This indicates that prolonged weed competition substantially reduced crop performance. In contrast, strong positive correlations among crop growth and yield components highlight their synergistic contribution to yield formation (Figure 1).
Pearson correlation of weed attributes and wheat growth and yield parameters under different sowing geometries to control Raphanus raphanistrum in Faisalabad, Pakistan. Productive tillers (PT), spikelets per spike (SPS), biological yield (BY), plant height (PH), grain per spike (GPS), grain yield (GY), spike length (SL), 1,000-grain weight (TGW) of wheat; and R. raphanistrum density at 15 d after sowing (DAS) (WD15), 30 DAS (WD30), 45 DAS (WD45), weed dry biomass (g m−2) at 15 DAS (WB15), 30 DAS (WB30), 45 DAS (WB45). T1 (11-cm line sowing), T2 (22-cm line sowing), T3 (33-cm line sowing), T4 (broadcast), T5 (ridge sowing, 30 cm), T6 (bed sowing, 60 cm), and T7 (cross sowing, 22 cm).

Figure 1. Long description
A heat map displays the Pearson correlation coefficients between various weed attributes and wheat growth and yield parameters. The map uses a color gradient from dark blue to dark red to indicate the strength and direction of correlations, with values ranging from negative one to one. The axes are labeled with different parameters, including productive tillers, spikelets per spike, biological yield, plant height, grain per spike, grain yield, spike length, and thousand-grain weight of wheat, as well as weed density and dry biomass at different days after sowing. Dark blue indicates strong positive correlations, while dark red indicates strong negative correlations. Notable correlations include strong positive relationships among wheat growth parameters and strong negative correlations between wheat parameters and weed attributes.
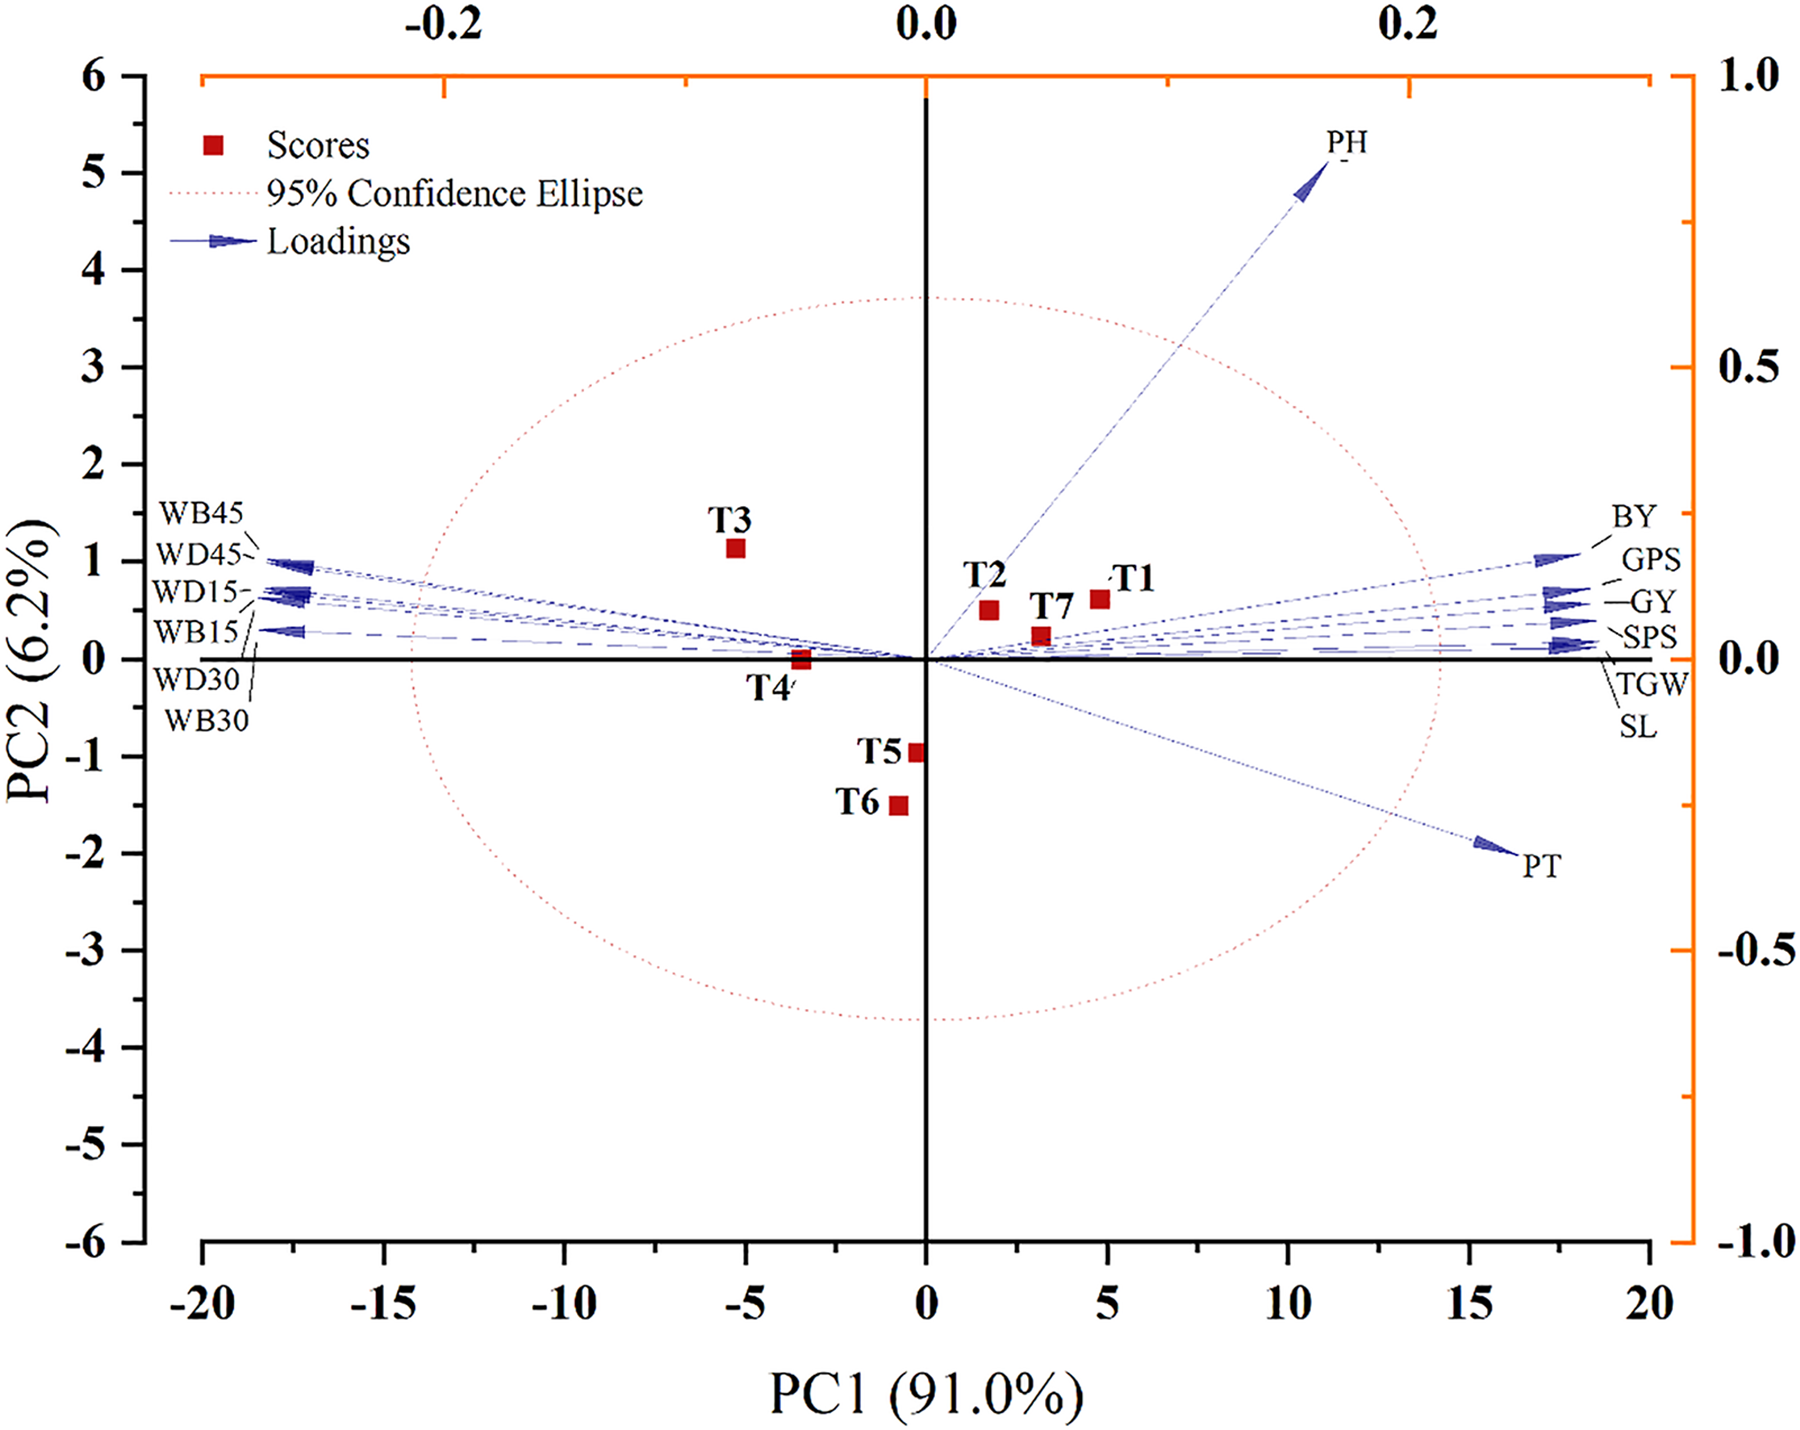
These relationships were further supported by PCA, where the first two components explained 97.2% of the total variance, clearly separating crop productivity traits from weed-related variables along PC1 (Figure 2). Treatments associated with narrow and more uniform crop spacing, particularly 11-cm line sowing and cross sowing, were positioned in the quadrant with higher yield and growth attributes, confirming their superior performance (Figure 2). On the other hand, wider spacing treatments such as 33-cm line sowing (T3) were aligned with weed-related variables. Similar negative associations between weed pressure and wheat yield and strong positive linkages among yield components have been widely reported in studies focused on wheat, particularly where late-season weed biomass exerts the greatest competitive impact on crop productivity (Arshad et al. Reference Arshad, Abbas, Policarpo, Tonelli, Baloch, Haq, Ahmad, Zulfiqar, Djalovic, Prasad and Alshaharni2025).
Principal component analysis (PCA) of weed attributes and wheat growth and yield parameters under different sowing geometries to control Raphanus raphanistrum during 2022 and 2023 in Faisalabad, Pakistan. Productive tillers (PT), spikelets per spike (SPS), biological yield (BY), plant height (PH), grain per spike (GPS), grain yield (GY), spike length (SL), 1,000-grain weight (TGW) of wheat; and R. raphanistrum density at 15 d after sowing (DAS) (WD-15), 30 DAS (WD-30), 45 DAS (WD-45), weed dry biomass (g m−2) at 15 DAS (WB-15), 30 DAS (WB-30), 45 DAS (WB-45). T1 (11-cm line sowing), T2 (22-cm line sowing), T3 (33-cm line sowing), T4 (broadcast), T5 (ridge sowing, 30 cm), T6 (bed sowing, 60 cm), T7 (cross sowing, 22 cm).

Figure 2. Long description
A scatter plot showing principal component analysis of wheat growth and yield parameters under different sowing geometries to control Raphanus raphanistrum. The plot includes data points for productive tillers, spikelets per spike, biological yield, plant height, grain per spike, grain yield, spike length, and 1,000-grain weight of wheat, as well as Raphanus raphanistrum density and weed dry biomass at different days after sowing. The x-axis represents the first principal component (PC1) with 91 percentage variance, and the y-axis represents the second principal component (PC2) with 6.2 percentage variance. The plot features red squares for scores, blue arrows for loadings, and a dotted line for the 95 percentage confidence ellipse. Several clusters and patterns are visible, with specific treatments (T1 to T7) labeled and distinct loadings for various parameters. All values are approximated.
The superior performance under narrow spacing and cross sowing can be attributed to higher plant density and more uniform spatial distribution, leading to improved canopy closure, enhanced light interception, and greater resource-use efficiency. These results clearly demonstrate that while wider spacing may reduce intra-specific competition, it substantially compromises overall crop productivity, likely due to reduced plant population and poorer canopy development.
The present study clearly demonstrated that sowing geometry significantly influences R. raphanistrum suppression as well as wheat growth, yield components, and grain yield. Narrow and more uniform crop arrangements, particularly 11-cm line sowing and cross sowing (22 cm), consistently reduced R. raphanistrum density and biomass while maximizing crop productivity. In contrast, wider row spacing (33 cm) increased weed pressure and resulted in substantial reductions in growth and yield parameters. The superior performance of narrow spacing can be attributed to improved crop competitiveness through rapid canopy closure, greater light interception, and more efficient utilization of available resources, which collectively suppressed weed establishment and growth. Importantly, correlation and multivariate analyses further confirmed that late-season weed biomass was strongly associated with yield reductions, highlighting the critical importance of sustained weed suppression throughout the crop growth cycle. Based on these findings, narrow row spacing (particularly 11-cm line sowing) can be recommended as a practical, nonchemical, and environmentally sustainable strategy for managing R. raphanistrum in wheat production systems.
The effectiveness of sowing geometry is influenced by environmental and edaphic factors, including soil fertility, moisture availability, and seasonal conditions, which can modulate crop–weed competition dynamics. Therefore, optimization of sowing geometry should be considered in conjunction with site-specific management practices. Long-term studies are required to assess the stability and sustainability of these approaches across diverse environments and cropping systems, particularly in relation to weed population dynamics and soil health. Further research is also needed to better understand the underlying mechanisms of crop–weed interactions, including resource competition and temporal dynamics of weed emergence, to refine integrated weed management strategies. Additionally, incorporating economic analyses will be essential to evaluate the cost-effectiveness and practical adoption of different sowing geometries, thereby enabling growers to make informed and sustainable management decisions.
Acknowledgments
The authors are grateful to their institutes for their continuing support.
Funding statement
This research did not receive funding from any specific research grant.
Competing interests
All authors declare that they have no competing interests related to this research and its publication.

 Open access

