

Introduction
The ability of wildlife officials to appropriately manage a given species or population depends on the quality of data available. Wildlife officials require accurate information to set harvest quotas, establish protected areas and propose management regulations (Margules & Pressey, Reference Margules and Pressey2000), and many rely on the IUCN Red List (IUCN, 2015) for this information. However, many species have yet to be assessed or have been categorized as Data Deficient until more information becomes available. Broad geographical sampling is needed to determine a species' conservation status accurately, particularly for potentially cryptic species (undescribed, similar species). This is especially important when assessing the status of species inhabiting large geographical ranges and multiple habitat types. Without systematic analysis, cryptic species are harvested and traded under the name of closely related common species, which could lead to the extinction of undescribed species. Brown et al. (Reference Brown, Brenneman, Koepfli, Pollinger, Milá and Georgiadis2007) described an example of population declines in cryptic giraffe lineages hidden under a common species name with a lower risk status. Lohman et al. (Reference Lohman, Ingram, Prawiradilaga, Winker, Sheldon and Moyle2010) described a similar scenario for cryptic, island bird lineages in the Philippines, and other examples are provided in Bernardo (Reference Bernardo, Hodkinson, Jones, Waldren and Parnell2011). Despite this major conservation concern, status assessments are sometimes made in geologically complex regions where little is known about the extent of biological diversity.
Loss of cryptic species may be acute in countries such as Indonesia, where an absence of data across many islands or mountains makes accurate Red List assessment difficult to accomplish. The Pacific Ring of Fire includes much of Indonesia and the unique geology has facilitated the evolution of widespread species diversity. Indonesia also encompasses many major biogeographical breaks, including Huxley's Line, Lydekker's Line, Wallace's Line and Weber's Line. In turn, taxonomic relationships are difficult to resolve across the region. Further complicating the issue, anthropogenic pressures are causing a rapid decline in diversity. Agricultural practices across the Greater Sunda Islands (Borneo, Java and Sumatra) have resulted in one of the world's highest rates of deforestation (Sodhi et al., Reference Sodhi, Koh, Brook and Ng2004), with forests being converted into oil palm, rubber, tea and coffee plantations (Myers et al., Reference Myers, Mittermeier, Mittermeier, da Fonseca and Kent2000; Miettinen et al., Reference Miettinen, Stibig and Achard2014). These practices, in combination with a lack of wildlife management resources and personnel, have led to unregulated overharvesting of resources. The islands of Java and Sumatra are of particular concern, and it is estimated that only 6% of the original forest remains on Java, and 35% on Sumatra (Brooks et al., Reference Brooks, Pimm and Collar1997; Achard et al., Reference Achard, Eva, Stibig, Mayaux, Gallego, Richards and Malingreau2002; Margono et al., Reference Margono, Turubanova, Zhuravleva, Potapov, Tyukavina and Baccini2012).
The Greater Sunda Region (or Sundaland) encompasses much of West Indonesia and is considered to be a biodiversity hotspot (CEPF, 2004). The islands of the region are home to a variety of endemic and threatened species (Shepherd et al., Reference Shepherd, Sukumaran and Wich2004) but many vertebrate groups remain poorly studied, particularly reptiles. Few herpetofaunal surveys have been conducted throughout the Greater Sunda Region in recent times and the extent of reptilian diversity in Java and Sumatra is unknown (Iskandar & Erdelen, Reference Iskandar and Erdelen2006), with significant gaps in taxonomic assessments. Compounding this issue, reptiles have been exploited for skin, meat and the pet trade throughout Indonesia (Shepherd, Reference Shepherd2000; Natusch & Lyons, Reference Natusch and Lyons2012; Nijman et al., Reference Nijman, Shepherd, Mumpuni and Sanders2012). Given the demand for reptiles, quotas and other management decisions based on species status are critical. Indonesia is considered to be an epicentre for illegal wildlife trade, and reptiles are traded in higher volume than any other taxonomic group throughout the Greater Sunda Region (Natusch & Lyons, Reference Natusch and Lyons2012). The reptile extinction risk across the Indo-Malayan region has been described as one of the highest in the world (Böhm et al., Reference Böhm, Collen, Baillie, Bowles, Chanson and Cox2013). Although CITES has implemented export quotas for multiple reptile species in Indonesia, species are continually misidentified and quotas are often applied across vast regions, sometimes neglecting to account for geographical isolation and potentially unrecognized lineages.
Here we highlight taxonomic and biogeographical challenges impeding conservation status assessments in Indonesia. We start by reviewing previous Red List assessments throughout Indonesia, and identify species categorized as Least Concern that are probably species complexes (multiple species assessed as one). We then use a model organism, Pseudocalotes tympanistriga (a lizard native to Indonesia), to test and contrast species status simulations under various species distribution modelling scenarios. Using these data we quantify the potential effects of complex biogeography on Red List status outcomes.
Methods
We gathered information on the status of all currently recognized reptiles in Java and Sumatra, to assess the conservation knowledge of major reptilian lineages. We focus specifically on Javan and Sumatran reptiles because our own herpetofaunal surveys conducted over the last 3 years focused on these islands. To generate a comprehensive list of all species of reptiles known to occur on Java and Sumatra we searched primary literature and web-based databases (Das, Reference Das2010; The Reptile Database, 2015). For each species we obtained its conservation status from the IUCN Red List (IUCN, 2015). Species not on the Red List were categorized as Not Evaluated. Using these sources we produced a summary of the Red List status of Javan and Sumatran reptiles, by major taxonomic group (crocodiles, lizards, snakes and turtles).
Species of Least Concern, and major biogeographical boundaries
The issue of species complexes is clearly defined in the IUCN guidelines for status assessment (IUCN, 2010). IUCN is not a taxonomic authority, and those who conduct Red List assessments conduct the best assessments possible with the information available. However, the challenges of complex biogeography and lack of funding for biological inventory can lead to significant problems when conducting Red List assessments.
We searched for examples of species complexes previously assessed for the IUCN Red List that span major biogeographical boundaries, widening our focus to include all reptile species that inhabit Indonesia (beyond the status assessments discussed above). We focused on species categorized as Least Concern because their Red List assessments are commonly based on a large distribution and the ability to occupy multiple habitat types. These characteristics suggest that multiple species may be assessed as a single Least Concern species. We further narrowed the list to species that are commonly exploited in trade, because cryptic species are likely to be more affected in such scenarios. The final list identified multiple commercially traded species that are categorized as Least Concern yet whose ranges cross distinct biogeographical boundaries. An exhaustive review of all Least Concern species that fall within this scenario is not feasible, and therefore we focus on three species for which sufficient background information is available for our study: Bronchocela jubata, Varanus indicus and Varanus salvator. We also discuss a fourth species, Varanus marmoratus, but we include this in the discussion of the V. salvator complex, from which it recently split.
A model system for status simulations
We identified a model system to quantify the effect of neglecting to consider biogeography in status assessments. We used P. tympanistriga (Gray, Reference Gray, Griffith and Pidgeon1831), a medium-sized arboreal lizard of the family Agamidae (Manthey, Reference Manthey2008), to simulate status assessments under various scenarios. Based on biogeography and a lack of taxonomic work we inferred that P. tympanistriga was in fact a species complex, and therefore any attempt to assess its status was likely to be inaccurate. We collected historical information, which assumes that P. tympanistriga is a single species, ranging across the islands of Java and Sumatra. We compared these data with the findings of our herpetofaunal surveys of Java and Sumatra during 2012–2014. During our surveys we systematically targeted geographically isolated mountain ranges to fill in sampling gaps. We then assessed basic phylogeographical relationships of P. tympanistriga and made contrasting simulations.
We used a combination of molecular and morphological characters to delimit species boundaries. To identify specimens of P. tympanistriga we first used the methods of Harvey et al. (Reference Harvey, Hamidy, Kurniawan, Shaney and Smith2014). Our morphological analysis facilitated identification of specimens closely related to P. tympanistriga for assessment. Considering all similar individuals (tentative P. tympanistriga) collected from Java and Sumatra, we sequenced the mitochondrial gene ND4 for a subset of individuals from each unique locality. We used the ND4-LEU mitochondrial fragment, which is commonly used in phylogenetic analyses of agamid lizards (Leaché et al., Reference Leaché, Chong, Papenfuss, Wagner, Bohme and Schmitz2009). We decided upon a single gene analysis on the basis that the morphological data in combination with a single gene analysis should provide corroboration of correct taxonomic placement prior to Red List assessment. DNA extraction methods and polymerase chain reaction (PCR) amplification protocols followed Leaché et al. (Reference Leaché, Chong, Papenfuss, Wagner, Bohme and Schmitz2009).
We included sequences from eight Pseudocalotes individuals and three out-groups in our phylogenetic analysis (out-groups were the genera Bronchocela, Calotes and Gonocephalus). Specific details on sequence generation and analysis are provided in Harvey et al. (Reference Harvey, O'Connell, Barraza, Riyanto, Kurniawan and Smith2015). We first conducted an unweighted pair group method with arithmetic mean analysis, to determine raw genetic divergence between specimens. Next, we conducted a Bayesian analysis following the protocols outlined in Harvey et al. (Reference Harvey, O'Connell, Barraza, Riyanto, Kurniawan and Smith2015), to visualize phylogenetic relationships. Using morphological data and overall genetic divergence between individuals as a guideline, we allocated specimens to the species P. tympanistriga and to other species where necessary (previously cryptic species). All sequences have been deposited in GenBank (GenBank, 2015) under accession numbers KT180139–KT180152 and KT211019 (Supplementary Table S1).
Quantifying effects of taxonomic uncertainty
Here, we quantify the effect of complex landscapes on Red List assessments. IUCN provides a clear set of guidelines for determining species status (IUCN, 2001, 2010). If an assessment meets specific criteria defined for any of the three threatened categories, the status Critically Endangered, Endangered or Vulnerable is assigned. Alternatively, a species may be categorized as Near Threatened, Least Concern or Data Deficient. If status can be assessed using multiple methods, IUCN recommends using the most conservative estimate. In our simulation we chose a straightforward method for rapid assessment, which focused on the geographical range of the species in question. We used two metrics to emulate the Red List assessment of P. tympanistriga, Area of Occupancy (AOO) and Extent of Occurrence (EOO), which require only the geographical coordinates of all individuals collected.
After identifying true P. tympanistriga individuals for Red List assessment we uploaded collection coordinates from a global positioning system into the program GeoCAT (Bachman et al., Reference Bachman, Moat, Hill, de la Torre and Scott2011), which makes IUCN Red List assessments based on the EOO and AOO of the species in question.
We ran two analyses to contrast possible conservation status outcomes. In the first analysis (Simulation 1) we used all confirmed P. tympanistriga samples and uploaded their localities into GeoCAT. We specified an AOO of 15 km2 (per individual), which is the approximate extent of highland forest habitat on mountain islands inhabited by the species in West Java. Next, we analysed all Pseudocalotes samples from Java and Sumatra (Simulation 2) that would have all been considered to be P. tympanistriga prior to our taxonomic work (without consideration of geographical boundaries). We uploaded their localities into GeoCAT and assigned an AOO of 25 km2 (per individual). In Simulation 2 our Pseudocalotes samples from further north in Sumatra expanded the EOO significantly, leaving larger mountainous areas unaccounted for in sampling. Thus, we used a larger AOO in Simulation 2 to account for wider sampling gaps, for a more realistic representation of a highland species’ range in that scenario. It is important to note that these methods require a high degree of confidence in sufficient sampling effort because failure to find individuals present across the entirety of their range can significantly alter the results. We believe our survey effort was sufficient to record accurate presence/absence information for P. tympanistriga, particularly because this was not a formal assessment.
Species distribution modelling
Niche modelling, or species distribution modelling, has been highlighted as a potential tool for assisting in IUCN Red List assessments, particularly when occurrence data are limited (Pena et al., Reference Pena, Kamino, Rodrigues, Mariano-Neto and de Siqueira2014; Syfert et al., Reference Syfert, Joppa, Smith, Coomes, Bachman and Brummitt2014). The modelling can be accomplished whether or not taxonomic work has been done, and therefore may overestimate a species’ range and underestimate the level of threat it faces. We use our simulation species P. tympanistriga to emphasize these points.
We downloaded all 18 bioclimatic variable files (30 s resolution) available at WorldClim (2015). We formatted the files for species distribution modelling using the Clip and Raster to ASC tools in ArcMap 10.0 (ESRI, Redlands, USA). We uploaded the climate files into the MaxEnt 3.3.3k niche modelling software (Phillips et al., Reference Phillips, Anderson and Schapire2006) and added our locality data for P. tympanistriga in conjunction with historical locality data (Manthey, Reference Manthey2008; HerpNET, 2015). We used the Auto Features settings and altered the number of iterations (from 500 to 5,000) to allow for convergence of data, changed the replicated run type to Subsample, and set the random test percentage to 25. Using these settings we modelled potential P. tympanistriga distribution. We assessed the omission data plot, the area under the curve plot and the species range map generated. The range map indicates the probability of occurrence (0.0–1.0). We arbitrarily considered high-quality habitat to be 0.9–1.0, medium-quality habitat to be 0.7–0.9, and low-quality habitat to be 0.5–0.7. Anything <0.5 was considered to be unsuitable habitat. We consider these arbitrary limits to be acceptable because (1) the estimates are conservative, and (2) they are only used to provide a relative indication of how species distribution models can affect estimates of EOO (not to determine the formal status).
Results
IUCN status of reptiles and amphibians in Java and Sumatra
A literature and web search revealed that there are 248 naturally occurring reptile species in Java and Sumatra (Supplementary Table S2), and eight species of questionable occurrence (sightings based on unconfirmed reports or possibly introduced). Of these species, three are crocodiles (Crocodylia), 18 are turtles (Testudines), 90 are lizards (Sauria) and 145 are snakes (Serpentes). We found that lizards had a lower percentage of species assessed than other groups, whereas crocodiles and turtles have received the most attention (Fig. 1).
Summarized status assessments of all currently recognized species of (a) lizards, (b) snakes, (c) turtles, (d) crocodiles, and (e) all reptiles combined on the islands of Java and Sumatra, Indonesia.

Four species are categorized as Critically Endangered, six as Endangered, seven as Vulnerable, three as Near Threatened, 107 as Least Concern, 28 as Data Deficient, and 101 as Not Evaluated (Fig. 1). In total 50.5% of the reptile species from Java and Sumatra are categorized as Data Deficient or Not Evaluated, 42.2% are categorized as Least Concern, and 7.3% have a status of Near Threatened or worse.
Varanus salvator, Varanus indicus and Bronchocela jubata
The three species categorized as Least Concern that we reviewed are probably species complexes (multiple species assessed as one), spanning major biogeographical breaks. The first, V. salvator, has been identified as the most heavily exploited species in the international skin trade (Koch et al., Reference Koch, Ziegler, Böhme and Auliya2013). Indonesia has high export quotas for this species. Reports from 2000–2010 estimate that 6.2 million skins from wild caught V. salvator were traded during that period, and c. 11,500 skins were confiscated (Koch et al., Reference Koch, Ziegler, Böhme and Auliya2013). To a lesser extent the species is also captured and traded for consumption (Koch et al., Reference Koch, Ziegler, Böhme and Auliya2013). In addition, an unknown number of wild V. salvator are harvested every year from across their range. The species complex is listed in CITES Appendix II (CITES, 2016) and data on the known export of the species are available in the CITES Trade Database (CITES, 2015). Details of V. salvator exports from Indonesia in 2013 are in Table 1. Despite the high demand, there is little consideration for biogeographical barriers in current harvest quotas across Indonesia.
Data on exports of Varanus salvator from Indonesia in 2013, with importing country, quantity, term and source.

Varanus salvator was assessed as Least Concern in 2009 (Bennett et al., Reference Bennett, Gaulke, Pianka, Somaweera and Sweet2010), based on its wide distribution, abundance and ability to live in a range of habitats. However, at the time of assessment there were four recognized subspecies (specifically stated to be included in the assessment) and evidence of a large species complex (V. salvator salvator, V. salvator bivittatus, V. salvator macromaculatus, V. salvator andamanensis). The assessors clearly indicated the likelihood of undescribed species within the complex; for example, at the time of assessment the range of the subspecies V. salvator bivittatus extended through Java and across Wallace's Line (a major biogeographical barrier) to multiple islands, including Bali, Lombok, Sumbawa, Flores, Ombai and Wetar (Fig. 2), yet there are no genetic or morphological data from these islands to confirm taxonomic relationships.
The estimated range of (a) Bronchocela jubata, with the major biogeographical breaks (Wallace's and Huxley's Lines) indicated, and question marks indicating unknown occurrence in some areas, (b) Varanus salvator subspecies and the recently described species Varanus togianus, with Wallace's and Weber's Lines, and (c) Varanus indicus, with Lydekker's Line.

Prior to the Red List assessment taxa were resurrected in a morphological study of the V. salvator complex in 2007, and a population from Sulawesi was described as a distinct species, V. togianus (Koch et al., Reference Koch, Auliya, Schmitz, Kuch and Böhme2007). In 2010 a new subspecies (V. salvator ziegleri) was described from the Moluccan Islands far to the east of Sulawesi (Koch et al., Reference Koch, Gaulke and Böhme2010) and across another major biogeographical break (Huxley's Line; Fig. 2b). Therefore, one cryptic species from the middle of V. salvator's distribution was elevated to species status (V. togianus in 2007), and the discovery of the new subspecies V. salvator ziegleri extended the distribution of the V. salvator complex further east. Varanus salvator ziegleri is a clear example of a questionable lineage being traded as V. salvator.
Similarly, V. marmoratus was assessed as Least Concern in 2007 (Gaulke et al., Reference Gaulke, Sy, Afuang, Duya, Diesmos and Gonzalez2009), having been split from the V. salvator complex (Koch et al., Reference Koch, Auliya, Schmitz, Kuch and Böhme2007). However, in 2010 V. marmoratus was identified as a species complex, and two species from small island chains were described and split from V. marmoratus. These species are currently recognized as V. palawanensis and V. rasmusseni (Koch & Böhme, Reference Koch and Böhme2010) but had been traded as a species of Least Concern since 2007, under the name V. marmoratus. Two more species from the V. marmoratus complex (V. bangonorum and V. dalubhasa) have since been described (Welton et al., Reference Welton, Travers, Siler and Brown2014). As with the previous cases, these two species are still traded under a status of Least Concern.
Our second example, V. indicus (Daudin, Reference Daudin1802), occurs across much of eastern Indonesia (Fig. 2c) and was assessed as Least Concern in 2009 (Bennett & Sweet, Reference Bennett and Sweet2010). Varanus indicus is traded heavily across Indonesia and is listed in CITES Appendix II (CITES, 2016). Although the species is protected in Indonesia, it is still traded in high numbers as bred in captivity, and it is difficult to differentiate between wild-caught and captive-bred individuals.
Prior to the assessment of V. indicus a new species, V. caerulivierens, was described from Halmahera Island (Ziegler et al., Reference Ziegler, Böhme and Philipp1999). Another new species from Halmahera Island, V. rainerguentheri, was described by Ziegler et al. (Reference Ziegler, Böhme and Schmitz2007), who also summarized the taxonomy of other species that had previously been split from V. indicus. These changes were an indication that V. indicus was more diverse than recognized, and in 2009 the assessors stated that V. indicus probably consisted of multiple cryptic species, spanning biogeographical boundaries (e.g. Lydekker's Line; Fig. 2c). There have been major taxonomic revisions since the Red List assessment; for example, the description, in 2010, of V. obor, from the northern Moluccas Islands (Weijola & Sweet, Reference Weijola and Sweet2010), which confirms that at least one cryptic species was hidden under the categorization of V. indicus as Least Concern.
Varanus indicus also occurs on Savo Island (c. 30 km2), in the Solomon Archipelago (Koch et al., Reference Koch, Ziegler, Böhme and Auliya2013). However, as the archipelago is distant from other V. indicus populations the species found there may be distinct from V. indicus. This is yet to be determined, but high trade quotas across the region could wipe out that small island population before this question is answered.
Bronchocela jubata (Duméril & Bibron, Reference Duméril and Bibron1837) has received less attention than Varanus species; however, its distribution suggests three potential scenarios: (1) B. jubata may be a large species complex; (2) B. jubata has been introduced across major biogeographical regions; or (3) B. jubata is a single, wide-ranging species. This last scenario is unlikely because other terrestrial vertebrates do not typically follow that distributional pattern across the same biogeographical barriers. Although the taxonomic relationships of this group are yet to be studied, B. jubata is currently categorized as Least Concern on the IUCN Red List (Ineich & Hallermann, Reference Ineich and Hallermann2010). This status was determined based on the species’ distribution, abundance and ability to live in multiple habitat types. Bronchocela jubata is currently stated to range across South-east Asia and across Wallace's Line and Weber's Line (Fig. 2a). This range spans hundreds of islands, many of which have been in isolation for thousands or even millions of years. Based on this, and other species distributional patterns (Woodruff, Reference Woodruff2010), it is unlikely that all populations of B. jubata belong to a single species.
The uncertainty regarding the distribution of B. jubata was highlighted in a review of the genus Bronchocela (Hallermann, Reference Hallermann2005). It is possible that rare species are concealed under the blanket name B. jubata and traded in high numbers. Unlike many of the Varanus species, B. jubata is not currently of concern for CITES and there is no available information on trade quotas for this species. Although it is not traded to the same extent as some Varanus species, B. jubata is sold regularly in the pet trade (authors, pers. obs.). Bronchocela jubata has not yet received the taxonomic evaluation necessary to uncover taxonomic relationships among populations.
Biogeographical barriers may affect the distribution of the lizards discussed here differently than they would other groups of reptiles, because dispersal capabilities vary among species. Furthermore, some populations of the study species may have been introduced by humans. However, these three examples highlight the main difficulties associated with status assessments across heterogeneous landscapes, and these challenges are applicable to other reptilian groups beyond the scope of this study.
Case study species assessment simulation
Pseudocalotes tympanistriga was previously thought to occur throughout the Barisan Mountain Range of Sumatra and the mountains of western Java. However, all specimens in the HerpNET database (HerpNET, 2015) are from various parts of west Java; none are confirmed from Sumatra.
During our herpetofaunal inventory we collected 45 P. tympanistriga individuals from Java (Fig. 3). From Sumatra we collected 18 Pseudocalotes spp. (Fig. 3), all similar to P. tympanistriga but with several morphological differences. After thorough examination we concluded that Sumatran specimens belonged to multiple cryptic species (Plate 1). The species P. cybelidermus, P. guttalineatus and P. rhammanotus have been described by Harvey et al. (Reference Harvey, Hamidy, Kurniawan, Shaney and Smith2014), who are also in the process of describing a fourth species, P. baliomus. We found that all Pseudocalotes from Sumatra were only superficially similar to P. tympanistriga. Our phylogenetic analyses were in agreement with our morphological findings and clearly show genetic differentiation among the Pseudocalotes species (Fig. 4), and therefore we conclude that P. tympanistriga is restricted to Java and does not span the biogeographical barriers between Java and Sumatra. Using these data we parsed our simulations accordingly.
Collection localities of Pseudocalotes spp., with species delimited based on morphological and genetic differentiation. Coordinates and specimen ID numbers are in Supplementary Table S1.

(a) Results of unweighted pair group method with arithmetic mean analysis, which indicate that there are four distinct lineages of Pseudocalotes in addition to P. tympanistriga. The scale bar represents the pairwise genetic distance (percentage) between individuals. (b) Results of Bayesian phylogenetic analysis, which show similar relationships to (a) with some minor differences. The scale bar in the Bayesian analysis corresponds to the mean number of substitutions per site.

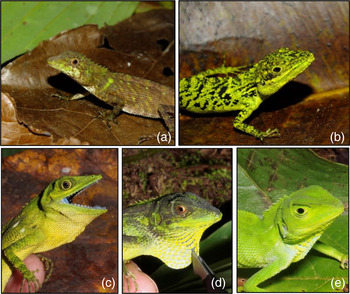
The five superficially similar Pseudocalotes species, which we delimited before conducting an IUCN Red List assessment simulation for P. tympanistriga: (a) P. rhammanotus; (b) P. tympanistriga; (c) P. species 4 (Pseudocalotes baliomus; unpubl. data); (d) P. cybelidermus; (e) P. guttalineatus.
In our first Red List assessment simulation (Simulation 1) of taxonomically confirmed P. tympanistriga (Javan lizards only), GeoCAT calculated an EOO of 1,051 km2 and recommended categorization as Endangered. The AOO calculated was 1,200 km2, with a recommendation of Vulnerable status. In contrast, a hypothetical assessment that included all specimens (Javan and Sumatran) previously considered to be P. tympanistriga (Simulation 2) yielded different results. The outcome was an EOO of 38,605 km2 and a recommendation of Near Threatened status (although with EOO of nearly 40,000 km2 the status could even be considered to be Least Concern). The AOO was 5,000 km2 and GeoCAT recommended a status of Least Concern based on that metric. These analyses simulate assessment before and after taxonomic verification (Fig. 5). Without accounting for biogeography we would have significantly underestimated the potential threat to P. tympanistriga. We only consider geographical range here to demonstrate our point; however, in a formal Red List assessment other sub-conditions would also be considered (e.g. levels of exploitation, fragmentation, evidence of decline; IUCN, 2001), which is beyond the scope of this work.
The IUCN Red List assessment of P. tympanistriga produced using GeoCAT (a) prior to any taxonomic verification being conducted on P. tympanistriga, and (b) after taxonomic verification (i.e. only actual P. tympanistriga are included).

Species distribution modelling, P. tympanistriga
MaxEnt outputs for P. tympanistriga estimated the highest quality habitat (0.9–1) occurred across the mountains of West Java, two small islands east of Java and south-central Sumatra. Medium-quality habitat (0.7–0.9) was distributed across Java and small neighbouring islands to the east of Java, throughout Sumatra, and in isolated patches in Borneo. Low-quality habitat (0.5–0.7) was distributed across Borneo, Java (and islands to the east), Sulawesi and Sumatra (Fig. 6). The area under the curve plot indicated a well-fit model with training data = 0.991 and test data = 0.993 (where a random prediction is 0.5; Pena et al., Reference Pena, Kamino, Rodrigues, Mariano-Neto and de Siqueira2014). Without taxonomic evaluation the species distribution modelling approach would suggest that P. tympanistriga occurs across a wide range (throughout Sumatra), significantly overestimating range and EOO.
Species distribution modelling output from MaxEnt analysis of P. tympanistriga, which significantly overestimates the range of the species. The bar on the left indicates probability of occurrence.

Discussion
We have provided evidence that complex biogeography may be leading to threatened species being categorized for the Red List under common species names, which can lead to extinction of unknown species. The problem is amplified when dealing with species of high economic value, particularly across an archipelagic nation such as Indonesia. On the islands of Java and Sumatra alone the majority of reptile species are categorized as Data Deficient, Not Evaluated (c. 50% combined) or Least Concern (c. 42%). Lizards and snakes represent the largest proportion of poorly studied reptiles in West Indonesia, and we suspect that a high number of species that have not yet been fully studied taxonomically are being categorized prematurely as Least Concern because they have large ranges across major biogeographical breaks. Potential examples among the snakes include the amethystine scrub python Morelia amethistina, which could comprise multiple distinct species, and Gunther's whip snake Ahaetulla prasina, which is distributed across a broad geographical range and multiple islands.
Had we assumed that all similar Pseudocalotes lizards from Java and Sumatra were P. tympanistriga we would have concluded a status of Least Concern or, at worst, Near Threatened. Our integrative analysis (considering biogeography beforehand) was sufficient to determine that P. tympanistriga is composed of multiple unrecognized species and that P. tympanistriga does not occur in Sumatra, thus diminishing the known EOO and AOO for the species. Our findings indicate that P. tympanistriga should actually be categorized as Vulnerable, or potentially Endangered, and cryptic Pseudocalotes species on Sumatra require additional survey attention. Our Pseudocalotes dataset also shows that species distribution modelling methods can result in similarly biased outcomes, which exaggerate estimates of species range. Authors who suggest species distribution models as a tool for assisting in species status assessments emphasize that taxonomic verification is important (Pena et al., Reference Pena, Kamino, Rodrigues, Mariano-Neto and de Siqueira2014; Syfert et al., Reference Syfert, Joppa, Smith, Coomes, Bachman and Brummitt2014). However, it is clearly not trivial to ensure a single species rather than a species complex is being included in species distribution models, particularly across mountain or true island systems.
The Balai Konservasi Sumber Daya Alam (Natural Resources Conservation Agency) is currently responsible for setting provincial trade quotas for each species across Indonesia. However, these quotas are arbitrary if no scientific information is available. We suggest that Indonesia's trade quotas should be further divided across separately managed zones for species whose ranges cross major biogeographical boundaries, and for which there has been no recent taxonomic evaluation. We acknowledge this may be difficult to enforce in areas lacking the appropriate resources. Forensic techniques may be necessary to identify the origins of species being traded, as have been used for black-market ivory in Africa (Wasser et al., Reference Wasser, Shedlock, Comstock, Ostrander, Mutayoba and Stephens2004) and monitor lizards in the Philippines (Welton et al., Reference Welton, Siler, Linkem, Diesmos, Diesmos, Sy and Brown2013). Genotyping methods will work for reptiles in Indonesia only if biological samples are collected from as many locations as possible so that genetic signatures can be determined in multiple geographical locations.
In addition to the challenges of biogeography and limited taxonomic sampling, researchers conducting conservation status assessments also have difficulties in obtaining the proper permits, with the bureaucratic process sometimes taking up to 1 year, and those with restricted funding may be unable to afford the process. Fees to enter National Parks to conduct research have also been raised considerably in recent years and permits are often difficult to obtain. Without permits some of the last patches of primary forest habitat are rendered inaccessible to researchers. Although countries follow strict guidelines to ensure that research is carried out appropriately, in some cases this leads to less research being conducted.
Taxonomic relationships are continually being revised, as are researchers’ perceptions of where species' boundaries should be drawn. Therefore, it is unrealistic to suggest that species status assessments are put on hold until samples are collected from every possible locality, particularly in a large archipelagic nation such as Indonesia. We also acknowledge that categorization as Data Deficient may be harmful to species that are clearly under threat and require protection. However, there are many cases where species assessments need to be more conservative because inaccurate assessment can be more detrimental than helpful. This is particularly the case in regions with complex, heterogeneous landscapes and poorly sampled areas. We suggest prioritization of funding for broad-scale biological inventory in unexplored regions, which is critical for unravelling taxonomic relationships and, consequently, improving conservation efforts.
Acknowledgements
We are grateful to representatives of the Indonesian Institute of Sciences (LIPI) at the Museum Zoologicum Bogoriense (MZB) for facilitating the study of specimens from Indonesia, and the acquisition of field research permits, namely Boadi, M. Amir, R. Ubaidillah, I Sidik, and Ir. R. M. Marwoto. We thank the Ministry of Research and Technology of the Republic of Indonesia (RISTEK) for coordinating and granting research permissions. Pak S. Wahyono (RISTEK) provided assistance throughout the permitting process. RISTEK and LIPI reviewed and approved our fieldwork in Indonesia and provided export permits for specimens to the USA. W. Trilaksono, I. Sidik, and A. Ryanto provided laboratory assistance at MZB. Mr Widodo and Marwoto from the Faculty of Mathematics and Natural Sciences of Universitas Brawijaya (MIPA-UB) kindly provided logistical support. The Forestry Department of Indonesia kindly provided research permits. We thank the local communities for their support, advice and kindness during our travels. We thank the members of the field expeditions throughout Java and Sumatra: G. Barraza (Broward College), U. Arifin (Institut Teknologi Bandung), W. Trilaksono (MZB), C. Franklin, K. O'Connell, U. Smart, A. M. Kadafi, D. R. Wulandari, R. Darmawan, K. I. Nawie, A. Dharasa, and S. Pratassi (MIPA-UB). We thank Eric Smith and Carl Franklin for the photographs in Plate 1. This research was funded by a National Science Foundation grant (DEB-1146324) to E.N. Smith and M.B. Harvey.
Biographical sketches
Kyle J. Shaney is interested in biogeography, conservation and wildlife ecology. Elijah Wostl, Amir Hamidy and Nia Kurniawan are particularly interested in the biogeography and taxonomy of reptiles and amphibians. Michael Harvey and Eric Smith are interested in the biogeography and alpha taxonomy of reptiles and amphibians.


