

1 Introduction
The social meaning of language variation has been prominent since the advent of the third wave of the variationist sociolinguistic paradigm (e.g. Eckert Reference Eckert2000; Kiesling Reference Kiesling2004; Campbell-Kibler Reference Campbell-Kibler2007; Podesva Reference Podesva2007; Moore & Podesva Reference Moore and Podesva2009; Cole Reference Cole2020; see also Labov Reference Labov1963). Such works have shed light on the non-referential meanings of linguistic features, from words (e.g. Kiesling Reference Kiesling2004; Bucholtz Reference Bucholtz and Jaffe2009) to morphosyntax (Moore & Podesva Reference Moore and Podesva2009), to phonetics and phonology (Foulkes & Doherty Reference Foulkes and Doherty2006; Eckert & Labov Reference Eckert and Labov2017). However, the study of semantic meaning in sociolinguistics has been somewhat neglected (although, see Robinson Reference Robinson2010a, Reference Robinson, Geeraerts and Kristiansen2010b, Reference Robinson2012a, Reference Robinson, Allan and Robinson2012b, Reference Robinson, Glynn and Robinson2014; Beal & Burbano-Elizondo Reference Beal and Burbano-Elizondo2012; Bailey & Durham Reference Bailey and Durham2021; Sandow Reference Sandow2023a, Reference Sandow2023b, Reference Sandowin press; for discussion see Durkin Reference Durkin2012; Robinson Reference Robinson2012a; Sandow Reference Sandow2021). This article seeks to redress the limited, but growing, body of literature on the socially mediated trajectory of semantic change in the context of social meaning by exploring the polysemous adjective wicked.
In this article we report on the usage and perception of wicked, using evidence from two studies. The first, conducted in Cornwall in 2017–18, focuses on the social distribution of the senses of this polysemous word, such as ‘evil’ and ‘good’. The second study, conducted online across England in 2022, employs the matched-guise technique and investigates the perception of two senses of wicked, ‘evil’ and ‘good’. We find that while a change towards wicked ‘good’ is female-led among older speakers, younger women do not continue with the incrementation of this change; in contrast, their male counterparts rapidly accelerate this incrementation. In terms of perception, in study 2, we find that older men perceive wicked ‘good’ to index both solidarity-type and status-type traits, while wicked ‘evil’ is perceived to index status-type traits, particularly ‘educated’. We conclude that the social meaning of the senses of wicked can, to a great extent, account for the socially mediated incrementation, and lack thereof, of this polysemous adjective.
2 Background
The study of semantic change is a developing area of sociolinguistics, a field which traditionally eschewed lexis from its ‘theoretical and epistemological considerations’ (Robinson Reference Robinson2012a: 38; see also Durkin Reference Durkin2012). Most sociolinguistic studies that do consider lexis do so from the perspective of onomasiology, that is, variation in the word form (e.g. Meyerhoff Reference Meyerhoff1993; Chambers Reference Chambers2000; Beeching Reference Beeching, Pooley and Lodge2011; Tagliamonte & Brooke Reference Tagliamonte and Brooke2014; Braber Reference Braber, Braber and Jansen2018; Sandow & Robinson Reference Sandow, Robinson, Braber and Jansen2018; Sandow Reference Sandow2020; Lafond & Moffett Reference Lafond and Moffett2020; Tagliamonte & Pabst Reference Tagliamonte and Pabst2020), rather than semasiology,Footnote 2 that is, variation in word meaning. Despite this, the fact that semantic change follows a socially mediated trajectory has been repeatedly attested in recent years (e.g. Robinson Reference Robinson2010a, Reference Robinson, Geeraerts and Kristiansen2010b; Beal & Burbano-Elizondo Reference Beal and Burbano-Elizondo2012; Bailey & Durham Reference Bailey and Durham2021; Sandow Reference Sandow2023b, Reference Sandowin press). For example, using elicited data, Robinson (Reference Robinson2012a) found the polysemous adjective gay to be undergoing change in apparent-time, with males leading the change from ‘happy’ towards the senses ‘homosexual’ and ‘lame’. Bailey & Durham (Reference Bailey and Durham2021) used acceptability judgements to trace the development of the sense cheeky ‘mildly illicit’, with younger speakers in Britain leading this shift from cheeky ‘impudent’ towards greater acceptance of the innovative variant. Such studies have demonstrated the structured heterogeneity of semantic change. However, this body of socio-semantic research literature remains somewhat limited. We argue that without a lexical perspective, our knowledge of language and society, and the subsequent theory, is necessarily abridged. By contributing to a developing lexis-oriented branch of sociolinguistic theory, we are testing the utility of sociolinguistic theory and working towards a more holistic knowledge of the social life of language and the mechanisms of linguistic change.
In recent decades, a number of studies have investigated the social meaning of lexical items. Such studies typically either infer social meanings from usage patterns (e.g. Kiesling Reference Kiesling2004; Bucholtz Reference Bucholtz and Jaffe2009; Snell Reference Snell2018) or from metalinguistic discussion (e.g. Robinson Reference Robinson2010a; Braber Reference Braber2022; Sandow Reference Sandow2022, Reference Sandow2023a, Reference Sandow2023b). While studies have used experimental methods to explore the social meaning of phonetic, phonological and morphosyntactic features, such as the matched-guise technique (Campbell-Kibler Reference Campbell-Kibler2007; Johnstone & Kiesling Reference Johnstone and Kiesling2008; Gilabert & Fuss Reference Gilabert, Fuss, King and Sessarego2018), Implicit Association Test (Campbell-Kibler Reference Campbell-Kibler2012; McKenzie & Carrie Reference McKenzie and Carrie2018; Álvarez-Mosquera & Marín-Gutiérrez Reference Álvarez-Mosquera and Marín-Gutiérrez2021) and the Social Category Association test (Llamas et al. Reference Llamas, Watt and MacFarlane2016), limited research has employed such methods at the level of lexical variation.
Pragmatic and discourse features have also been studied through the matched-guise technique (e.g. Dailey-O'Cain Reference Dailey-O'Cain2000; Buchstaller Reference Buchstaller2006; Maddeaux & Dinkin Reference Maddeaux and Dinkin2017; Davydova & Hazen Reference Davydova and Hazen2021; Schleef Reference Schleef2022). For example, Dailey-O'Cain (Reference Dailey-O'Cain2000) used the matched-guise technique to explore the social meanings of discourse marker like and quotative like. Dailey-O'Cain (Reference Dailey-O'Cain2000) found that like Footnote 3 is associated with speakers who are younger, attractive, cheerful, friendly and successful, but less educated. One study which does demonstrate the applicability of such experimental methods to lexical variation is Beltrama & Staum Casasantro (Reference Beltrama and Casasanto2017), who demonstrated that matched-guise techniques can highlight social meanings at the level of lexical variation.Footnote 4 For example, totally, as an unbounded adjective, solicits stronger social meanings relating to solidarity (friendly, outgoing, excitable and cool) than its synonyms completely and really as well as a null (bare form) variant.
This existing body of research tends to focus on either semantic production or perception. In this article we consider production and perception as two sides of the same coin and report on both the usage and social meanings of the polysemous adjective wicked.
3 Wicked
Due to an ameliorative semantic shift-to-opposite affecting the adjective wicked, the more traditional sense which we gloss here as ‘evil’ now exists alongside the sense we gloss as ‘good’. The Oxford English Dictionary (OED online) first attests the usage of the former sense in c.1275 and defines it as ‘[b]ad in moral character, disposition, or conduct; inclined or addicted to wilful wrongdoing; practicing or disposed to practice evil; morally depraved’. The second sense, attested by the OED (online) in 1920 in the USA and 1977 in the UK, is defined as ‘[e]xcellent, splendid; remarkable’. Thus, wicked is now an auto-antonym, with the word having two senses which are opposite in meaning, that is, ‘evil’ and ‘good’.
One study which has investigated the semantic change in the usage of wicked is Robinson (Reference Robinson2010a; see also Robinson Reference Robinson, Glynn and Robinson2014),Footnote 5 conducted in Sheffield, South Yorkshire, in 2006–7. Robinson found real-time evidence of the change towards ‘good’ from corpus evidence and in apparent-time using elicited data. The elicited data were analysed for sociolinguistic patterns of variation. Young people were more advanced in the use of wicked ‘good’, indicating a change in apparent-time. This change was also more advanced among females aged 19–60 (Robinson personal communication). Robinson (Reference Robinson2010a: 267) does highlight that wicked ‘good’ is likely to have a ‘life expectancy’, suggesting that this change may be ephemeral or age-graded.
Robinson (Reference Robinson2010a) also provides some metalinguistic commentary from participants relating to the semantic change of wicked, which provides insight into its social meanings. For example, Robinson (Reference Robinson2010a: 210) reports participants who observe that ‘wicked ‘good’ is [used in] speaking and wicked [‘evil’] in writing’ and it is ‘a question of class and education if you use wicked ‘good’’.Footnote 6 While such comments provide specific insights into the indexical meaning of the senses of wicked, more broadly, they also evidence that this semantic change is occurring above the level of conscious awareness.
In the present article, we explore three research questions:
• How is the semantic change of wicked conditioned by social factors?
• How are the two senses of wicked, ‘evil’ and ‘good’, perceived?
• To what extent can perception data be used to explain production results?
The first study explores the first question, while the second question is investigated in the second study. We synthesise the results of both studies to answer our third research question.
4 Study 1– Semantic variation
Study 1 is concerned with patterns of semantic variation and change in the usage of wicked. The method reported on here is part of a larger study conducted by the first author of this article (see Sandow Reference Sandow2021). Eighty speakers from the Cornish towns of Camborne and Redruth, and surrounding villages, were interviewed in 2017–18. The participants in this study were balanced for age (older than 40, N = 40, younger than 30, N = 40),Footnote 7 gender (male, N = 40, female, N = 40),Footnote 8 and socioeconomic class (middle- class, N = 40, working-class, N = 40),Footnote 9 with each of these categories being conceived of as binary.
Semasiological data were elicited by employing a methodology developed and first executed by Robinson (Reference Robinson2010a). Robinson's who/what and why method consists of two adjacency pairs of which the first is designed to elicit a reference of the investigated polysemous word and the second is designed to elicit a sense, such as:
Q1: Who or what is wicked?
A1: My uncle
Q2: Why is your uncle wicked?
A2: Because he's so cool
It is thought (see Robinson Reference Robinson2010a) that this method is less direct than simply asking ‘what does X mean’. This is advantageous as direct questioning, e.g. ‘what does wicked mean’, is not consistent with the elicitation of relatively unmonitored speech (e.g. Labov Reference Labov1972, Reference Labov, Baugh and Sherzer1984). Using this method, the structured semantic variation of polysemous adjectives (Robinson Reference Robinson2010a, Reference Robinson, Geeraerts and Kristiansen2010b, Reference Robinson2012a, Reference Robinson, Allan and Robinson2012b, Reference Robinson, Glynn and Robinson2014) and (using a slightly adapted elicitation prompt) nouns (e.g. Sandow Reference Sandow2023a, Reference Sandow2023b)Footnote 10 has been well attested.
Participants were asked about each word twice, with the stimuli in Q1 altering slightly in the second iteration to ‘who or what else is [polysemous adjective]’. By asking the participants the who/what questions twice, participants had the opportunity to provide two senses of the word under investigation. In the study, participants were asked to provide senses for ten words. Eight of these were adjectives, namely, sick, wicked, awesome, hot, gay, cool, fit and hard, as well as two nouns, the Anglo-Cornish dialect words emmet ‘tourist/ant’ (see Sandow Reference Sandow2023b) and maid ‘woman/female servant or attendant’ (see Sandow Reference Sandow2023a).
It is important to note that our conceptualisation of the semasiological variable here requires a departure from the more traditional definition of a sociolinguistic variable. While Labov (Reference Labov1978: 13) asserted that ‘we must not avoid the study of differences of meaning’, the study of semantic variation is not directly compatible with Labov's (Reference Labov1972: 271) classic conceptualisation of the sociolinguistic variable as ‘two ways of saying the same thing’. Despite the centrality of this concept to the variationist programme, there is a relatively large body of research, particularly that which extends the envelope of variation beyond phonetics and phonology, that eschews this definition in favour of functional equivalence (for discussion, see Dines Reference Dines1980; Coupland Reference Coupland1983; Pichler Reference Pichler2010; Terkourafi Reference Terkourafi2011). However, the semasiological variable also cannot be defined in terms of functional equivalence. Robinson (Reference Robinson2010a: 275) proposes that a semasiological variable can be thought of as ‘saying different things in the same way’. Various studies using this definition of the semantic variable have demonstrated highly socially stratified patterns of variation (e.g. Robinson Reference Robinson2010a, Reference Robinson, Geeraerts and Kristiansen2010b, Reference Robinson2012a, Reference Robinson, Allan and Robinson2012b, Reference Robinson, Glynn and Robinson2014; Sandow Reference Sandow2023a, Reference Sandow2023b, Reference Sandowin press). It is this definition of the variable that we adopt in this study.
From the elicitation procedure used in study 1, wicked ‘evil’, wicked ‘good’, wicked ‘musical’Footnote 11 and wicked ‘good_reported’ are the four attested variants. The ‘reported’ variant refers to instances where participants demonstrated an awareness of the sense but made clear that they did not use this sense, such as ‘I know young people would use wicked when talking about something good but I don't do that’ (see also Robinson Reference Robinson2010a).
4.1 Results
We focus our analysis on wicked ‘good’ (N = 37) and wicked ‘evil’ (N = 113), collapsing other uses (such as the musical) into a single wicked ‘other’ category due to their low frequencies (N = 10). It is important to note here that the number of tokens collected is relatively small but, despite this, they serve to reveal usage patterns which speak to the socially mediated distribution of the senses of wicked.
Initial exploratory analysis reveals an overall change in apparent time towards increasing wicked ‘good’ usage among the younger generations; the use of this sense has increased from 11 per cent (N = 9/80) among older speakers to 35 per cent (N = 28/80) among younger speakers. Considering gendered patterns of variation also reveals an interesting interaction, with wicked ‘good’ increasing from 15 per cent (N = 6/40) among older women (aged 40+) to 25 per cent (N = 10/40) among women younger than 30, while for men the change has seen rates increase more dramatically from 7.5 per cent (N = 3/40) to 45 per cent (N = 18/40). This displays an apparent cross-over effect, with women previously leading the change towards wicked ‘good’ before being overtaken by men.
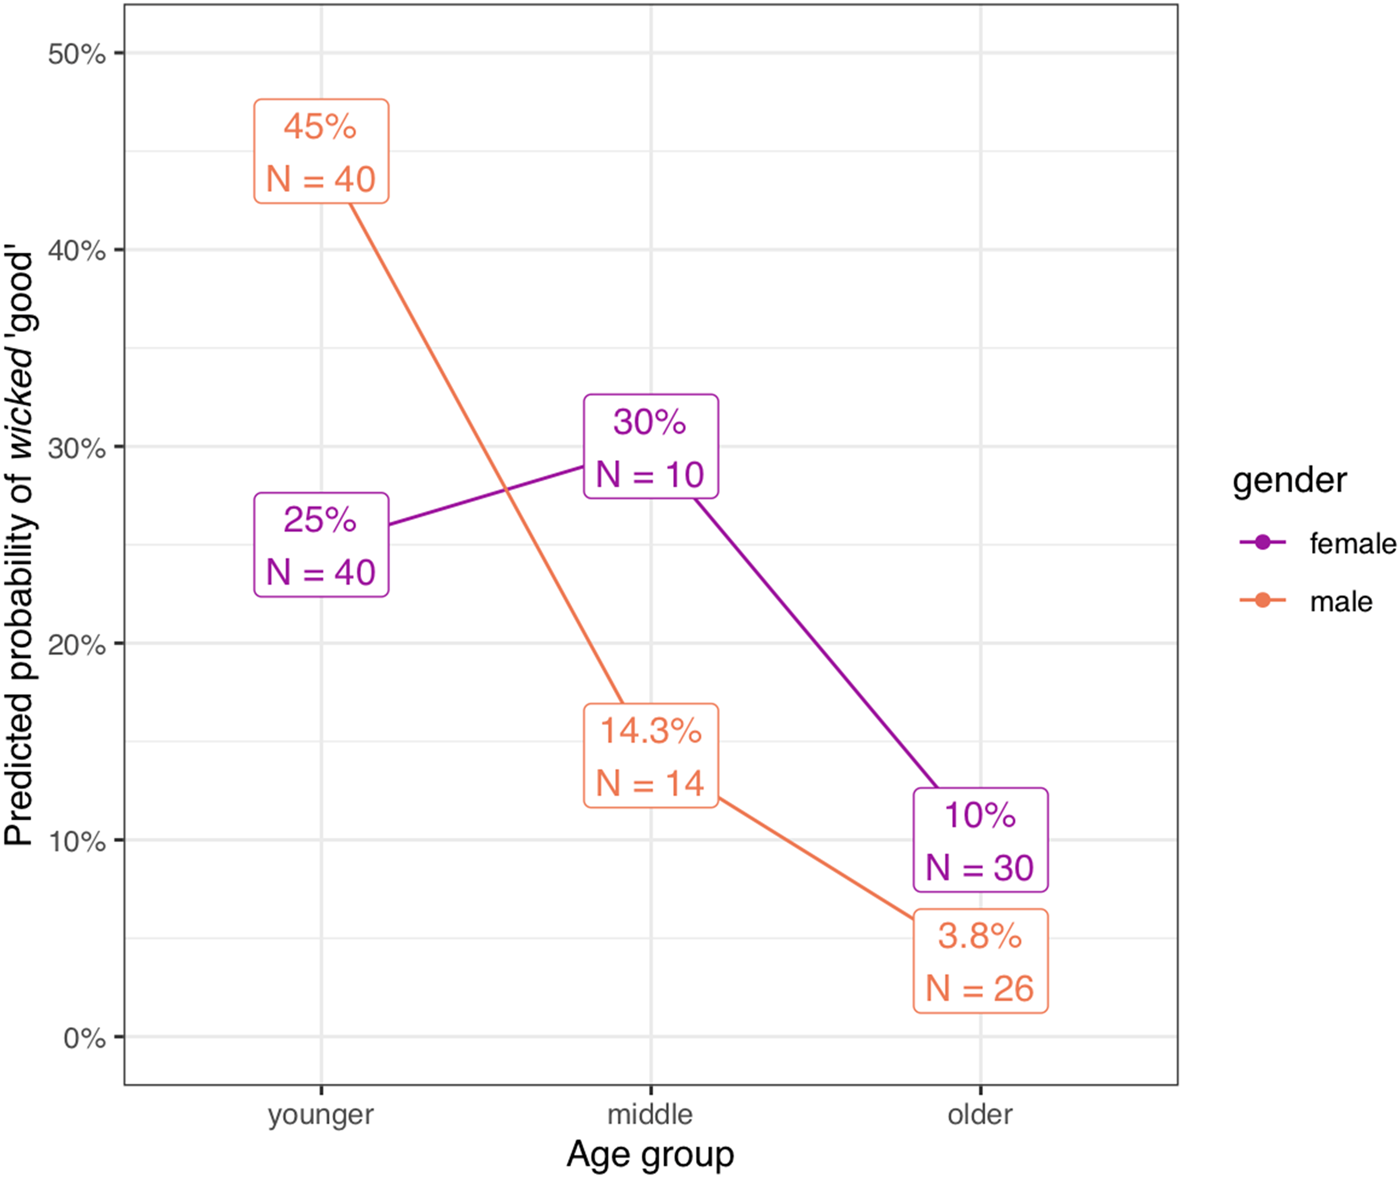
Adopting a ternary division of age (coding 50+ as ‘older’, 40s as ‘middle’ and 20s and below as ‘younger’) lends further insight into the nature of this cross-over pattern, although the results should be interpreted with a degree of caution given that token counts decrease as more fine-grained groupings of age are used. We find that the change among male speakers is purely monotonic, with wicked ‘good’ becoming increasingly favourable across generations: it is almost completely absent from the older male group (4 per cent, N = 1/26), rising to 14 per cent (N = 2/14) for the middle-aged male group, before culminating in a rate of 45 per cent usage (N = 18/40) among male speakers under the age of 30. However, the change towards wicked ‘good’ among female speakers actually peaks at an earlier stage and at a lower rate, with the most frequent users being women in their 40s (30 per cent, N = 3/10) before essentially plateauing for the very youngest female speakers (25 per cent, N = 10/40).
Mixed-effects logistic regression was carried out in R to establish the statistical significance of these effects. A model was fitted to all tokens of the dependent variable (N = 160), coding each observation as 1 if wicked ‘good’ was produced and as 0 if any other sense was produced; the model included a by-speaker random intercept to account for the fact that individual speakers produce multiple observations. Step-wise regression was used to identify the best-fitting set of independent variables as determined by the lowest Akaike Information Criterion (AIC), a commonly used method of quantifying the relative quality of a model balanced between its predictive power (the amount of variation in the data it explains) and its complexity (the number of predictors it includes). The best-fitting model is one that contains only the predictors of age and gender and their interaction, where the former is operationalised as a tripartite split between younger (< 30), middle-aged (40s) and older (50+) age groups to capture the curvilinear effect described above. The full table of coefficients is reported in table 1. Although the age×gender interaction does not quite reach the traditional threshold for statistical significance (p = 0.105), removing the interaction term leads to a slightly worse model, suggesting that it holds some explanatory power and that this effect would most likely be significant with a slightly larger sample size.
Coefficients table of the logistic regression model modelling use of wicked ‘good’. Intercept corresponds to middle-aged female speakers. More positive estimates correspond to increased likelihood of wicked ‘good’ use; more negative estimates correspond to decreased likelihood (AIC: 163.72)
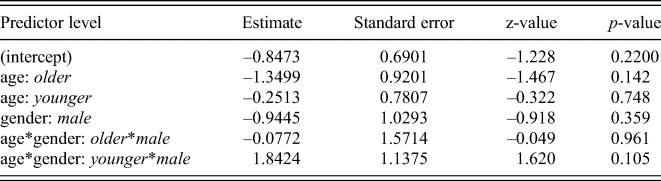
This cross-over trend, for women to have been leading the change towards wicked ‘good’ before an apparent plateau while men continue the incrementation of change, is shown clearly in the model prediction plot in figure 1. This result is also supported by the fact that when we operationalise the dependent variable slightly differently and fit a model to individual speakers, coding wicked ‘good’ users as 1 and those who do not use that sense of the word at all in the production study as 0, the age×gender interaction term is statistically significant (β = 2.82, p = 0.01).
Model prediction plot illustrating the interaction between age group and gender for the use of wicked ‘good’
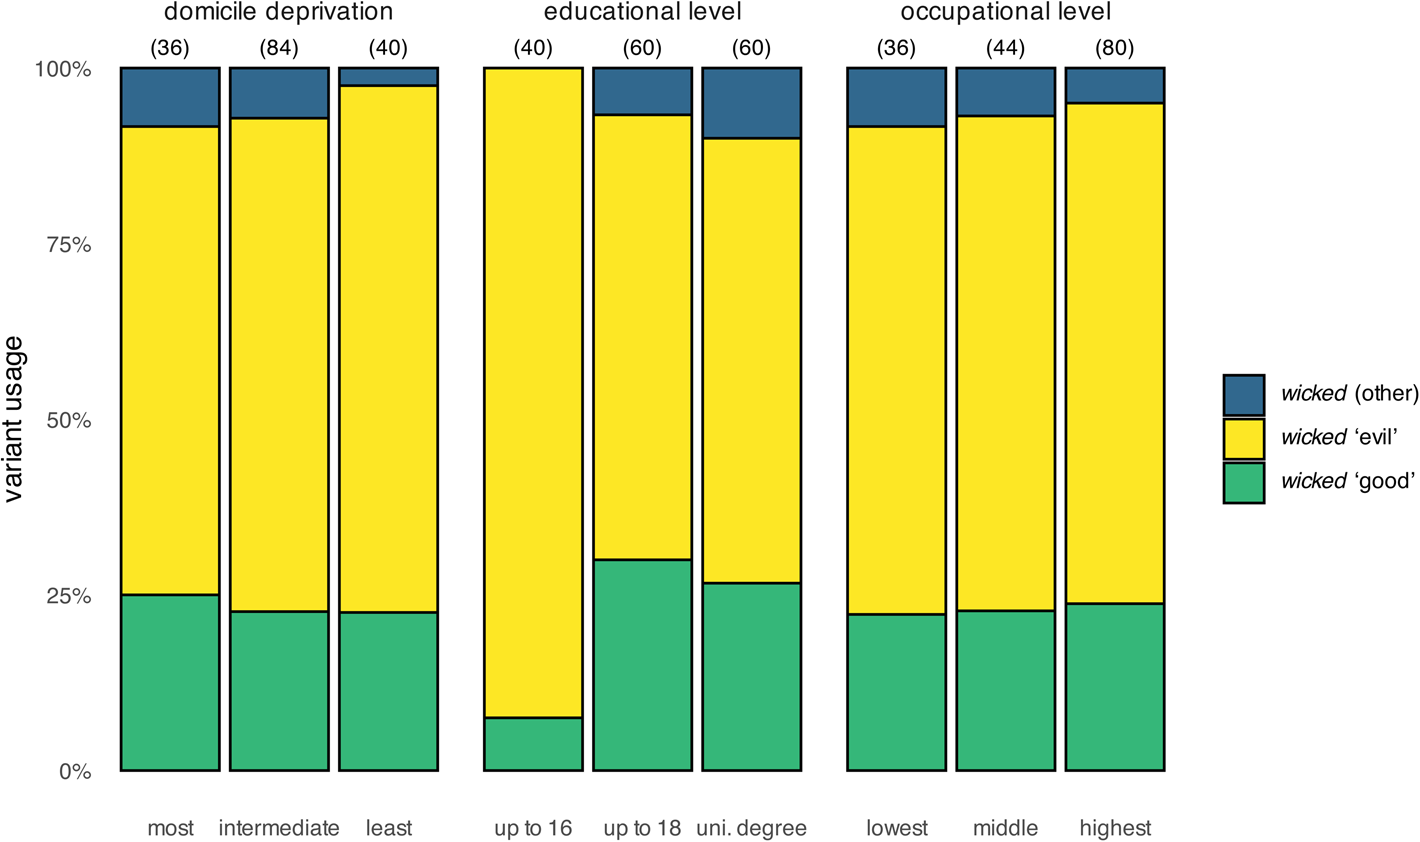
While there appear to be age and gender differences, the effect of social class is completely absent. No measure of social class is included in the best-fitting model, which is not surprising when one explores the data descriptively: figure 2 plots the distribution of wicked variants by the different factors measuring aspects of socioeconomic status (domicile deprivation, educational level and occupational level) and the results show no significant differences across the levels of these various factors. The only exception to this is the apparent decreased use of wicked ‘good’ among those with the lowest educational level, but it should be noted that this is highly collinear with age: all but one of these speakers are above the age of 40, so this is actually reflecting the strong effect of age outlined earlier.
The distribution of all wicked variants used by three measures of socioeconomic status: domicile deprivation, level of education, and level of occupation (total number of observations denoted in parentheses)
The results from our production study are remarkably similar to those of Robinson (p.c.) with the exception of the youngest group of females whose counterparts in Sheffield would have been too young to participate in the earlier study. This suggests that the sociolinguistic usage patterns discussed in this article are not particular to Cornwall but speak to a broader process of variation and change of wicked.
5 Study 2 – Matched-guise technique
To complement the usage-based study 1, we also conducted a study which explores the perception of the polysemous senses of wicked by employing the matched-guise technique (Lambert et al. Reference Lambert, Hodgson, Gardner and Fillenbaum1960; Campbell-Kibler Reference Campbell-Kibler2007). We presented participants with ‘social media posts’Footnote 12 and they were asked to evaluate the posts along a range of persona traits, such as ‘professional’ or ‘posh’ (see figure 3 for an example page from the online experiment). Each post had two versions, or ‘guises’, which are identical with the exception of one lexical item. We explored the social meanings of wicked in two different senses, ‘evil’ and ‘good’, which were contrasted with synonyms.Footnote 13 All participants saw the carrier phrase ‘I'm getting pretty decent at this baking thing, I just made some ___ cake mix this morning.’ While half saw the blank slot filled with wicked, the other half saw good. Similarly, for the carrier phrase ‘These people are inherently ___ and will do anything to stay in power’, half of the participants saw wicked for the blank slot while the other half saw evil. The carrier phrases were selected as they make it clear which sense is being employed. In the first example, positive affect is evident, making it clear that the ‘good’ sense is being employed, whereas in the second example, negative affect is clear, which makes it apparent that the ‘evil’ sense is being employed.
Example page from the online matched-guise experiment, showing the wicked ‘good’ stimulus
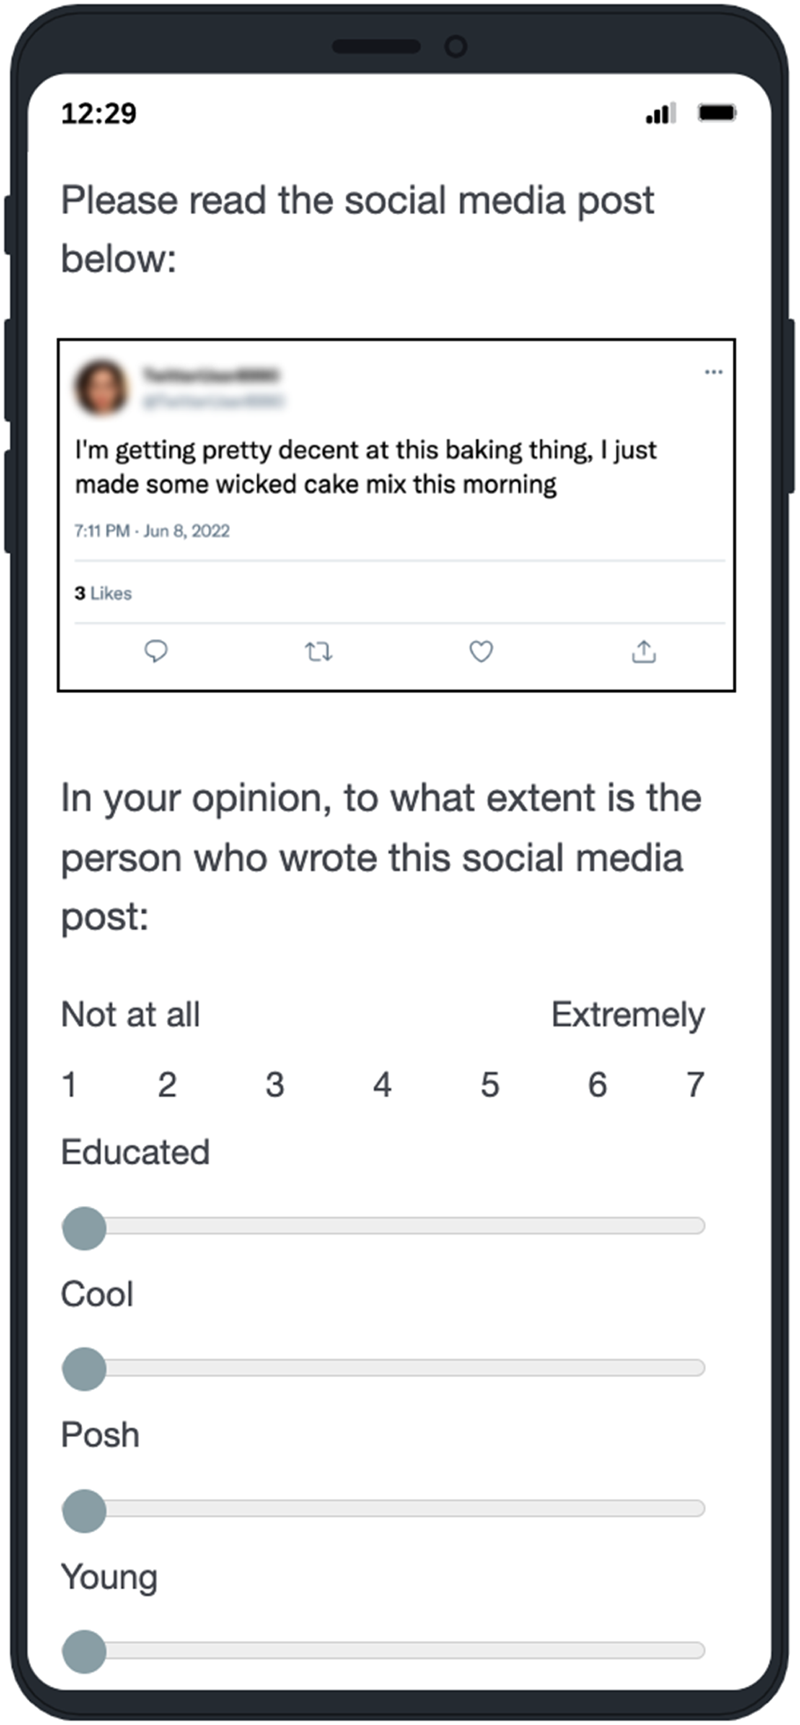
Spoken stimuli could lead to accent features becoming confounding variables (see also Buchstaller Reference Buchstaller2006). The written nature of the guises used in this study removes this possibility and enables us to isolate lexical differences across the guises.
Table 2 lists the persona traits that participants evaluated using the sliding scales illustrated in figure 3, which allowed whole-number ratings from 1 (low agreement) to 7 (high agreement). As well as the individual persona traits, for the purposes of our analysis we can additionally cluster these into traits that are broadly composite of ‘status’ and ‘solidarity’ (see also Brown Reference Brown1965; Luhman Reference Luhman1990; Dailey-O'Cain Reference Dailey-O'Cain2000; Ng & Diskin-Holdaway Reference Ng and Diskin-Holdaway2021). We consider ‘educated’, ‘posh’ and ‘formal’ as ‘status’ traits. Conversely, we consider ‘cool’, ‘friendly’, ‘honest’ and ‘attractive’ as ‘solidarity’ traits (see, for example, Beltrama Reference Beltrama, Castroviejo and McNally2018; Clark & Schleef Reference Clark and Schleef2010).
List of persona traits used in the matched-guise study

One hundred individuals from England took part in the study, which was administered through Prolific. Information was collected regarding the age, gender and occupational type of each respondent. The sociodemographic composition of the 100-participant sample is displayed in table 3. Participants were asked to self-identify their gender, age, occupation and the region of England in which they were born and raised. In terms of occupation, participants were asked to state if their work was best categorised as ‘higher managerial and professional’ (1), ‘intermediate’ (2), ‘“white-collar” and lower managerial or clerical’ (3), ‘ “blue-collar” lower supervisory and technical’ (4) or ‘semi-routine or routine’ (5). We employed a between-subjects design, with each of the four variants being rated by a total of 50 participants. A control stimulus was seen by all participants. This served to ensure that there were no differences in how the four groups of participants responded to the same stimuli. Indeed, there were no statistically significant effects for this guise. Thus, any differences in the perceptions between the stimuli can be attributed to the differences in social meaning between the synonyms.
The sociodemographic composition of the 100-participant sample, by gender, age, occupational category and region

5.1 Results
The overall results from the perception task are presented in figure 4, plotted separately for the two pairs of guises (wicked ‘good’ vs good and wicked ‘evil’ vs evil), aggregated across all listeners and split by each of the eight descriptive scales. Although the differences between guises are generally quite small, there are a number of interesting trends observable in the data. Wicked ‘good’ was evaluated as indexical of the solidarity trait ‘cool’, while it scored comparatively lower in the status characteristic of ‘formality’. On the other hand, wicked ‘evil’ was evaluated more positively on status-related dimensions, particularly ‘educated’ and ‘formal’, as opposed to its synonym evil. An interesting result emerges on the ‘young’ descriptive scale: both positive and negative senses of wicked are seen as less ‘young’ than their respective synonyms, suggesting that it may be the form wicked that is perceived as less young, rather than any particular sense.
Perceptions of wicked ‘good’ vs good (top) and wicked ‘evil’ vs evil (bottom); 1 = not at all, 7 = very much so. Diamonds/circles correspond to mean rating for that particular variant–scale pair

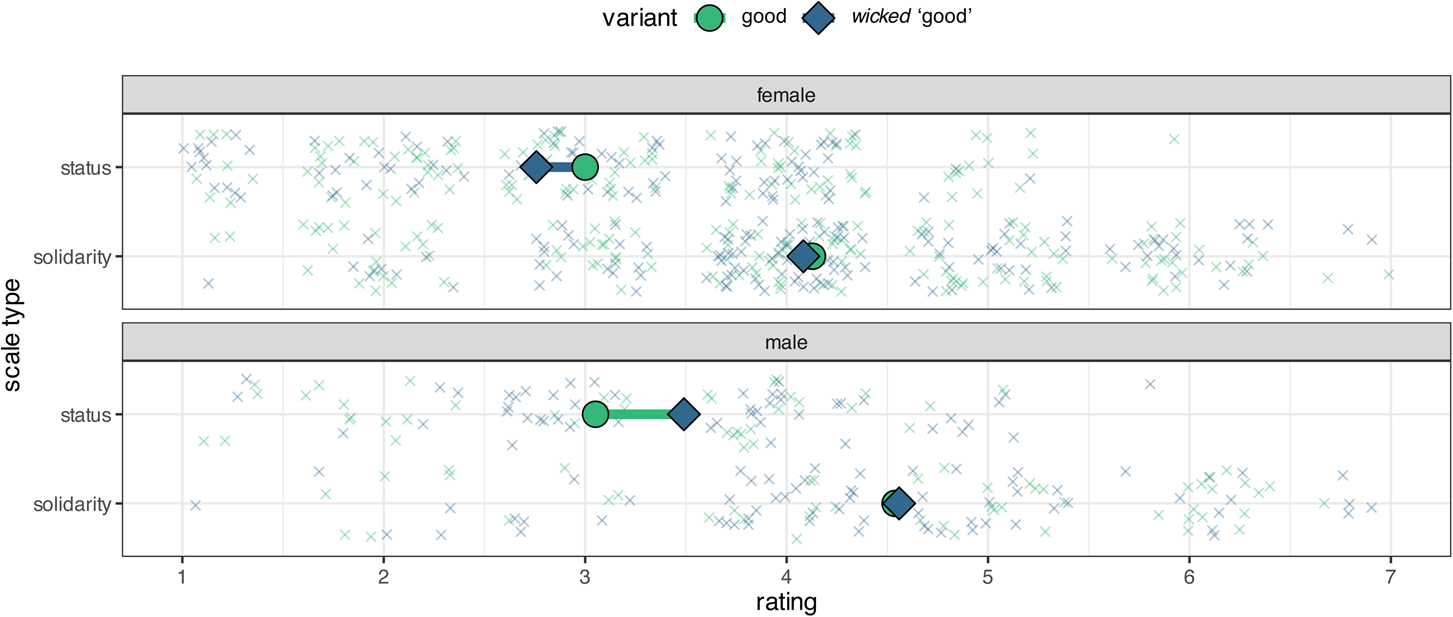
We can gain further insight into the perception of wicked by considering how the evaluative responses might interact with the gender or age of the listener. In figure 5 we combine the individual evaluative scales into broader status/solidarity dimensions and plot the perception of wicked ‘good’ by gender. It shows that while females penalise this use of wicked along status dimensions, males do not. In fact, males perceive wicked ‘good’ to be slightly more statusful than good.
Perceptions of wicked ‘good’ vs good split by listener gender; 1 = not at all, 7 = very much so. Diamonds/circles correspond to mean rating for that particular variant–scale pair
To establish the statistical significance of these results, the data were modelled using cumulative link mixed models (CLMM), which are more appropriate than linear regression models in this case of ordinal data where the perceptual distances between points on the scale may vary across the scale and between listeners. A model was initially fitted to the response data including an interaction between variant (e.g. wicked ‘good’ vs good) and scale, and a random intercept of listener.
To diagnose significant differences between evaluations of the variants on individual descriptive scales, pairwise comparisons were conducted by comparing estimated marginal means using the emmeans package in R (Lenth Reference Lenth2021). The results reveal no significant differences between the perception of wicked ‘good’ and good when we model all listeners together. However, significant differences do emerge between wicked ‘evil’ and its synonym evil, with the former indexing status significantly more than the latter (β = 0.635, p = 0.036); when investigating this in a finer-grained manner looking at the individual descriptive scales, it seems this effect is driven primarily by the ‘educated’ trait (β = 1.228, p = 0.006), although the formal scale also nears significance (β = 0.860, p = 0.063). Wicked ‘evil’ is also seen as significantly more ‘honest’ than evil (β = 1.063, p = 0.022), but no other significant indexicalities are found.Footnote 14
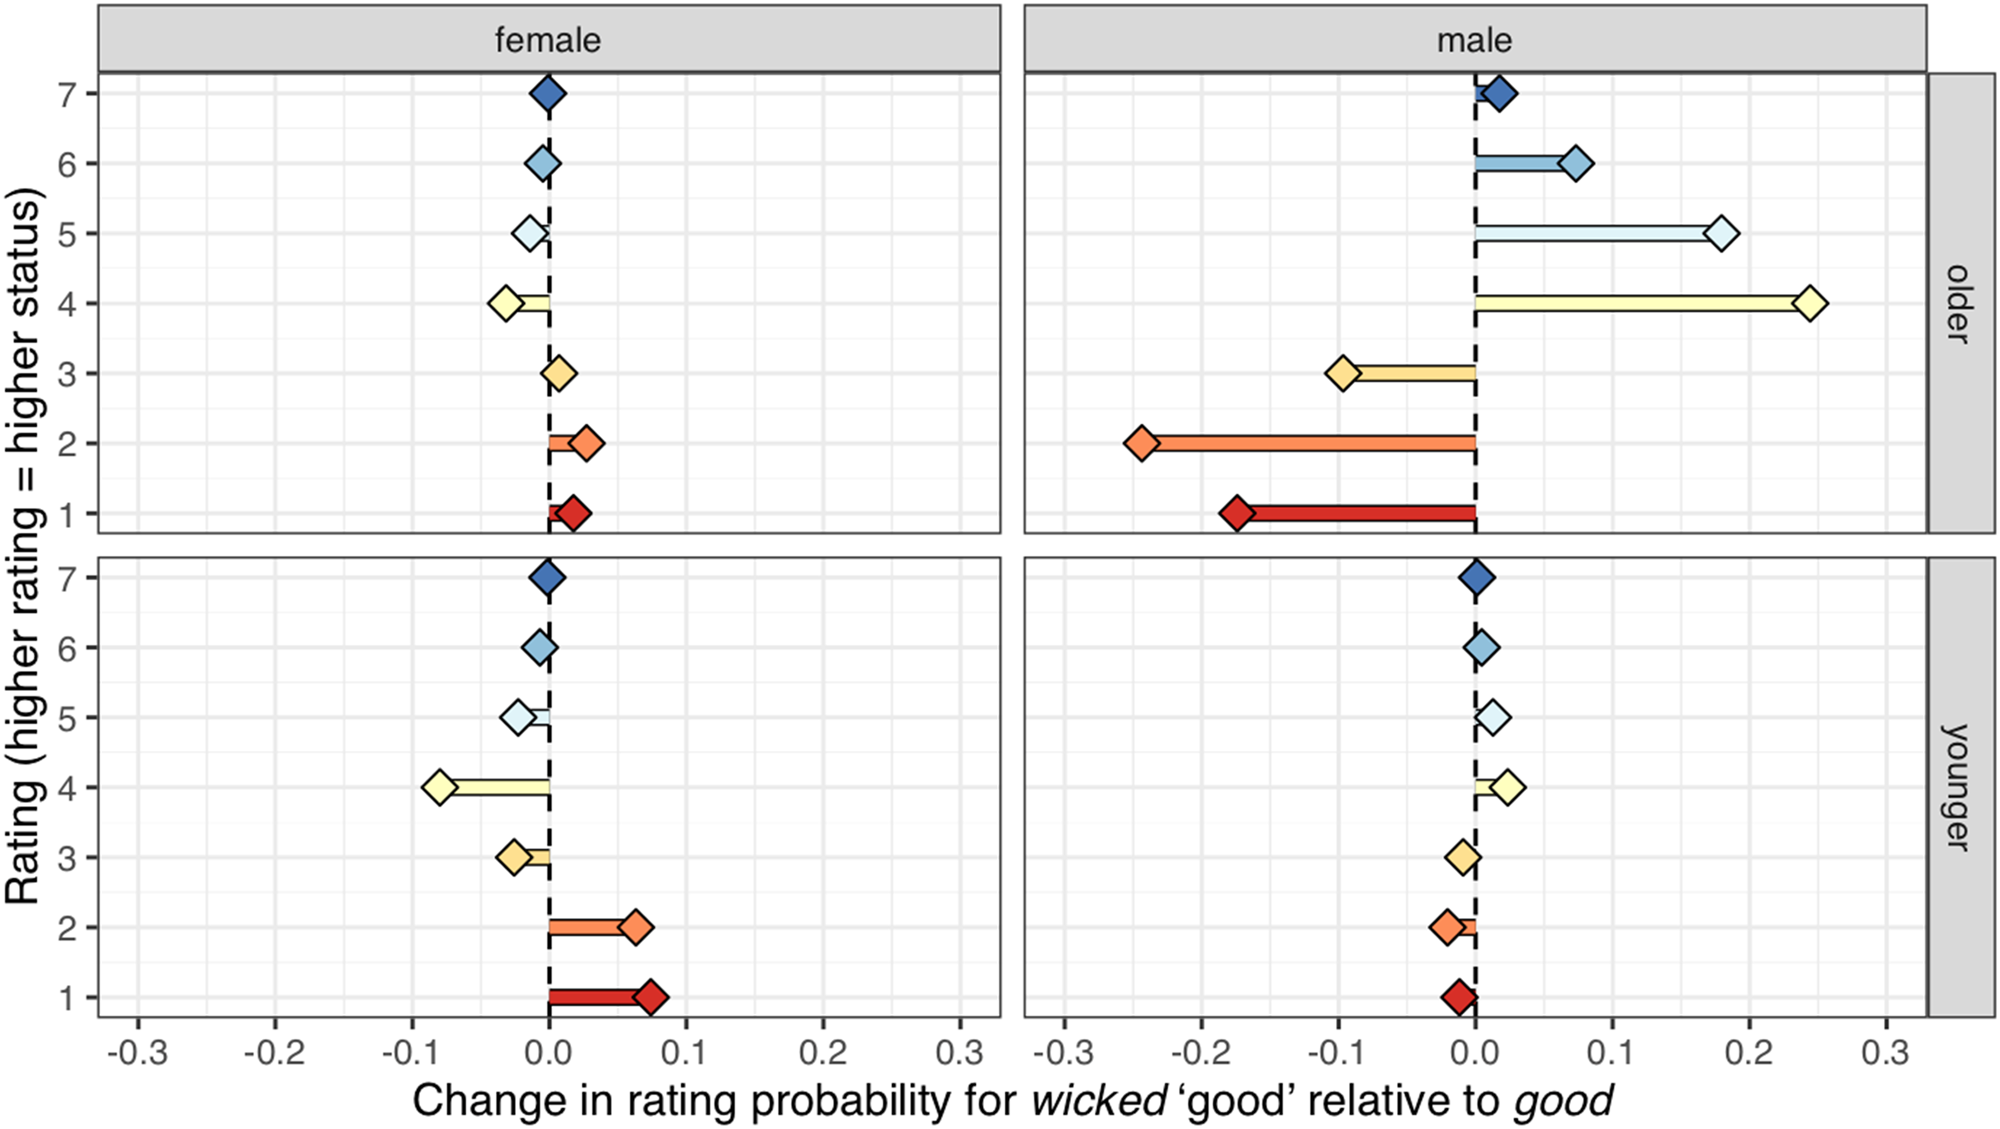
More differences emerge when we consider how these perceptions might interact with the gender and age of the listener, and these largely parallel the gendered differences in production found in study 1 as discussed earlier. A second CLMM was fitted to the data, this time with a four-way interaction between variant, scale type (status vs solidarity traits), and listener age group (younger [<40] vs older [40+]) and gender (male vs female). Significant differences emerge for the older male group, who rate wicked ‘good’ as significantly higher than good on measures of both status (β = 2.282, p = 0.033) and solidarity (β = 3.319, p < 0.001). This is visualised in figures 5–6, which plot the predicted values from the regression model and visualise the probability of each rating on the 1–7 scale as a function of variant; positive values represent an increased likelihood of wicked ‘good’, rather than good, receiving that rating, whereas negative values for a rating represent a decreased likelihood of that rating being given to wicked ‘good’. Figure 6 clearly shows that this status-oriented social meaning is only present for the older male respondents, with wicked ‘good’ significantly more likely to receive mid-to-high ratings (particularly 4–5) and less likely to receive the lower ratings (particularly 1–2). Figure 7 plots the same information for the solidarity scales, and shows a broadly similar pattern: older respondents evaluate wicked ‘good’ more positively than good with a higher probability of ratings 5–7 and lower probability of ratings 1–4, but this is strongest (and only reaches statistical significance) among older males specifically.
Predicted CLMM rating probabilities on the ‘status’ scales; positive values indicate higher rating for wicked ‘good’, negative values indicate higher rating for good
Predicted CLMM rating probabilities on the ‘solidarity’ scales; positive values indicate higher rating for wicked ‘good’, negative values indicate higher rating for good

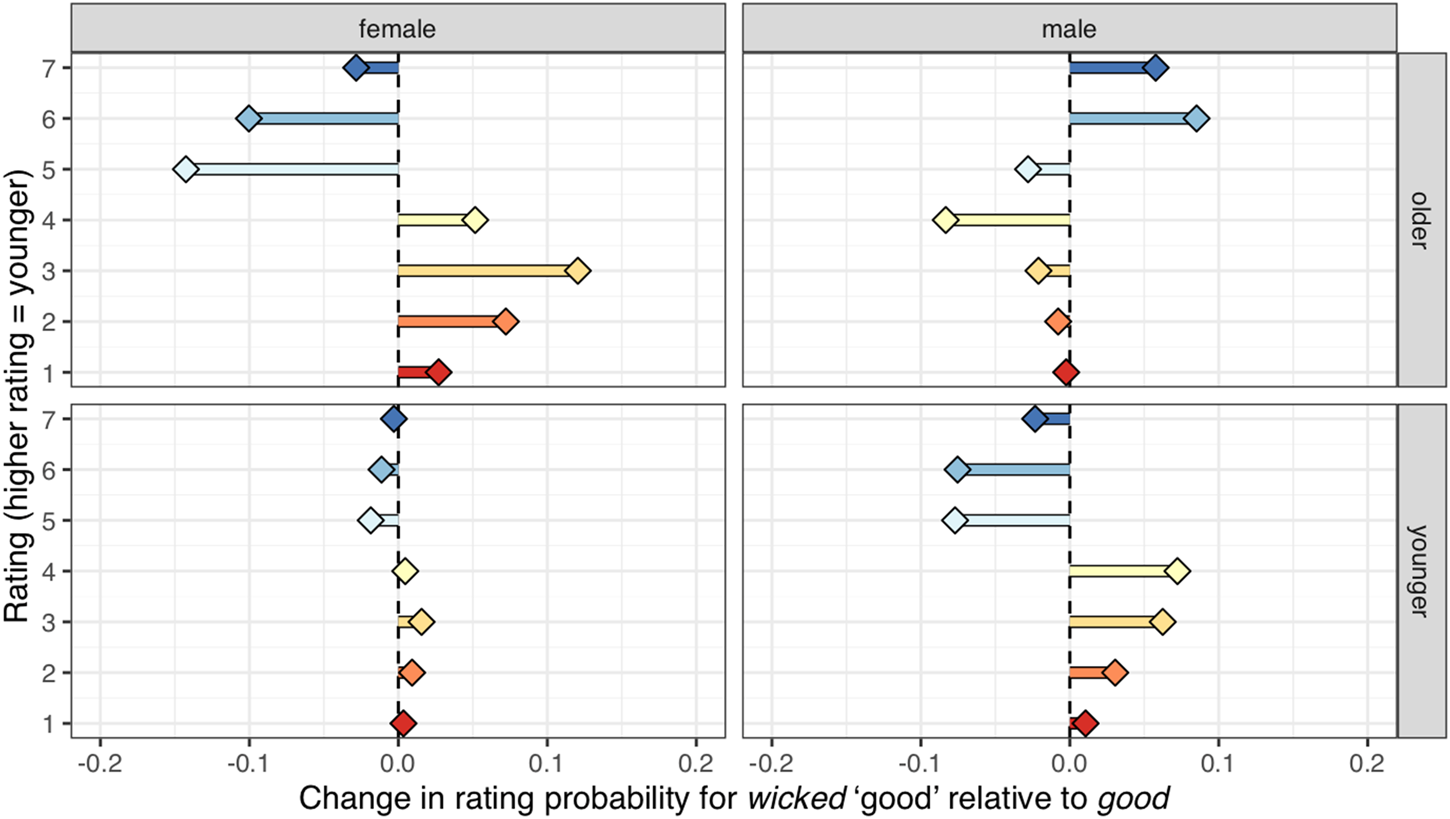
The focus of these results has thus far been on the status and solidarity ratings, but listeners were also asked to rate the guises based on how young they perceive the author to be. The model estimates for this scale are visualised in figure 8 in the same way those for status and solidarity were presented earlier. No significant differences emerged between how wicked ‘good’ and its synonym good were rated on the ‘young’ scale, although the most common trend in the data sees wicked ‘good’ being perceived as less young than good (β = 1.223, p = 0.156 for older women; β = 0.720, p = 0.425 for younger men). Curiously, the older male respondents are the only ones for whom the non-significant trend patterns in the opposite direction, with wicked ‘good’ possibly perceived as younger (β = 0.594, p = 0.694), and were also the only social group to perceive it significantly more positively on the status and solidarity scales.
Predicted CLMM rating probabilities on the ‘young’ scale; positive values indicate higher rating for wicked ‘good’, negative values indicate higher rating for good
6 Discussion
Interpreting the results of study 1 in the context of Robinson's (p.c.) findings, which showed a female-led change towards wicked ‘good’ in 2005–6, we too find that this change is most advanced in women, with the exception of the youngest group (see figure 1). It is the males in the youngest group who are most advanced in their usage of wicked ‘good’. One possible interpretation of this pattern is that young women are leading a shift away from this positive usage of wicked, or at the very least have stopped its incrementation in a way that is not at all evident for young men, who have continued to increasingly use wicked ‘good’. This interpretation is consistent with Labov's (Reference Labov1990, Reference Labov2001) principles of language change, with women leading in the initial change but also being at the forefront of this more recent shift away from it. It is worth noting that wicked ‘evil’ is typically seen to hold a higher degree of prestige than wicked ‘good’, as indicated by its status-type indices in study 2 and metalinguistic commentaries from Robinson (Reference Robinson2010a: 210).
The elicited data may show an incipient retrograde change at the level of the community, with young women shifting away from the newer sense. Citing evidence from her panel study conducted in 2015–16, Robinson (p.c.) also provides some evidence of retrograde change at the level of the individual, with participant metalinguistic commentary reflecting on their adoption and subsequent shedding of wicked ‘good’. This pattern is not age-grading proper, which refers to a cyclical process of community stability and individual instability (Chambers Reference Chambers2003; Boberg Reference Boberg2004; Sankoff & Blondeau Reference Sankoff and Blondeau2007; Buchstaller Reference Buchstaller2015). The data do not seem to indicate community-wide stability here, but change across apparent-time. Thus, it is possible that the observed variation and change of wicked ‘good’ is indicative of retrograde lifespan change (see Wagner Reference Wagner2012; Sankoff Reference Sankoff2019), with change at the community and individual levels coalescing around the loss of wicked ‘good’. However, further longitudinal analysis would be required to verify this interpretation.
The findings of study 2 account, to a large extent, for the usage patterns in study 1. Given that young men are the most frequent users of wicked ‘good’ it is unsurprising that males evaluate this sense more positively than its synonym evil, in both status and solidarity attributes. Conversely, the sense favoured most by young women, wicked ‘evil’, is rated positively for status-type characteristics. The age pattern in our usage data, which suggests a nascent change away from wicked ‘good’ towards the older sense wicked ‘evil’, is consistent with the trend in the perception data, albeit not statistically significant, that wicked ‘good’ is not perceived as young. This provides an interesting parallel to the observation that young women are not participating in the incrementation of the change towards wicked ‘good’ in the same way that women in older generations did, relative to their male counterparts. It is perhaps not surprising that the demographic group who rate wicked ‘good’ as the least young are the older women, who have been around long enough to observe both the original semantic change towards its positive sense and this more recent, female-driven lack of incrementation of it; that is, they are the most acutely aware of the zeitgeist-esque nature of the change and its relatively short-lived popularity in usage, and are therefore the least likely to associate the use of this sense with a youthful style of speech.Footnote 15
The results presented here are testament to the vigorous, yet socially mediated, nature of lexical change. As lexis is less constrained by the critical period, it can react to perceptual changes more dynamically than more structural features such as phonetics, phonology and morphosyntax. The case study of wicked demonstrates the speed and dynamism of lexical change, shifting to and then, slightly away from wicked ‘good’. These results, specifically the parallels between patterns of variation in production and perception, also speak to the mechanisms of lexical change which can complement ongoing research into the role of social meaning and indexicality that has previously taken place primarily in relation to sound change (see Eckert & Labov Reference Eckert and Labov2017; Bermúdez-Otero Reference Bermúdez-Otero2020; Hall-Lew et al. Reference Hall-Lew, Cardoso, Davies, Hall-Lew and Moore2021). Although it is not possible to draw a direct causal link between them, the indexical field of wicked – for both its ‘good’ and ‘evil’ senses – does provide a possible explanation for the changes we observe in production. The role of social meaning in driving forward the incrementation of language change has been called into question in cases of sound change specifically (see e.g. Bailey Reference Bailey2019, and Bermúdez-Otero Reference Bermúdez-Otero2020 for a more general discussion of these issues), but it is possible that such causal relationships are more likely in the case of lexical/semantic changes for the reasons discussed above.
It is important to acknowledge a number of limitations of the studies presented in this article and the subsequent discussion. Firstly, while we compare the results from study 1 with Robinson's (Reference Robinson2010a) earlier data, it is important to highlight that the localities in which the data were collected have non-trivial differences. While Robinson's data were collected in Sheffield, South Yorkshire, an urban post-industrial city, our study 1 was conducted in the (also post-industrial) Cornish towns of Camborne and Redruth. Although Camborne–Redruth is urban by Cornish standards, it is far less urban than Sheffield. Thus, the nature of social network structures may differ between the communities, which could account for some degree of the variation between the two studies. Additionally, a key limitation of the matched-guise study is that each sense was tested in one context only. More robust conclusions could be drawn from a study which contrasts a polysemous adjective with synonyms in multiple carrier phrases, ranging in terms of conceptual domains, e.g. wicked vs good/evil in the context of food, sport, weather etc. Similarly, all of the guises were presented as ‘social media posts’. Further research may determine whether this context reduces the distinctions in social meanings between variants when compared with other contexts, such as formal writing.
A further limitation in both studies is the relatively small data sets. While 80 participants in a variationist study (such as study 1) is relatively large, they each produced two variants of the investigated variables, which is much lower than is typically the case for variables at other levels of the grammar. In study 2, 100 participants is a relatively small number for a matched-guise study. This means that our results do not have a great deal of statistical power, and that larger data sets would therefore be needed to diagnose differences of this effect size at the conventional threshold for significance.
To conclude, in this article we have showcased the value of considering both production and perception data in order to understand processes of semantic change, using wicked as a case study. We have adopted Robinson's (Reference Robinson2010a: 275) definition of a semantic variable, that is, ‘saying different things in the same way’ and demonstrated the socially mediated trajectory of semantic change. Specifically, we have shown that young women are no longer incrementing the change towards wicked ‘good’ and may be participating in an incipient change back towards the more traditional sense wicked ‘evil’. This finding speaks to a broader point about the utility of sociolinguistic theory. While Labov (Reference Labov1990, Reference Labov2001) did not primarily have lexis in mind when discussing gender effects in sociolinguistic variation and change, we have demonstrated their applicability to the polysemous adjective wicked. We have also highlighted the potential to elicit rich information regarding the social meaning of lexical items through modified matched-guise stimuli, which in this case enables us to interpret usage data in the context of indexical meanings. Synthesising the usage and perception data in this study has enabled us to develop a more thorough understanding of the process of semantic change than would be possible by studying production or perception in isolation. Ultimately, this article makes a contribution to the growing yet still limited literature which explores semantic variation through a variationist sociolinguistic lens and, more particularly, considers the role of social meaning in semantic change.


 Open access