


Introduction
Cattle have long been of central importance to Irish societies (Lucas Reference Lucas1989; Kelly Reference Kelly1997: 28–29), yet we have limited evidence for how these livestock were managed prior to the medieval period (McCormick Reference McCormick, Murphy and Whitehouse2007; see Table 1). Cattle were introduced to Ireland by at least 3800–3700 BC (Woodman Reference Woodman, O'Connell, Kelly and McAdam2016; Smyth et al. Reference Smyth, McClatchie, Warren, Gron, Sørensen and Rowley-Conwy2020) but, with a few exceptions (McCormick & Murray Reference McCormick and Murray2007; Pigière et al. Reference Pigière, McCormick, Olet, Moore, O'Carroll and Smyth2022), the lack of large prehistoric assemblages has limited detailed zooarchaeological analyses (McCormick Reference McCormick, Murphy and Whitehouse2007; McClatchie et al. Reference McClatchie, Schulting, McLaughlin, Colledge, Bogaard, Barratt and Whitehouse2022; Pigière et al. Reference Pigière, McCormick, Olet, Moore, O'Carroll and Smyth2022). Despite a relative dearth of faunal remains, molecular evidence for prehistoric dairying (Smyth & Evershed Reference Smyth and Evershed2015, Reference Smyth and Evershed2016) and excavations revealing ritual deposition of cattle (e.g. Eogan & Cleary Reference Eogan and Cleary2017; Pigière et al. Reference Pigière, McCormick, Olet, Moore, O'Carroll and Smyth2022) clearly indicate that these animals played important economic and symbolic roles as early as the Neolithic. The earliest documentary sources of the early medieval period show that cattle had assumed a primary position in trade/exchange and other economic activities (Lucas Reference Lucas1989; Kelly Reference Kelly1997; McCormick Reference McCormick2008). Not only were they considered a unit of currency and wealth transfer, they also became integral to a variety of aspects of Irish society (Lucas Reference Lucas1989: 223–24; Kelly Reference Kelly1997: 57–66). Given this importance, humans may have transformed the Irish landscape, developing open pasturelands to accommodate a ‘cattle-centric’ world view (McCormick Reference McCormick2008). Based on documentary and archaeological evidence, this system of economy and land organisation persisted until late in the early medieval or into the later medieval period when arable cultivation and more diversified livestock regimes grew in importance (McCormick & Murray Reference McCormick and Murray2007; McCormick Reference McCormick2008; Kerr Reference Kerr2009; McClatchie et al. Reference McClatchie, McCormick, Kerr and O'Sullivan2015, Reference McClatchie, McCormick, Kerr, O'Sullivan, Comeau and Seaman2019).
Approximate calendar dates for time periods in Ireland.

In this context, cattle are thought to have played a crucial role in major shifts in Irish society (McCormick Reference McCormick2008; McCormick et al. Reference McCormick, Kerr, McClatchie and O'Sullivan2011). Documentary records show that Ireland's intensive focus on cattle in the early medieval period was not orientated towards beef or leather production, but rather driven primarily by dairy production (Kelly Reference Kelly1997). McCormick (Reference McCormick2008) argues that by privileging these secondary products, Ireland's economy, compared with other areas of Europe, was fundamentally limited by the availability of pasture and the relatively perishable nature of dairy produce; in contrast, as arable crops such as grain can be stored for years, they provide a more stable basis for silver-based commerce. Consequently, McCormick argues, it was only by pursuing a fundamental restructuring of land resources, including the conversion of cattle pastures for grain cultivation, that Irish elites could accumulate more wealth (McCormick Reference McCormick2008; McCormick et al. Reference McCormick, Kerr, McClatchie and O'Sullivan2011).
In this article, we use isotope analyses of Irish zooarchaeological material dating from the Neolithic through to the post-medieval periods to document changes in cattle diet and husbandry (Figure 1). We find evidence for broad variation in the ways that cattle were husbanded during the Neolithic and Bronze Age, including the use of both densely wooded and open pasturelands. The results for the early medieval period are consistent with, and support, the documentary and wider archaeological evidence showing a strong economic focus on cattle. In turn, this emphasis on cattle gave way to arable farming and a greater variety of livestock systems in later periods (McCormick & Murray Reference McCormick and Murray2007; McCormick Reference McCormick2008; McClatchie et al. Reference McClatchie, McCormick, Kerr and O'Sullivan2015, Reference McClatchie, McCormick, Kerr, O'Sullivan, Comeau and Seaman2019). Further, our findings suggest that the socio-economic centrality of cattle in Irish society, evident from the early medieval written accounts, may long predate these historical sources, beginning in the Iron Age or earlier.
Map showing the locations of sites included in the study. Numbers correspond to sites and time periods in Tables S1 and S2. Sites: 1 Whitepark Bay; 2 Tamnyrankin; 3 Dun Ruadh; 4 Newtownstewart; 5 Legland; 6 Ballyhanna; 7 Aghanaglack; 8 Navan Fort; 9 King's Stables; 10 Haughey's Fort; 11 Audleystown; 12 Greencastle; 13 Harristown; 14 Nobber; 15 Lowpark; 16 Newgrange; 17 Stalleen; 18 Trim Townparks South; 19 Williamstown/Bawn 2; 20 Clowanstown; 21 Ratoath; 22 Ardbraccan 1; 23 Navan Inner Relief Road 1 3; 24 Bective Abbey; 25 Blackfriary; 26 Market St. Trim; 27 Killeen Castle Site A; 28 Knocks 1; 29 Mountgorry; 30 Timberyard; 31 Dalkey Island; 32 Carrickmines Great; 33 Castletown; 34 Eyre Square; 35 Poulnabrone; 36 Roughan Hill; 37 CL153; 38 Ross Island; 39 Kilgreany Cave; 40 Chancellorsland; 41 Lough Gur; 42 Tullahedy; 43 Camlin 1; 44 Mallin St. Wexford; 45 Clohamon; 46 Ballynagran; 47 Dun Ailinne; 48 Grey Abbey; 49 Ballyshaneduff; 50 Morett (figure by authors).

Isotope analyses and cattle husbandry
The carbon (δ 13C) and nitrogen (δ 15N) isotope compositions of animal bone reflect a long-term, averaged perspective shaped by the foods consumed during the animal's life; for livestock such as cattle, these isotopic compositions can shed light on husbandry practices. Differences in δ 13C among Irish terrestrial herbivores arise primarily from factors that influence isotopic variation in C3 plants. These factors include rainfall levels and the ‘canopy effect’ (Farquhar et al. Reference Farquhar, Ehleringer and Hubick1989; Stewart et al. Reference Stewart, Turnbull, Schmidt and Erskine1995; Bonafini et al. Reference Bonafini, Pellegrini, Ditchfield and Pollard2013). Pasture landscapes can range from dense, closed canopy woodland, through wood pasture with clearings where sunlight can reach the ground, to grassland with few or no trees and bushes present (Rackham Reference Rackham1987: 64, 328). The ‘canopy effect’ refers to the observation that herbivores feeding near ground level in closed woodland areas have lower δ 13C values compared with those animals feeding in open pasturelands or wood pasture (Bonafini et al. Reference Bonafini, Pellegrini, Ditchfield and Pollard2013). Of the various factors that can influence herbivore isotope compositions (see online supplementary material (OSM)), and consistent with current knowledge about variation in Ireland's landscape, climate and animal husbandry (e.g. Kelly Reference Kelly1997; McCormick Reference McCormick, Murphy and Whitehouse2007; Swindles et al. Reference Swindles2013; McClung & Plunkett Reference McClung and Plunkett2020), we expect that the canopy effect will explain much of the variation in cattle δ 13C. Cattle with δ 13C values at the higher and lower ends of the spectrum will therefore be interpreted as having had a greater emphasis on grazing in open pasture and in closed woodland areas, respectively. Successive trophic levels are characterised by stepwise increases in δ 15N (DeNiro & Epstein Reference DeNiro and Epstein1981). While our analyses focus only on herbivores (i.e. animals of the same trophic level), unweaned animals such as suckling calves will demonstrate 15N enrichment due to the consumption of milk that is one trophic level above that of their mothers' foods. The δ 15N of plants, and their consumers, are also influenced by a range of anthropogenic and natural processes (Szpak Reference Szpak2014). These and other sources of isotopic baseline variation must be carefully considered when interpreting isotopic compositions of Irish archaeological fauna (Guiry et al. Reference Guiry, Beglane, Szpak, Schulting, McCormick and Richards2018).
Hypotheses, questions and methods
Informed by the archaeological, documentary and isotopic contexts introduced in the previous section, we investigate the extent to which cattle husbandry practices vary through time, in order to evaluate three hypotheses:
1. During prehistoric periods, where the limited archaeological data suggest that cattle were not always the most abundant domesticate (McCormick Reference McCormick, Murphy and Whitehouse2007: 21–31; McCormick & Murray Reference McCormick and Murray2007: 104–106; McClatchie et al. Reference McClatchie, Schulting, McLaughlin, Colledge, Bogaard, Barratt and Whitehouse2022), cattle should have a wide range of δ 13C values reflecting husbandry in a variety of suitable environments, before the development of extensive areas of open pastureland.
2. Based on the early medieval documentary sources which suggest that cattle were preferentially grazed in pastures rather than woodlands (Kelly Reference Kelly1997: 42–8), cattle should have higher δ 13C values reflecting husbandry in open environments.
3. During the later medieval and post-medieval periods, when Irish agriculture is thought to have become more focused on arable farming (McCormick Reference McCormick2008; McClatchie et al. Reference McClatchie, McCormick, Kerr and O'Sullivan2015, Reference McClatchie, McCormick, Kerr, O'Sullivan, Comeau and Seaman2019), cattle should show a wider range of isotope variation, reflecting the restriction of grazing to more difficult-to-access overgrown land contributing some lower δ 13C values, and/or previously under-utilised lands contributing some lower δ 15N values.
In addition to testing hypotheses structured around existing documentary and archaeological evidence, we use these isotope data to explore other aspects of prehistoric cattle husbandry. For instance, can we trace antecedents of the early medieval approaches to cattle husbandry during earlier times? If cattle husbandry in open pastureland is a staple of the early medieval period, at what point in time was this relationship established? Do differences occur that are connected with socio-economic indicators such as royal-site status? And, finally, what patterns (e.g. among regions, time periods and kinds of sites) can we discern with respect to cattle husbandry among early prehistoric farmers?
This final aspect of how we query the data covers topics that fall under hypothesis 1; there are, however, some aspects of the prehistoric component of this dataset that could be further interpreted but which are beyond the scope of this article.
To address these hypotheses and questions, we analysed 450 samples of cattle bones and teeth from 50 archaeological sites across Ireland, dating from the Neolithic to the post-medieval period (Figure 1; Table S1; see Table S2 for δ 15N data for 235 samples previously published in Guiry et al. Reference Guiry, Beglane, Szpak, Schulting, McCormick and Richards2018). Data from 23 additional samples were compiled from the published literature (Table S2). We established chronological parameters based on information from radiocarbon dates and details of archaeological contexts using publications, unpublished site reports and personal communications with excavators. At Newgrange, uncertainty about the contemporaneity of some faunal deposits prompted us to submit three samples for radiocarbon dating (Table S3). Isotope analyses followed established protocols (Tables S4–S7). Given the nature of the hypotheses, comparison of group means does not provide a suitable statistical approach to the evaluation of patterns. Instead, we focus on changes in δ 13C variation, which provides a more sensitive measure of diversity in husbandry practices. Because our dataset includes cattle of all ages, statistical comparisons for δ 15N were not undertaken due to the potentially confounding influence of milk consumption by suckling calves. Statistical tests are performed using R (see OSM: Methods for stable isotope analyses and radiocarbon dating; R Core Team 2021).
Results
Data summary and quality control
Eighty-four per cent of samples (360 of 427 from this study, plus an additional 22 of 23 drawn from the literature) produced acceptable quality control metrics (Table S2), including satisfying conservative C:N criteria designed to ensure minimal alteration of δ 13C (< –0.5‰; Guiry & Szpak Reference Guiry and Szpak2021). The dates of the cattle samples from Newgrange are consistent with existing terminal Neolithic-Early Bronze Age dates for this site (Table S3). For full statistical results, see Table S8.
Data trends
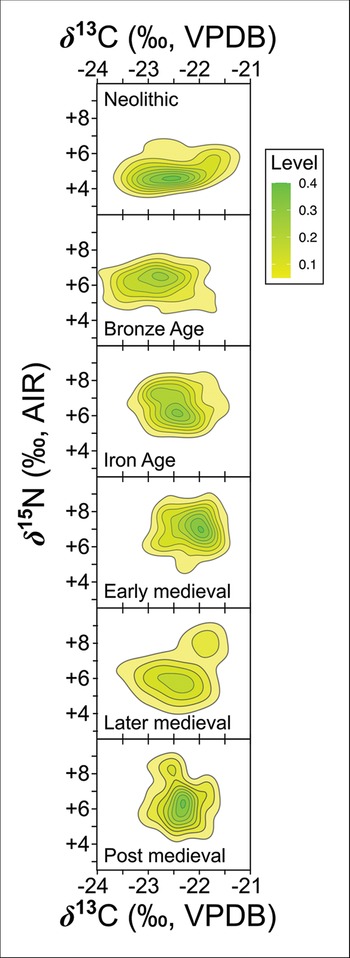
For a single herbivorous species in a C3-dominated interpretative context, the cattle samples demonstrate a large range of isotopic variation (Figures 2–6). These data follow previously observed trends, with lower δ 15N values occurring in the earliest prehistoric periods, followed by higher mean δ 15N during and after the Middle/Late Bronze Age (Figure 2) reflecting the cumulative impacts of landscape management practices on nitrogen sources and cycling (Guiry et al. Reference Guiry, Beglane, Szpak, Schulting, McCormick and Richards2018). While we note some younger animals in the dataset, we retain these because the consumption of milk is unlikely to drive patterns in δ 13C (which is the primary indicator that we use here) on the scale that we are exploring; δ 13C trophic enrichment factor (on average 0.5‰; Caut et al. Reference Caut, Angulo and Courchamp2009) occurs at a smaller scale. We do, however, note that, based on size, several of the Early Bronze Age individuals showing higher δ 15N (Figure 4B) are obviously calves. The small size of most prehistoric assemblages precludes detailed analysis of changing zooarchaeological age distributions.
Density contours showing isotopic variation within and between time periods (figure by authors).

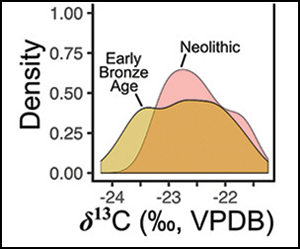
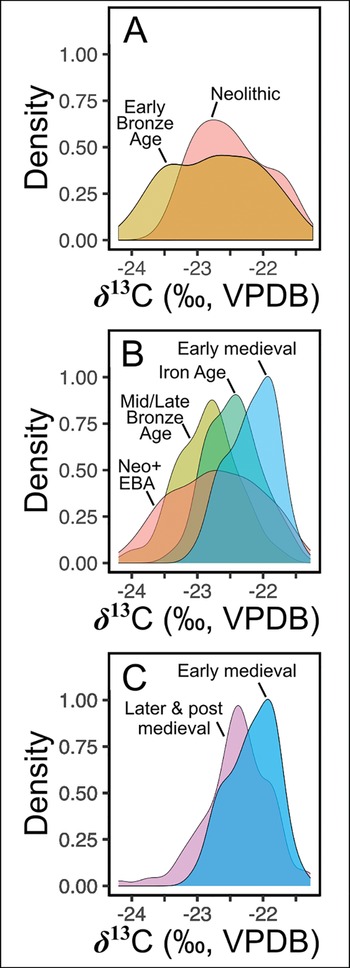
Density histograms showing shifts in δ13C by period (figure by authors).

Isotopic compositions by site and time period: from Neolithic to Late Bronze Age. Convex hulls show variation in each time period (coloured) versus the early medieval (grey) (figure by authors).

Isotopic compositions by site and time period: from Iron Age to later medieval. Convex hulls show variation in each time period (coloured) versus the early medieval (grey) (figure by authors).

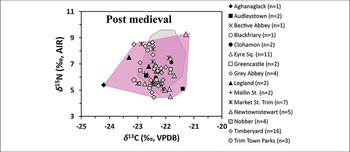
Isotopic compositions by site and time period: post medieval. Convex hulls show variation in each time period (coloured) versus the early medieval (grey) (figure by authors).

We identify marked shifts in δ 13C values that speak to husbandry practices and environmental conditions (Figures 2 & 3). Neolithic and Early Bronze Age cattle demonstrate a substantial range of δ 13C diversity, with a relatively wide and even distribution (Figure 3A). Moving into the Middle/Late Bronze Age (Figure 3B), there is a significant difference in the distribution of isotope values compared to the preceding periods (Table S8). While earlier patterns of diversity continue, the distribution of δ 13C values is overall more negative (Figure 3B), suggesting a mix of open and closed grazing environments, with emphasis on the latter.
During the Iron Age, there is a concerted and significant shift to a less negative distribution of δ 13C values (Table S8), indicating a more open grazing environment (Figure 3B). This shift intensifies in the early medieval period, where cattle uniformly show less negative values (Figure 3B; Table S8). In the later medieval and the post-medieval periods, which do not show significant differences in distribution from each other (and therefore are treated as a group in Figure 3C; Table S8), most cattle have isotope compositions similar to those of the early medieval period. In contrast to the preceding periods, however, 10 per cent now show δ 13C values that are lower than those observed in the early medieval (Figures 5C & 6), which is consistent with some cattle being kept in closed canopy woodland.
This interpretation is supported by the δ 15N data, which also show a widening in the later medieval and post-medieval periods (Figure 2). Few cattle in the Middle/Late Bronze Age, Iron Age and early medieval periods have particularly low δ 15N, which is consistent with the majority of these animals being husbanded in a landscape where nitrogen sources and cycling had been impacted by landscape management (Guiry et al. Reference Guiry, Beglane, Szpak, Schulting, McCormick and Richards2018). By contrast, there are increased numbers of samples with lower δ 15N in the later medieval and post-medieval periods, suggesting that some cattle were being kept in areas where nitrogenous soil nutrients were previously less affected by landscape management (Guiry et al. Reference Guiry, Beglane, Szpak, Schulting, McCormick and Richards2018). Against the backdrop of our δ 13C data, which suggests that some cattle were being raised in less open areas at this time, a parsimonious interpretation would be that these data also reflect a shift towards the use of remaining closed canopy woodland. This scenario contrasts with findings at later medieval and post-medieval Dudley Castle in the English West Midlands (Fisher & Thomas Reference Fisher and Thomas2012), where isotopic evidence has been speculatively linked to more, not less, tightly controlled animal diets at that time.
Discussion
Taken together, these isotope data map onto the documentary sources in some notable ways, which confirm hypotheses 2 and 3. Analyses of the textual and archaeological evidence suggest that cattle pasture was given priority in land management systems during the early medieval period but that, by the later medieval period, arable farming had become more important (McCormick Reference McCormick2008; Kerr Reference Kerr2009; McClatchie et al. Reference McClatchie, McCormick, Kerr and O'Sullivan2015). This shift is supported by the isotope data in that, compared to prehistoric times, the early medieval cattle were routinely raised in more open environments consistent with pasture. However, in the later medieval and post-medieval periods, cattle management diversified considerably to include the use of at least some areas with lower isotopic compositions, likely closed canopy wooded environments that persisted following deforestation in the early medieval period (see below). The later medieval and post-medieval periods are represented by a variety of site types and locations but one potentially important factor is the increasing scale of settlements, including urban sites, which would have been supplied from a variety of nearby sites. Similarly new in this period, Greencastle was an Anglo-Norman castle, where Beglane (Reference Beglane, Atici and Arbuckle2023) argues that most cattle originated as taxes and renders. The notably low δ 13C values for cattle from Aghnaglack, Ballyhanna, Legland and Tamnyrankin, support documentary accounts of the continued presence of tree cover in these Gaelic-held areas compared with the higher isotope values in Anglo-Norman areas of Ireland.
We surmise that if cattle were of central importance to a society, then people would preferentially settle near to, or seek to develop what they perceived to be the optimum land for cattle husbandry. Early texts indicate that cattle grazed on grassland were considered superior to those raised in other environments (Kelly Reference Kelly1997: 45, 59–62), thereby driving woodland clearance by early-medieval people (see below).
We acknowledge the difficulties in assessing the status of Irish prehistoric sites (Newman Reference Newman1998) and we are conscious of the limited nature of many assemblages. While the dating of the Céide Fields has been questioned, it has been argued that they were constructed during the Neolithic period for the management of cattle (Caulfield et al. Reference Caulfield, O'Donnell and Mitchell1997; Whitefield Reference Whitefield2017; O'Connell et al. Reference O'Connell, Molloy and Jennings2020). This would suggest that even at an early date, cattle could have been kept within unwooded settled landscapes. Cattle may also have been managed more extensively, in a manner akin to later booleying, a form of transhumance (Costello Reference Costello2020), which, in a relatively well-wooded environment, would be likely to result in lower δ 13C. Although less convenient for dairy production, where pasture close to settlements is preferable, extensive husbandry such as booleying would be suitable for managing male animals destined for future meat production. There is also some support for both of these strategies (the use of unwooded landscapes and extensive husbandry) in the Bronze Age data. Cattle of this date have relatively high δ 13C at settlement sites, such as Lough Gur and Chancellorsland (McCormick Reference McCormick, Murphy and Whitehouse2007; Table S2), suggesting the use of open land for pasture. By contrast, Newgrange and Haughey's Fort were centres of ceremonial and royal activity (McCormick Reference McCormick, Murphy and Whitehouse2007), likely drawing in people and resources from large areas for occasional events. These sites yield a wider range of δ 13C values, but with more samples falling towards the lower end of this δ 13C distribution, consistent with more woodland-orientated husbandry. This suggests that, similar to the Iron Age royal site of Navan Fort (Madgwick et al. Reference Madgwick, Grimes, Lamb, Nederbragt, Evans and McCormick2019), animals were brought to these sites from a wide variety of environments. Further, it suggests the possibility that animals destined to be brought to these ceremonial sites may have been separated, and reared apart from the animals destined for consumption in domestic settlements.
While this may indicate the use of a variety of environments in the Bronze Age, including open pasture around settlement sites, what is perhaps most notable, in the context of our first hypothesis and additional research questions, is that the shift towards the consistent use of open environments began in the early Iron Age. Looking further back to the Neolithic and Bronze Age, it is unsurprising to see a mix of husbandry environments, including many cattle raised in open pasture areas, particularly during the Neolithic, when naturally open areas may have been sufficient for local grazing needs. The presence of woodland-based husbandry by the Early Bronze Age, and its growing importance across the Middle/Late Bronze Age, indicates that management practices had shifted. Though it is difficult to explain this, it is at least plausible to suggest that a growing cattle population (perhaps increasing in step with human populations; Hannah & McLaughlin Reference Hannah and McLaughlin2019), or re-generating woodlands, could offer a partial explanation. It is against this backdrop that we see a consistent shift to grazing in open environments across the Iron Age, running seamlessly into the early medieval period. This would suggest that the combination of social, economic and/or environmental processes responsible for driving the intensive focus on cattle in the early medieval period may have earlier roots. We explore the context and implications of this possibility in more detail below, but first consider other explanations for the isotopic patterns observed to eliminate alternative possibilities.
Alternative interpretations
Variation in cattle δ 13C values on the scale observed here could be explained in a variety of ways by using social and environmental factors to account for patterns; however, we argue that none of these alternative interpretations offer a more parsimonious explanation than that outlined in the previous section.
Changing moisture levels? Moisture levels—particularly water stress—affect the isotopic compositions of plants. Water stress can cause plants to become less efficient at discriminating against 13C during photosynthesis, thereby driving up δ 13C in foliage and its consumers (Farquhar et al. Reference Farquhar, Ehleringer and Hubick1989; Stewart et al. Reference Stewart, Turnbull, Schmidt and Erskine1995). This explanation would require Ireland to have experienced significantly drier conditions consistently across those periods with less negative cattle δ 13C values. This does not conform with our observations. For instance, while there is some disagreement among records, during the Europe-wide Dark Age Climatic Deterioration, spanning AD 550–800 (Swindles et al. Reference Swindles2013; Cook et al. Reference Cook2015; for review, see McClung & Plunkett Reference McClung and Plunkett2020), Ireland experienced much wetter conditions, but these centuries are encompassed by the period with the least negative cattle δ 13C values.
Geographical variation? Other environmental factors including salinity, soil type and altitude can also subtly influence the extent to which plants discriminate against 13C during photosynthesis (Farquhar et al. Reference Farquhar, Ehleringer and Hubick1989). If specimens from different time periods originated from areas with systematically differing conditions, then isotopic patterns might not be linked to husbandry practices. This is challenging to assess due to the spatio-temporal heterogeneity in the cattle samples, however, some useful patterns emerge. From a spatial perspective, if we focus on the isotopic patterns for the county from which we have the most data, Meath, we see the same trends as the overall dataset, with substantial δ 13C variation in the Neolithic and Bronze Age (e.g. Clowanstown and Newgrange; Figure 4), a narrowing of δ 13C variation in the Iron Age and early medieval periods (e.g. Trim Townparks South, Navan, Ratoath and Stalleen; Figure 5A), and finally a move toward diversification of δ 13C and δ 15N in the later medieval and post-medieval periods (Market St. Trim, Nobber and Trim Townparks South; Figures 5C & 6). Observing the same patterns in both one small geographical area and the full dataset suggests that these patterns are not due to systemic differences in environmental conditions across the island. Furthermore, from a temporal perspective, the Iron Age and early medieval data derive from eight counties across Ireland and show a consistent and dramatic drop in the variation of δ 13C, strongly suggesting that this is a broader, rather than regional picture.
Deforestation? It is possible that trends in the use of wooded areas by cattle simply reflect relative abundance of woodland through time, which may have varied as a result of climatic shifts rather than human landscape management (Swindles et al. Reference Swindles2013; McClung & Plunkett Reference McClung and Plunkett2020). With respect to climate, while oscillations in prevailing conditions have been observed in the palaeoenvironmental records for the Iron Age and early medieval period (Kerr et al. Reference Kerr, Swindles and Plunkett2009; McClung & Plunkett Reference McClung and Plunkett2020), there is no consistent evidence for severe long-term droughts that would cause woodland to contract significantly or prevent their regeneration (Swindles et al. Reference Swindles2013). This means that natural climatic variation resulting in major woodland losses does not offer a reasonable explanation.
Even if higher cattle δ 13C values in the Iron Age and early medieval periods in part reflects a greater availability of more open landscape, it is possible that the desire to husband cattle in open landscapes served as a primary impetus to drive woodland clearance. It is, nonetheless, still worth considering the extent to which woodland-orientated husbandry remained possible and desirable during times for which we see little or no isotopic evidence indicating cattle husbandry in closed woodland areas. Pollen records help to contextualise these issues (McClung & Plunkett Reference McClung and Plunkett2020). The wide range of variation in pollen records notwithstanding, there is evidence for a modest increase in woodland clearance in the early Iron Age, followed by a tapering off and lull in deforestation during the later Iron Age, and then a surge in clearance associated with the early medieval period. By the later medieval period, woodland had become relatively scarce, though still locally present in some areas (Beglane Reference Beglane2018). It is therefore clear that, overall, the open land that could potentially be used as cattle pasture increased over time. However, it remains difficult, based on pollen evidence alone, to assess whether there was a point during the early medieval period or even in the Iron Age at which woodland resources would have become too scarce for substantive use in cattle husbandry. Early medieval texts, at least, seem to indicate that uncultivated and well-wooded lands were still common between farms and still accessible to cattle herders (Kelly Reference Kelly1997: 360, 389–90, 395).
While a decreasing woodland base is a relevant factor, the extent to which open land was sufficient to meet the demands of cattle husbandry at any given time remains unknown. Early medieval texts seem to indicate that potential for cattle keeping, and thus wealth generation, was limited by the finite amount of suitable land (Kelly Reference Kelly1997: 423); this suggests that there was a strong incentive to balance cattle populations close to the carrying capacity of the land available (McCormick Reference McCormick2008). Although the early medieval texts do not explicitly articulate the contrasting value of pasture versus woodland resources, they do offer some illustrative guidance. For example, they indicate that while summer grazing was often on bogs, mountains, hill pastures and water meadows, similar to the booleying or transhumance of the post-medieval period (Costello Reference Costello2020), cattle were brought closer to home for the winter, grazing on reserved areas of ‘standing hay’ and cereal-crop stubble. While a number of woodland resources, including elm, holly and ivy are also highlighted, many of the descriptions that explicitly link cattle husbandry with woodlands do so in winter contexts, when preferred grazing areas were exhausted, suggesting that the practice was typically avoided (Lucas Reference Lucas1989: 18, 35–6; Kelly Reference Kelly1997: 42–6, 379, 382, 397).
Together, these strands of evidence suggest that, while woodland cover decreased over the Iron Age and early medieval periods, woodland-orientated husbandry was still possible and sometimes considered appropriate by the time that farming knowledge was codified in the extant early medieval texts. This suggests that woodland husbandry, similar to that for which we have isotopic evidence in the Bronze Age, was still possible to some extent in the later prehistoric periods as well. In other words, the potential feasibility for woodland-orientated husbandry practices, coupled with the fact that this was a period during which cattle may have gained importance within the socio-economic system, means that even though woodlands were decreasing, cultural choices rather than purely environmental explanations—such as a lack of woodlands—are required to account for the patterns observed. In this context, we can explore their implications for our understanding of the development of early economic and landscape management systems in Ireland.
Conclusions and broader implications
Documentary and archaeological records from the early medieval period indicate the cultural and economic centrality of cattle in Irish society (Lucas Reference Lucas1989; Kelly Reference Kelly1997; McCormick Reference McCormick2008). The origins of this are obscure, however. Molecular evidence demonstrates the importance of dairying starting in the Neolithic period (Smyth & Evershed Reference Smyth and Evershed2015, Reference Smyth and Evershed2016), however prehistoric zooarchaeological records, which could help identify shifts in the balance of the use of animals for dairy, meat and traction, are few (McCormick Reference McCormick, Murphy and Whitehouse2007; McClatchie et al. Reference McClatchie, Schulting, McLaughlin, Colledge, Bogaard, Barratt and Whitehouse2022). Nevertheless, among the large prehistoric faunal collections that have been excavated and studied, including Newgrange, the Navan Fort Complex, Dún Ailinne and Kilshane (van Wijngaarden-Bakker Reference van Wijngaarden-Bakker1986; Murphy & McCormick Reference Murphy and McCormick1996; Crabtree Reference Crabtree, Johnston and Wailes2007; Pigière et al. Reference Pigière, McCormick, Olet, Moore, O'Carroll and Smyth2022), we see some variation in the relative importance of cattle as well as in relation to key variables for reconstructing age, sex and slaughter profiles (McCormick Reference McCormick, Murphy and Whitehouse2007).
The contrast between cattle husbanded on a variety of landscape types in the Neolithic and Bronze Ages (Figure 3A) versus those grazed in open landscapes in the Iron Age and early medieval periods (Figure 3B) indicates that something fundamental had changed in cattle management practices. Our data suggest that while open land management of cattle in Ireland has antecedents as far back as the Neolithic, it was not until the early Iron Age that we see consistent use of open pastures and the avoidance of closed woodlands. This is significant because it indicates continuity with cattle husbandry regimes into the early medieval period, a period for which contemporaneous written accounts demonstrate sophisticated rationales for why cattle husbandry occurred in specific types of environments. By considering these we can explore the extent to which the Iron Age evidence for cattle management may have directly anticipated the agricultural knowledge and practice of the early medieval period. Analysis of early texts appears to show that open land management was linked to producing cattle and cattle products of higher quality (Kelly Reference Kelly1997: 45, 59–62) and it is likely that this was one reason for agricultural land being allocated to pasture (McCormick Reference McCormick2008). While woodland resources were available, and deemed appropriate for cattle husbandry, they were seen as less desirable than pasture (Lucas Reference Lucas1989: 35–6; Kelly Reference Kelly1997: 42, 46, 379, 382). In that context, the apparent Iron Age avoidance of substantial woodland-orientated cattle management, in direct contrast with our observations of the preceding Bronze Age practices, suggests an intentionality similar to that apparent in the early medieval period, with farmers focusing cattle husbandry on open lands and avoiding woodlands. To the extent that husbanding cattle in open land was the result of the high value placed on them in the early medieval period, it is reasonable to suggest that the development of this practice in the Iron Age was based on a similar rationale.
Archaeological and historical evidence for the re-allocation of land from pasture to grain production towards the end of the early medieval period (McCormick Reference McCormick2008; Kerr Reference Kerr2009) further supports the perceived value of cattle and the hold this had on the Irish landscape during the early medieval period. For instance, by the early medieval period, landscapes and settlements appear to have been structured to support large numbers of cattle, through use of ringforts (circular areas surrounded by a bank and a ditch) designed for the protection of animals, and located close to good pastureland (McCormick Reference McCormick1995, Reference McCormick2008). In contrast, from the eighth century AD onwards, there is increasing evidence for raised raths (circular platforms which are more domestic in character than ringforts) and unenclosed settlements located in areas better suited to arable farming, and there was significantly more investment in mills for processing grain (McCormick Reference McCormick1995, Reference McCormick2008; Kerr Reference Kerr2009). These changes are thought to be connected to building a capacity to develop wealth surpluses, since grain could more easily be stored and transported, thereby allowing participation in wider trade networks and the development of a silver-based, rather than cattle-based, economy (McCormick Reference McCormick2008; Kerr Reference Kerr2009). While we acknowledge that pastoralism and arable farming often coexist (Ebersbach Reference Ebersbach, Kerig and Zimmermann2013), the fact that such a reorganisation of settlement structure was needed in order to shift the emphasis towards arable agriculture throws into sharp relief the extent to which Irish farming practices had previously been organised around cattle husbandry. Our findings indicate the start of this process began in the Iron Age, when the shift towards the consistent use of open pasture could surely have been an early step along a trajectory that resulted in the highly ‘cattle-centric’ social structure of the early medieval period.
Acknowledgements
For a full list of persons and organisations as well as other acknowledgements and author contributions see the OSM.
Funding statement
The following organisation and institutions contributed funding supporting this research: Wenner-Gren Foundation, Ireland-Canada University Foundation, Centre for Environmental Research Innovation and Sustainability, IT Sligo.
Supplementary material
To view supplementary material for this article, please visit https://doi.org/10.15184/aqy.2023.163.


 Open access