

1.1 Introduction
Health systems are complex. For one, they are made up of multiple inter-acting components. Indeed, according to the World Health Organization (WHO), a health system consists of all ‘organizations, people and actions whose primary intent is to promote, restore or maintain health’. They are also usually defined as country-level entities, rendering them large, encompassing both rural and urban areas, public and private systems as well as formal/allopathic and informal/traditional systems of health provision.
Health systems perform multiple functions in society – they do not merely deliver healthcare services and other interventions aimed at maintaining or improving health. They play a role in protecting households from the financial impacts of both illness and the costs of healthcare. It is important to note that health systems also perform an economic function in society (Reference SachsSachs, 2001). For example, there is some evidence that the health of a population can influence economic productivity, while for many health workers and businesses, the health system is an economic sector that provides employment, wages and business opportunities. Health systems are also social and cultural institutions that play a function in helping establish ‘a wider set of societal norms and values’ (Reference GilsonGilson, 2003).
Health systems are open systems that exist in a dynamic relationship with their wider context. Indeed, they are diffuse systems with poorly defined and often porous boundaries and are thus adaptive and continuously evolving in response to multiple factors. For this reason, the social, political and economic context of any health system has to be considered when assessing its structure and performance.
Finally, health systems are sites of competition and contestation between actors with different needs and wants. There is contestation over how health priorities are set, how health systems are financed and how resources are allocated within the system. There are often ideologically and politically contrasting visions of what role a health system should play in society and what role the state and the market should play within health systems.
These different aspects of the complexity of health systems are rarely addressed simultaneously and in an inter-disciplinary manner. The truth is that health systems can only be comprehensively studied and understood through multiple disciplinary lenses, including those of history, economics, medicine, epidemiology, politics, law, ethics, anthropology and sociology.
This book presents a comprehensive and critical analysis of health systems within the context of local politics, history and socio-economic development. In the following sub-sections, we unpack some of the different dimensions of health systems complexity. First, we look at the different societal functions performed by the health system. We then investigate how health systems are also sites of contestation between different ideas and values as well as different interest groups. We then examine a variety of approaches to constructing health systems frameworks and typologies and how these can be used to describe and understand the functioning and performance of health systems. The next section discusses the open and contextual nature of health systems and the relationship between the health system and a variety of external factors, including shifts in international health policy-making. The chapter concludes with a brief discussion of systems thinking, which is discussed in greater detail in Chapter 2.
1.2 The Different Societal Functions of a Health System
For most, the obvious function of a health system is to deliver a variety of services and interventions. These services may be ‘personal’ services (delivered to individuals or families) or ‘non-personal’ services (typically public health interventions targeted at entire populations or the environment in which people live). Clearly, this is a primary function of health systems, and most evaluations of health systems performance are based on how well these personal and non-personal services are delivered in terms of their effectiveness, accessibility, fairness, efficiency and affordability.
However, health systems are more than just a vehicle for delivering health services. For example, health systems can help define and shape the identity of countries. For many post-colonial countries, health systems development is an important ingredient in nation-building, with the construction of health facilities and the extension of healthcare to rural populations viewed as indicators of progress and modernisation that are sources of national pride. Similarly, the health systems of the United Kingdom, Germany and Canada are often viewed emblematically as a national characteristic.
Perhaps more importantly, health systems play an essential social function in both shaping and reflecting relations amongst groups of people in a society. For example, national health systems reflect the depth and breadth of the social contract between governments and citizens by determining the scope of health-related rights and entitlements afforded to the citizens or residents. They also shape and reflect the relationship between the different socio-economic segments of society by either reinforcing or mitigating the relationship between social inequalities and health inequalities. The degree to which healthcare is affordable, accessible and responsive is also a critical determinant of social mobility.
Furthermore, much research and evidence have demonstrated how health systems play a significant role in defining the lived experience of being poor, socially disadvantaged or infirm. For example, studies from multiple countries have described how sub-standard and abusive treatment from healthcare providers are viewed as core defining features of what it is to be poor (WHO & World Bank, 2002). Similarly, the chronic anxiety and fear produced by the lack of protection from the costs of illness, injury and disability are a feature of relative poverty in the USA, even for working families (Reference Himmelstein, Warren, Thorne and WoolhandlerHimmelstein et al., 2005; Reference Whitehead, Dahlgren and EvansWhitehead et al., 2001). The International Labour Organization (ILO) defines social health protection as the provision of organised measures to mitigate the distress caused by the reduction of productivity, stoppage or reduction of earnings, or the cost of necessary treatment that can result from ill health (ILO, 2008).
By shaping how medical services are organised, regulated and delivered, health systems also play a key cultural role in society. Indeed, by helping to define the experience and significance of core human experiences such as birth, death and illness, health systems can legitimately be viewed as cultural institutions in their own right, interacting with other cultural institutions such as religion and the arts.
Finally, health systems are also economic institutions. Many health systems incorporate markets of various kinds and sizes, as well as market actors who view health systems through a commercial lens. And, as already noted, investments in health systems are also investments in economic development. Not only are they central to the production of healthy and productive workers, they are also a source of employment and can stimulate growth in other industrial sectors.
There is a tendency to gloss over the fact that health systems have multiple identities and roles and instead view them narrowly in mechanistic terms as a structure or instrument designed to deliver health services. However, a fuller understanding of health systems would place greater emphasis on their social, cultural and economic significance and on the fact that they represent a terrain for the contestation of different ideas and interests.
1.3 Contestation within Health Systems
Certain competing ideas and interests are particularly important for determining the design, structure, performance and evolution of health systems. These include different ideological positions about the role and responsibility of the state in guaranteeing access and providing healthcare to all, the role and degree of freedom afforded to markets within health systems, and the degree to which individuals are responsible for their own state of health and wellbeing.
Health policy is also affected by competition and contestation between different groups in society over how the costs and benefits of health systems are shared. Indeed, many authors have noted the fundamentally political nature of healthcare reform and policy-making processes that determine the allocation and distribution of resources and the setting of priorities within the health sector (Reference BarkerBarker, 1996; Reference Grindle and ThomasGrindle & Thomas, 1991; Reference Walt and GilsonWalt & Gilson, 1994).
Of particular importance are competing views on how health systems should be financed and to what degree financing is regressive or progressive. Determining the extent to which health systems facilitate the sharing of risk and the costs of healthcare across the whole of society is fundamentally a normative process based on views regarding the obligations of higher-income populations to cross-subsidise the needs of lower-income groups, and of the young, fit and healthy to help insure against the costs of being old, disabled and unwell.
Reference EvansEvans (1997) identifies conflicts of interest in health systems financing as being grouped around three main axes. He describes the first as being between ‘those who pay for services, and those who are paid for them’ and centred around the fact that healthcare expenditure is always translated into healthcare incomes (to those who are paid to provide healthcare). As a consequence, there is always a tension between actors who want to contain costs (taxpayers and governments) and those who want to maximise expenditure (health professionals, pharmaceutical companies, etc). In practice, overall expenditure can be grown by increasing public health budgets and/or expanding the inflow of private health finance through direct out-of-pocket payments or private insurance systems.
It is also the case that different provider groups within the health system will compete with each other to capture healthcare expenditure as income for themselves. Thus doctors may promote ideas and policies to safeguard the pre-eminence of medicine within health systems and stave off competition from other types of healthcare provider. Pharmaceutical companies will promote policies and practices that increase the consumption of proprietary medicines; private insurance companies will lobby against social or national health insurance models and against any regulation of insurance markets that would impinge on their ability to generate profits. While these tensions may be the result of legitimate technical disagreements about the most effective and equitable use of resources in a health system, they may also be the result of competing interests.
The second axis of conflict, according to Evans, is between different groups of payers, and it is mainly centred around the choice of method of health financing and how this determines what share of any given level of health spending will be borne by different groups in society. As financing from general taxation generally places a larger burden on people with higher incomes in contrast to private financing, which places a greater burden on those who become (or are at most risk of becoming) ill, Evans argues that it is no surprise that ‘higher-income people tend to support private finance, whereas lower-income people do not’.
Evans’ third and final axis of conflict is over access to services and the choice between a universal and equitable public sector health system and a mixed public–private system. This conflict is between a single system that limits the advantage to people with higher incomes in accessing better care and a mixed system that gives some people the opportunity to ‘buy their way to the front of the queue and to ensure that any “rationing” is imposed on someone else’.
The three axes of conflict can also reinforce each other. For example, pressure from higher-income groups to ensure that they can access higher-quality care in the private sector can be reinforced by provider groups lobbying against cost containment and restrictions within a universal system as a way of increasing overall health expenditure.
Finally, it is important to note that while the choices between different health financing models and policies can be framed in political and ideological terms, they can also be framed in non-political and technocratic ways. For example, universal systems of healthcare financing and provision can also be promoted as enabling health systems efficiencies through economies of scale and monopsony power. Equally, mixed systems of financing and provision can be advocated as efficiency measures by creating market competition and encouraging greater levels of individual responsibility for health. This point is pertinent because there is a tendency to cast many debates about health policy and healthcare reforms in technocratic terms to obscure or downplay political and ideological differences.
1.4 Health Systems Frameworks and Typologies
Given the complexity of health systems, it is not surprising to find that several frameworks have been developed to help study and evaluate them. Many are designed to help describe and understand the various components that contribute to the primary function of delivering health services.
For example, the WHO ‘building blocks’ framework comprises six building blocks consisting of ‘leadership and governance’; four intermediate blocks consisting of ‘financing’, ‘the health workforce’, ‘medical products, vaccines and technologies’, and ‘health information systems’; and a final block consisting of ‘service delivery’. A framework used by Reference RoemerRoemer (1993) similarly conceptualises four functional components that combine to enable service delivery: (1) financing; (2) production of inputs (e.g. personnel, facilities and pharmaceuticals); (3) organisation and structure of the health system; and (4) management.
These and other frameworks tend to share a pattern of having a component related to an organising function of some sort (variously labelled as ‘governance’, ‘stewardship’, ‘management’, ‘leadership’ and ‘regulation’), which is then combined with various categories of inputs required to deliver services (e.g. finance and personnel).
However, while such frameworks describe the various components involved in producing health services, they do not provide a useful basis for understanding the social, political and economic dimensions of health systems. For example, the WHO building blocks framework does not allow for the description or assessment of a health system according to the core issues of how health financing, resource allocation and benefits distribution are structured and organised.
Thus it is necessary also to consider frameworks that speak more to these issues, especially political economy frameworks that are focused on describing the determinants of how the costs and benefits of health systems are distributed across society. Such political economy frameworks typically integrate an analysis of how different stakeholders relate to each other and to certain key functions. Many focus on the roles and powers of government and other public institutions in defining the relationship between financing and healthcare delivery, and determining the mandates, opportunities and powers of other actors, and use this as a basis for creating a typology of health systems (Reference Böhm, Schmid, Götze, Landwehr and RothgangBöhm et al., 2013; Reference FieldField, 1973; Reference Wendt, Frisina and RothgangWendt et al., 2009).
One such approach by Reference Rothgang, Cacace, Grimmeisen and WendtRothgang et al. (2005) highlights the core regulatory function of structuring the relationships between financing agencies, healthcare providers and potential beneficiaries and classifies health systems according to who is involved in carrying out this function. They also break down regulation into six objects: (1) determining which parts of the population are included in the public and/or private system (coverage); (2) determining the system of financing; (3) determining how providers are remunerated; (4) determining which providers have access to markets and financing agencies; (5) determining how patients access providers; and (5) determining the content and range of services available to patients (Reference Rothgang, Cacace, Grimmeisen and WendtRothgang et al., 2005).
Another political economy framework is one used by Roemer to classify health system policies into four broad types: (1) entrepreneurial and permissive; (2) welfare-oriented; (3) universal and comprehensive; and (4) socialist and centrally planned (Reference RoemerRoemer, 1991). The Organization for Economic Cooperation and Development has also categorised health systems according to three features: (1) whether the prime funding source consists of payments that are made voluntarily or that are compulsory; (2) whether services are provided by direct ownership (e.g. the ministry of health or social insurance agency provides the services itself), by contractual arrangements (e.g. the ministry of health or social insurance agency contracts providers to deliver services), or simply by private providers (paid by direct out-of-pocket payments); and (3) whether services are paid for prospectively or retrospectively (Reference Böhm, Schmid, Götze, Landwehr and RothgangBöhm et al., 2013).
As a final example of the many ways in which health systems can be described and understood, we draw attention to the selection of a set of five key descriptors suggested by Reference Mills, Ranson and MersonMills and Ranson (2012):
The dominant method of financing (e.g. tax, social insurance, private insurance, out-of-pocket payments).
The underlying political philosophy (e.g. capitalist, socialist).
The nature of state intervention (e.g. to cover the whole population or only the poor).
The level of gross national product (e.g. low, middle, high).
Historical or cultural attributes (e.g. industrialised, non-industrialised, transitional).
1.5 The Open and Contextual Nature of Health Systems
As noted earlier, health systems are social institutions that can help inform wider social and political norms and attitudes such as those that relate to the relationship between the state and inhabitants or between different segments of society. However, health systems are also clearly affected and influenced by social, economic and political forces that are highly contextual.
For example, the end of the Second World War in western Europe and the end of direct colonialism in Africa and Asia were political events that helped produce an environment that sustained strong government commitment to the idea of universal public sector health systems. Conversely, the collapse of the Soviet Union and the shift from a socialist to a capitalist political system precipitated the collapse of the universal health system in many parts of the former Soviet Union. Other examples of political systems influencing the design of health systems include the racist and fragmented structures of the apartheid health system in South Africa and the communitarian health system of Cuba.
We can also see how ideologies and value systems such as democracy and human rights can shape the design of health systems. For example, many countries now have constitutions in which governments have duties to ensure the progressive realisation of human rights, including access to essential healthcare. At the same time, health systems are also affected by political and economic changes. For example, economic recession and a debt crisis in Africa, Asia and Latin America in the 1980s and 1990s led to structural adjustment programmes that produced a set of health sector reforms that included public sector budget cuts and a shifting of the burden of healthcare costs onto households through the use of user fees and private healthcare.
Similarly, neoliberal policies and globalisation have combined to produce a set of political dynamics that have had profound influence on the design and evolution of health systems. These include an increase in cross-border flows of finance, goods and services affecting the health sector and the general adoption of policies aimed at deregulating the health sector, outsourcing healthcare services liberalisation and promoting privatisation. Some of these changes have also been enhanced by technological developments that have facilitated the faster and freer flow of finance and information across national borders.
Any understanding of the evolution, design and performance of a health system must therefore include an analysis of its social, economic and political context. It is also important to examine the wider context when considering policies to develop, strengthen or reform health systems for the future. While health systems are subjected to a variety of external forces and changing circumstances, ideally they should be capable of anticipating new external forces and changes to the context in which they operate. For example, developments in medicine that are driven by technological advances in artificial intelligence, gene therapy, robotics, nanotechnology, cybernetics and telecommunications are likely to create a variety of demands on health systems and healthcare services that can be accommodated either in a planned or an unplanned manner. Similarly, we can anticipate that global warming and climate change, coupled with the likely accompaniment of mass population displacements, will exert pressure on healthcare systems in different parts of the world. Other transitions that are currently underway include demographic and nutrition transitions that will probably increase the number of people living in old age and with chronic diseases.
1.6 Malaysia as a Case Study
This book tells the story of the evolution of Malaysia’s health system. The story is worth telling because it is a health system that has been successful, to a large extent, in having achieved universal health coverage and significant progress in health outcomes of the population. At the same time, Malaysia, like other countries, continues to face a number of complex challenges, including emerging infectious and non-communicable diseases. In telling the story of Malaysia’s health system, this book also critically examines the robustness of the foundations of the health system to meet these challenges.
To do so, we have applied a systems-thinking analytical approach. Systems thinking has emerged as an area of health systems research and analysis designed specifically to help decipher the complexity of health systems and inform the design and evaluation of health systems–strengthening interventions (Reference De Savigny and AdamDe Savigny & Adam, 2009). The practice of systems thinking has developed as we recognise the complexity and interconnectedness of our problems. As a solution to a complex problem and a tool that cuts across disciplines, systems thinking is itself complex. Thus it evades a simple, concise definition and has been subject to multiple definitions and redefinitions (Reference Arnold and WadeArnold & Wade, 2015). For our purposes, we describe systems thinking as an approach to recognising that events take place in the context of a system and that systems are composed of elements that are interconnected through feedback loops – such that solely following a linear analysis of cause and effect will fail to capture important understandings of the system. By studying the system as a whole, and not just the sum of its parts, the practice of systems thinking leads to better understanding and better decision-making. We detail our approach and methodology in Chapter 2.
The application of systems thinking and theory to the health sector has received growing attention in recent years. This has resulted in part from frustrations over the limited success of interventions for strengthening and improving the performance of health systems. It also comes from a growing appreciation of the fact that health systems are complex adaptive systems in which interactions between system components are typically non-linear, not easily controlled, unpredictable and characterised by unintended effects, paradoxical behaviour and multiple feedback loops (Reference De Savigny and AdamDe Savigny & Adam, 2009; Reference DornerDorner, 1997; Reference Tan, Wen and AwadTan et al., 2005; Reference Rickles, Hawe and ShiellRickles et al., 2007; Reference Paina and PetersPaina & Peters, 2011). As such, the WHO has encouraged systems thinking as a way of enabling researchers, funders and policy-makers to improve their understanding of what works in health systems strengthening and ‘catalyse conceptual thinking regarding health systems, system-level interventions, and evaluations of health system strengthening’ (Reference De Savigny and AdamDe Savigny & Adam, 2009).
We aim to demonstrate several ways that systems methodologies can contribute to health system strengthening. Systems thinking is a useful means of exploring problem spaces and boundaries, including linkages within and beyond the health system. Health system problems and interventions do not respect categorical or highly structured categories, such as health system building blocks, nor disciplinary and organisational boundaries, such as the various departments in a health ministry. In tracing the feedback loops to describe a system surrounding a problem, systems thinking helps us re-evaluate our assumptions about what is and isn’t relevant. It helps us think about contexts as dynamic and interactive rather than as a static background that remains unchanged in an intervention. It also draws our attention to the deep connections between societies and health systems and the ways they shape one another.
The systems’ interactions in health systems are inherently complex. The visual representation of causal pathways in systems thinking can help us understand and communicate such complexity. Likewise, the emphasis on feedback loops as system drivers focuses our attention on the self-corrective and adaptive capacities of systems and away from deceptively simple narratives of linear cause and effect. By providing a framework and language for thinking and speaking about complexity, systems thinking increases our capacity to engage meaningfully with it.
Finally, by redefining problem spaces and facilitating conversation about complex systems, systems thinking fosters interdisciplinarity and co-production for health systems strengthening. The systems analysis and visualisation in this book came out of extensive research, consultation and dialogue with a wide range of stakeholders that fed into an iterative process of sense-making between subject matter experts and systems thinkers. The process of co-production not only makes the knowledge generated more holistic and robust but also increases the likelihood of use and acceptance due to buy-in and the creation of an output that is understandable to all partners involved.
The book is divided into three sections. Section I consists of two introductory chapters. The first unpacks the multiple dimensions of a ‘health system’ and discusses the different ways in which a health system is complex. It describes health systems from a number of dimensions, including the technocratic, social, cultural, political, economic and normative. In doing so, it describes a variety of health systems frameworks and typologies. It also discusses the importance of contextualising any description and analysis of any health system and understanding how health systems thinking and policy have evolved over time internationally. The second introductory chapter presents the aspects of systems thinking and systems theory that are the focus of this book. It describes the growing interest in applying systems thinking to the study of health systems, the challenges faced, and the dual approach of case studies and whole-systems analysis taken herein.
In Section II, we present the story of the development of the Malaysian health system, its changes over time and the challenges it faces today and looking forward. It begins with a historical overview of the health system in Chapter 3, followed by separate chapters on each of the WHO health systems building blocks. The service delivery building block is divided into four sections: primary care, secondary and tertiary care, disease control, and environmental health. In each chapter, systems thinking is applied to examine the development of each building block and their linkages with each other as well as the drivers, enablers and obstacles outside the health system. The division of thematic areas into building blocks is purely instrumental.
Finally, Section III presents some generic lessons that can be used to guide future action and future change in both Malaysia and elsewhere. Chapter 13 summarises and discusses a number of issues and observations that cut across the various chapters in Section II and considers the challenges facing the Malaysian health system today and in the future. The chapter also highlights lessons that may be applicable to other countries in Asia and Africa. Chapter 14 presents lessons on the functioning and behaviour of health systems through reflections on the development of the case studies and an analysis of the key feedback processes that shape health systems.
2.1 Current Challenges in Health Systems Analysis
There has been a rapid growth of interest in the application of systems thinking and system science to health systems improvement (Reference AdamAdam, 2014; Reference Chughtai and BlanchetChughtai & Blanchet, 2017). The Alliance for Health Policy and Systems Research produced Systems Thinking for Health Systems Strengthening (Reference de Savigny and Adamde Savigny & Adam, 2009) in 2009. This landmark document (1) called for greater use of system principles, including dynamic thinking, systems as causes, and feedback effects in understanding health systems; (2) illustrated how a single health intervention is mediated by and impacts on the wider health system; and (3) provided guidance on how systems thinking might be used to facilitate multisectoral planning and the evaluation of health system interventions. Since then, there have been several major publications, including ‘Systems Thinking for Health Systems Strengthening in LMICs: Seizing the Opportunity’, a special issue of Health Policy and Planning; ‘Advancing the Application of Systems Thinking in Health Systems’ in Health Research Policy and Systems, Applied Systems Thinking for Health Systems Research: A Methodological Handbook (Reference de Savigny, Blanchet and Adamde Savigny et al., 2017); and Health Systems Thinking: A Primer (Reference Johnson, Anderson and RossowJohnson et al., 2019). These papers describe system methodologies intended to improve understanding, planning and evaluation in health systems.
Despite this interest, there are relatively few examples of the application of systems thinking to health systems strengthening (Reference Wilkinson, Goff, Rusoja, Hanson and SwansonWilkinson et al., 2018). This is reflected in the large proportion of papers on the subject advocating the use of systems approaches for health systems improvement without actually applying them (Reference Carey, Malbon, Carey, Joyce, Crammond and CareyCarey et al., 2015), reflecting gaps that need to be bridged to support practice. Lack of capacity and resources for such novel and complex methods is certainly a barrier, especially in low- and middle-income countries (LMICs) (Reference El-Jardali, Adam, Ataya, Jamal and JaafarEl-Jardali et al., 2014). However, well-funded efforts at operationalisation in developed countries have also faced major difficulties (Reference Sautkina, Goodwin, Jones, Ogilvie, Petticrew, White and CumminsSautkina et al., 2014).
The escalating calls for a systems thinking approach to health systems improvement demand a practical response. We have identified two key challenges that need to be addressed. First, while system methodologies are necessary for addressing complex problems, in practice such methods require collaboration between many stakeholders, most of whom will have no familiarity with systems thinking. It follows that implementing system methodologies requires not only technical systems know-how but also a well-developed capacity to facilitate cross-sector communication and engagement. One way of minimising the engagement barriers, and therefore advancing the use of systems thinking at health system level, is to adopt system methods that are concrete and as easily accessed as possible.
A second challenge is the lack of a usable systemic model of the overall health system. The relationships between the World Health Organization (WHO) building blocks, emphasised by Reference de Savigny and Adamde Savigny and Adam (2009), provide a natural point of entry to systems thinking. However, there is limited evidence of the use of feedback between health system building blocks in the analysis of interventions (Reference Baugh Littlejohns, Baum, Lawless and FreemanBaugh Littlejohns et al., 2018; Reference Mutale, Ayles, Bond, Chintu, Chilengi and Tembo MwanamwengeMutale et al., 2017). This highlights the need to further develop the concepts first put forward in Systems Thinking for Health Systems Strengthening to make them usable by a wider range of health researchers and practitioners. A methodological approach capable of supporting efforts to integrate the wide range of situations, observations and policies that typify health systems is essential in efforts to address these two challenges.
Stephen Reference Boyden, Boyden, Jacobs and YoungBoyden (1986) outlined six essential characteristics of a methodology that can facilitate the development of a systemic model (Box 2.1). As Boyden’s focus was broadly ‘culture-nature systems’, of which health systems are a part, his criteria can be used essentially unchanged to guide efforts in health systems improvement.
A methodology capable of supporting the development of an integrated health system model needs to perform the following functions:
1. It should provide a rational basis for organising information relating to different aspects of the [health] system under consideration.
2. It should provide a structure for analysing, visualising and communicating about the interactions between the different aspects (natural and cultural) of human situations.
3. It should facilitate recognition and consideration of fundamental principles relating to the interactions between variables of different kinds.
4. It should encourage consideration of the full spectrum of variables which may be relevant in any particular situation under investigation. [In particular, it should ensure that full consideration be given to intangible aspects of reality as well as aspects that are tangible and easily quantified.]
5. It must encourage consideration of changes over time in the system under investigation as well as a sense of perspective with respect to rates of change and the scale of societal activities and impacts.
6. It must be flexible. That is to say, while it must be useful in the organisation of information and in communication, it should also encourage speculation and the formulation of new ideas; it must never dictate our way of thinking about human situations.
Consideration of the Boyden criteria led us to select system dynamics as the methodological basis for the case studies presented in this book. System dynamics is a method for learning in and about complex systems (Reference StermanSterman, 2000). It is a mature discipline that, as pointed out by Reference Newell, Dyball and NewellNewell (2015), meets all of Boyden’s methodological requirements. As described more fully in Section 2.2, system dynamics is built on fundamental principles concerning the way system structure (i.e. the network of interactions between key state variables) drives system behaviour over time (thus meeting criteria B3 and B5). It is flexible in that it deals in elementary building blocks (stocks, flows, feedback loops) that can be combined, Lego™-like, to represent system structure in essentially any context (B6). Because of this versatility, it provides a means of organising information from different disciplines and thereby supports the development of practical integrative approaches (B1, B4). The generic nature of its concepts encourages consideration of a wide range of variables when teams formulate their ‘dynamic hypotheses’ (tentative identification of system structures that can generate observed behaviour). It provides practical tools (such as causal loop diagrams (CLDs) and stock-and-flow maps and models) that can be used to facilitate the visualisation, testing and communication of these hypotheses (B2). Finally, while system dynamics rests on powerful mathematical foundations, in practice its basic concepts are usually expressed in terms of simple metaphors that can be easily understood by people with a wide range of backgrounds.
System dynamics methods are not confined to quantitative modelling – in fact the discipline supports a seamless progression from systems thinking to dynamical modelling (Reference ForresterForrester, 1961; Reference Forrester1968; Reference Forrester1969; Reference Forrester1990). The book Thinking in Systems: A Primer (Reference MeadowsMeadows, 2009) is a readable introduction. Elsewhere, Reference StermanSterman (2000) provides a thorough discussion in Business Dynamics: Systems Thinking and Modelling for a Complex World.
2.2 System Dynamics Concepts and Tools
The accessibility of system dynamics concepts depends on the discipline’s use of easily understood conceptual metaphors (Reference Lakoff and JohnsonLakoff & Johnson, 2003; Reference NewellNewell, 2012). For example, the notion of ‘stocks and flows’ is usually introduced in terms of the bathtub metaphor (Table 2.1). In this metaphor, the bathtub stands for a specific component of a complex system. At any particular time, the ‘state’ of the component is represented by the amount (‘stock’) of water that has accumulated in the tub. Changes in this variable (seen as changes in the water level) represent changes in the state of the system component. The processes that change the state of the component are represented by the ‘flows’ of water into and out of the tub. Stocks can be tangible quantities like water, money or the number of people infected with a virus, and they can be intangible quantities like social capital, political will or happiness.
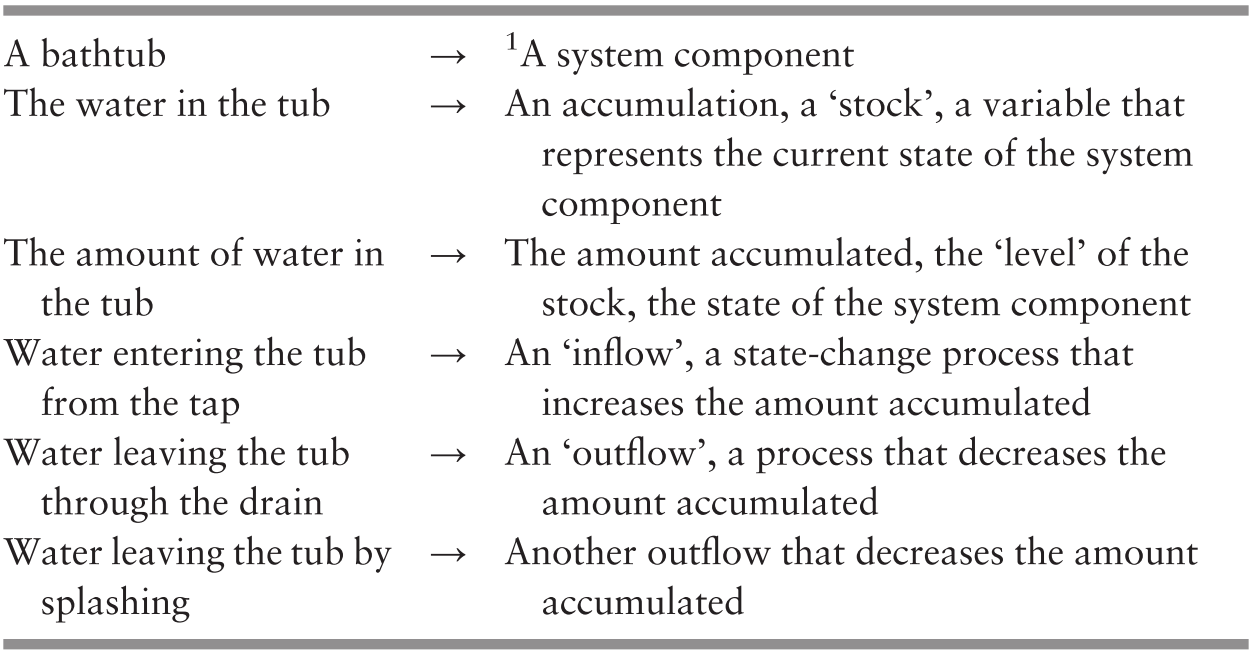
1 The arrows represent the expression ‘corresponds to’.
System dynamics provides a disciplined visual language that can be used to communicate assumptions about the interactions between the parts of a system. This language includes stock-and-flow maps. A simple example is shown in Figure 2.1. In this diagram, the boxes represent the levels of variable quantities (‘stocks’) that indicate the current state of the system of interest. The double-line arrows represent state-change processes (‘flows’) that can alter the stock levels (i.e. change the state of the system). The tap symbols in the arrows represent process ‘flow rates’. The single-line arrows represent ‘influence links’ whereby stock levels control process flow rates.
The susceptible–infected–recovered (SIR) system. This stock-and-flow map represents the causal structure of the system that governs the spread of infectious diseases. In epidemiological practice, this structure is known as the SIR model. The three stocks shown in the map are connected by two flows that represent the processes of infection and recovery, respectively. The rates of these state-change processes are controlled by the levels of the stocks.

CLDs can play a useful role in situations where a stock-and-flow model is not required or cannot be easily constructed. An example is shown in Figure 2.2. In this type of diagram, blocks of text represent the levels of state variables (stocks). The arrows are ‘influence links’ that represent the state-change processes (flows). A change in the level of the driver variable (at the tail of the arrow) causes a change in the level of the affected variable (at the arrowhead). The plus and minus signs are link ‘polarities’. A positive polarity (+) indicates that an increase in the level of the driver variable will cause the level of the affected variable to eventually rise above the level it otherwise would have had, and that a decrease in the level of the driver variable will cause the level of the affected variable to eventually decrease below the level it otherwise would have had. A negative polarity (–) indicates that the relationships are inverse. The small parallel lines crossing one arrow are a ‘delay mark’ – they indicate that the effect of a change in the level of the driver variable will take a relatively long time to appear. The encircled ‘B’ indicates a balancing feedback loop, and the encircled ‘R’ indicates a reinforcing feedback loop. Provided that these rules of ‘visual grammar’ are followed, CLDs can help articulate dynamic hypotheses that account for the response of a health system to imposed policy and management initiatives.
A causal loop diagram (CLD). This diagram depicts the story of the fight against increasingly prevalent antibiotic-resistant bacteria. An increase in the incidence of serious bacterial infections leads to an increase in the volume of antibiotics prescribed. The prescription of antibiotics leads to a reduction in the incidence of serious infections. At the same time, however, the increased use of antibiotics increases the evolutionary pressure on bacterial populations, leading to an eventual increase in the richness and abundance of drug-resistant species and a consequent increase in the incidence of serious infections. While the latter effect takes time to appear, it eventually dominates.

From a system dynamics point of view, ‘[the] feedback loop is the … basic unit of analysis and communication of system behaviour’ (Reference RichardsonRichardson, 1991). There are just two types of feedback: reinforcing loops that amplify change and balancing loops that resist change. The generic structures shown in Figure 2.3 illustrate these cases. In panel (a), reinforcing feedback exists when an increase/decrease in the level of variable A causes an increase/decrease in the level of variable B, which causes a further increase/decrease in A, and so on, around the loop. This causal structure drives accelerating growth (or accelerating collapse) of both A and B. In panel (b), balancing feedback occurs when management efforts (or natural processes) work to hold the level of variable D close to a particular goal. The case shown represents the situation where D lies above the goal. An increase in C causes an increase in D. This change in D increases the gap between D and the goal, which triggers mechanisms that work to reverse the change in C and so bring D back towards the goal. The goal may be deliberately set (e.g. the chosen setpoint on a thermostat), an outcome of the collective interactions among many actors (e.g. how much money one is expected to spend on a birthday present) or a systemic level that may be natural or anthropogenic (e.g. the body temperature maintained by homeostasis).

Influence diagrams (IDs) (Figure 2.4) are the simplest systems thinking tool offered by system dynamics. They are similar to CLDs but do not have polarities assigned to their causal links. This makes them suitable for initial discussions where some polarities may be uncertain and difficult to determine.
An influence diagram (ID). This example represents a feedback loop where Time spent exercising affects Level of physical fitness. This change affects Enjoyment of exercise, which leads to a further change in Time spent exercising – and so on around the loop. IDs do not have polarities assigned to influence links.

IDs provide a flexible means of articulating assumptions about cause–effect structure. Thus they can function as a visual cause–effect language supporting a team’s early efforts to co-develop knowledge. Individual team members can use IDs to describe their assumptions about the boundaries and causal structure of their system of interest. The team can then use the collection of individual diagrams to explore similarities and differences in their thinking about (mental models of) the system (Reference Newell, Proust and KönigNewell & Proust, 2018).
Overall, system dynamics can support a wide spectrum of activities. At the systems thinking end of the spectrum, the collaborative development of IDs or CLDs can help any multi-disciplinary team co-develop hypotheses concerning system structure and behaviour (Reference Newell and ProustNewell & Proust, 2012; Reference Newell, Proust and König2018). The systems thinking principles listed in Box 2.2 summarise a typical system dynamics perspective.
1. The Feedback Principle: Feedback effects are dominant drivers of behaviour in any health system.
2. The Holistic Principle: The behaviour of a health system emerges from the feedback interactions between its parts and therefore cannot be optimised by optimising the behaviour of its parts individually.
3. The Inertia Principle: The filling and draining of stocks is a pervasive process in health systems. The presence of stocks causes delayed responses, thereby giving rise to system inertia.
4. The Surprise Principle: Any action taken in a health system will have multiple outcomes, some expected and some unexpected. The expected outcomes might occur — unexpected outcomes will always occur. The unexpected outcomes are usually unwanted and delayed — the delays make it difficult to identify the triggering actions.
5. The History Principle: Knowledge of past activities and patterns of behaviour is essential in any attempt to understand how a health system works.
6. The Myopia Principle: No one person can see the whole of a health system.
7. The Collaboration Principle: The boundaries of a health system cut across the boundaries of traditional disciplines, organisations, governance sectors and sub-cultures. An effective systems approach therefore requires deep collaboration between people with different backgrounds, worldviews, values and allegiances.
At the system modelling end of the spectrum, working stock-and-flow models can support exploration of the dynamics of various complex system structures. In practice, policy development needs to begin at the systems thinking end of the spectrum with a broad investigation of potentially relevant variables and interactions. How far the team can then progress toward quantitative modelling (and the desirability of attempting to do so) depends on many factors, including the nature of the system of interest, the availability of reliable historical data and the team members’ skills and experience.
The use of system dynamics can provide a coherent way to facilitate iterative problem exploration and framing. This helps ensure that governance problems are addressed at the right level. It also supports co-production of new knowledge by a multi-disciplinary team, a process that leads to better policies. It is important to note, however, that system dynamics and system models are not a panacea for health systems improvement. The utility of any diagrams or models will be limited by the team’s knowledge of the system of interest.
2.3 Application of the Systems Dynamics Approach in This Publication
Using the Malaysian health system as an example, this book illustrates the use of a systems dynamics approach in health systems analysis. We address the two challenges identified above, namely, engaging non-systems experts and creating a useful system model of the health system. In doing this we also address the learning goals described in Chapter 1.
This book is a product of collaboration between experts across government policy, the private sector, health experts and academics. The process involved sustained engagement and collaboration between health experts and systems thinkers through discussion, debate and iteration towards a genuinely co-produced and co-owned product with capacity-building as a further by-product. We suggest that this approach could be considered for use as a model for endeavours in this field (see Reference StermanSterman, 2000, chapter 3).
Section II discusses the development of the Malaysian health system. Chapter 3 provides an overview of the larger historical context for the Malaysian health system, followed by an analysis of the individual building blocks of the health system (Chapters 4–12). The service delivery building block is divided into four thematic areas: primary care, secondary and tertiary care, disease control, and environmental health.
Two collaborative approaches between health experts and systems thinkers were taken in applying systems thinking in Section II. The first was used to examine the development of the overall health system building blocks. Each of the health system building block chapters begins with an overview of the development of that building block. The documentation of the development of the Malaysian health system and the lessons learned were led by health experts, who undertook a process of document review and interviews in consultation with the editorial team.
Examining the development of the health system building blocks over the past 60 years was a substantial challenge. Documentation of many important events in the earlier development of the Malaysian health system was scarce and located largely in the grey literature. Thus the health experts and the editorial team relied on individuals with knowledge of the grey literature and with first-hand experience of the key events. These histories are thus selective due to methodological limitations, but also because of space constraints. Nonetheless, they are critical for identifying trends and patterns that provide systemic insights into the development of the health system. In describing the development of each building block, emphasis was placed on linkages with other building blocks and with important drivers, enablers and obstacles outside the health system. The systems thinkers then reviewed these findings to derive systemic observations from the histories.
The second approach was used in the case studies that address significant systemic interventions, problems or events within individual building blocks. Here, the health experts and systems thinkers undertook a more in-depth co-production process for developing the case studies, using the methodology described by Reference Tan, Siri, Gong, Ong, Lim and MacGillivrayTan et al. (2019). While we endeavoured to have at least one case study for each health system building block, case study selection was largely driven by the availability of health experts willing to engage in the process and the extent of their expertise. Accordingly, the case studies are not an attempt to provide a comprehensive overview of issues in health systems or in systems thinking.
An iterative sense-making process was used to determine the system of interest in each case study; it involved: (1) narrative problem framing by the health experts; (2) interrogation of the narrative by the systems thinkers to discover interrelations, causal links, feedback and emergence; and (3) development of CLDs by the systems thinkers to represent the narrative developed by the health experts. The preliminary CLDs often served as a mirror that helped the health experts refine or revise their problem framing. When this process was complete, the feedback structures in the CLDs were analysed to improve understanding of the systemic issues, problems and enablers seen in the case studies.
The choice of approaches maximised the goals of the publication within the time and resource constraints. The case studies provided a sufficiently well-defined problem space for the health experts and systems thinkers to engage in meaningful co-production within a limited timeframe. The different levels of systems insights from the two approaches provide an example of what can be achieved at varying levels of investment into system analysis. The case studies illustrate how a problem-based approach works – regardless of the level of the problem.
To obtain a full range of perspectives, including both the historical development of the building blocks and the case studies, a series of stakeholder meetings was convened for comments and critique. Several of these meetings revealed very different perspectives concerning some issues. These differences were shaped by differences in experience and understanding that reflected the position from which individual stakeholders had engaged the issue. The input from these meetings led to further investigation of disputed data and iteration of system analysis.
Section III of this book consolidates the learnings from the investigations reported in Section II. Chapter 13 synthesises key health system development lessons from experience generated within the Malaysian health system. These lessons should be relevant to health systems worldwide, especially those in LMICs. Chapter 14 reflects on lessons concerning the application of systems thinking to health systems. There, we attempt to derive a broad, systemic model of health systems that connects the system models developed in the tightly defined problems of the case studies. By combining a whole-systems approach with detailed case studies, we hope to provide multiple examples of how systems methodologies can be applied at all levels of health systems strengthening to produce outputs and understandings that are accessible to all.


 Open access