


INTRODUCTION
In the past 15 years, the amount of research investigating the cognitive correlates of bilingualism has increased exponentially. Much research has focused on the effect of bilingualism on domain-general cognitive skills and, in particular, executive functions (henceforth EFs)—see, for instance, two recent keynote articles by Baum and Titone (Reference Baum and Titone2014) and Valian (Reference Valian2015).
Miyake and colleagues’ seminal work (Friedman et al., Reference Friedman, Miyake, Corley, Young, DeFries and Hewitt2006; Miyake et al., Reference Miyake, Friedman, Emerson, Witzki, Howerter and Wager2000) originally divided EFs into three separable components: the updating and monitoring of working memory (WM) representations, the shifting between tasks and mental sets, and the inhibition of unwanted responses. These three components are dissociable (featuring unique variance) but interrelated (featuring common variance) (Miyake et al., Reference Miyake, Friedman, Emerson, Witzki, Howerter and Wager2000). This means that, in practice, it is impossible to test one component to the complete exclusion of others. This tripartite view has now been superseded by a revised model in which two specific components are distinguished (i.e., updating and shifting, as defined in the preceding text), in addition to a third component that is common to both, defined as the “ability to actively maintain task goals and goal-related information and use this information to effectively bias lower-level processing” (Miyake & Friedman, Reference Miyake and Friedman2012, p. 12). Valian (Reference Valian2015) proposes to interpret this common factor variable as inhibition. We will adopt this label in the remainder of the paper.
EF development has been shown to span several important stages of maturation from early childhood (Garon, Bryson, & Smith, Reference Garon, Bryson and Smith2008) to adolescence (Brocki & Bohlin, Reference Brocki and Bohlin2004). In adults, EF has been shown to decline with age (Bryan & Luszcz, Reference Bryan and Luszcz2000; Buckner, Reference Buckner2004).
A growing body of evidence suggests that bilingual experience confers an EF advantage. Specifically, the constant need to control one language while using the other (Kroll, Dussias, Bogulski, & Valdes Kroff, Reference Kroll, Dussias, Bogulski, Valdes Kroff and Ross2012) is claimed to exercise the neurological mechanisms underlying attention control, which results in the enhancement of bilinguals’ abilities in that domain (see, e.g., Bialystok, Reference Bialystok1999). Abutalebi and colleagues (Reference Abutalebi, Della Rosa, Green, Hernandez, Scifo, Keim and Costa2011) show that early bilinguals use fewer brain resources for conflict monitoring, causing changes in brain structure in a region used for language control and for the resolution of nonverbal conflict (see Abutalebi & Rietbergen, Reference Abutalebi and Rietbergen2014 for a review). Bilingual experience has been argued to enhance structural connectivity, thereby contributing to the constitution of a cognitive reserve protective against decline in old age (Luk, Bialystok, Craik, & Grady, Reference Luk, Bialystok, Craik and Grady2011).
However, the bilingual literature features a discrepancy between studies that found an EF advantage for bilinguals and those that have not, using seemingly comparable methodologies. This contribution focuses specifically on children, for whom the bilingual advantage appears even more difficult to pin down than for adults (see Valian, Reference Valian2015 for a review). It explores alternative analytical methods that allow disentangling the effect of bilingual experience from other factors influencing EF (“thinking multifactorially from the outset”—Titone, Pivneva, Sheikh, Webb, & Whitford, Reference Titone, Pivneva, Sheikh, Webb and Whitford2015, p. 44), using a gradient, composite measure of bilingual experience.
Updating is standardly operationalized as WM, which is the ability to retain information while performing mental operations (Baddeley, Reference Baddeley2000). Out of the three EF components identified in the preceding text, it is the one for which a bilingual advantage has been the most inconsistent. On the one hand, a few studies do report a bilingual advantage in terms of WM. Bilingual 5- to 7-year-olds have been shown to outperform monolingual controls on tasks requiring different levels of WM (Morales, Calvo, & Bialystok, Reference Morales, Calvo and Bialystok2013). The advantage has also been shown to extend to sequential bilingual children of similar age but low socioeconomic status (SES), if SES and vocabulary were controlled (Blom, Küntay, Messer, Verhagen, & Leseman, Reference Blom, Küntay, Messer, Verhagen and Leseman2014)—although the advantage was only found in the 6-year-old group, not the 5-year-old group. On the other hand, a bilingual advantage was not found by Engel De Abreu (Reference Engel De Abreu2011) in a study comparable to that of Morales and colleagues (Reference Morales, Calvo and Bialystok2013), involving 5- to 6-year-old children of similar SES and using similar (visuospatial) tasks.
Shifting concerns the ability to shift between mental sets or tasks (Miyake et al., Reference Miyake, Friedman, Emerson, Witzki, Howerter and Wager2000). It is typically investigated with card-sorting tasks, in which the sorting must be done according to different dimensions (e.g., shape and color) and the relevant dimension changes across trials, with dimensional change patterns varying across blocks of trials (i.e., single-task vs. mixed-task blocks). Timed implementations of such task-switching paradigms allow the evaluation of switching costs and mixing costs. Switching costs correspond to longer reaction times in switching trials compared with repetition trials in the mixed-tasks blocks (Monsell, Reference Monsell2003). Mixing costs correspond to longer reaction times in repetition trials in the mixed-task blocks compared with trials in the single-task blocks (Los, Reference Los1996). Switching costs are assumed to reflect transient control mechanisms, whereas mixing costs are assumed to reflect global sustained control mechanisms. Bilingual children have been shown to perform significantly better than monolingual controls in the Dimension Change Card Sort (DCCS) task (described in detail in the following text). The advantage was observed in highly bilingual 3- to 6-year-olds, controlling for vocabulary and WM (Bialystok, Reference Bialystok1999; Bialystok & Martin, Reference Bialystok and Martin2004), and in highly bilingual 5- to 7-year-olds (Carlson & Meltzoff, Reference Carlson and Meltzoff2008), controlling for vocabulary, and despite lower SES of the bilingual group. By contrast to these positive findings, Mueller Gathercole and colleagues (Reference Mueller Gathercole, Thomas, Kennedy, Prys, Young, Viñas Guasch and Jones2014) did not find a consistent bilingual advantage in their large-scale study involving 650 participants from seven age groups who “grew up in the same context” (p. 3) in North Wales. Participants were classified according to language dominance, which was determined based on the patterns of language use in their home (Only Welsh Homes; Welsh and English Homes; English Only Homes). Card-sorting tasks of age-adapted complexity level did not reveal an overall bilingual advantage in terms of accuracy or reaction time. An analysis based on difference scores only revealed a possible bilingual advantage in the teen group from Only Welsh Homes compared with their peers. In terms of absolute scores, the same group showed inferior accuracy compared with their peers, but faster reaction times.
Inhibitory control is the ability to resist interference (Dempster, Reference Dempster1992). This EF component has received the most attention in the literature on bilingualism (see Hilchey & Klein, Reference Hilchey and Klein2011 for an in-depth, critical review). This was sparked by a seminal paper by Green (Reference Green1998), which argued that language control in bilinguals resembles the control of action and proposed the Inhibition Control model to account for the control of language in bilinguals specifically. This model assumes that inhibitory control is required to suppress the irrelevant language (in a given task). Subsequent research has shown that the suppression of a bilingual’s dominant language was costlier than that required to suppress their weaker language (Meuter & Allport, Reference Meuter and Allport1999). Under the assumption that the constant need to control their languages exercises bilinguals’ domain-general inhibitory control abilities, it was then hypothesized that bilinguals would show an advantage over monolinguals in nonverbal tasks probing inhibition. This is standardly assessed using the Simon task (see following text) or the flanker task (Eriksen & Eriksen, Reference Eriksen and Eriksen1974). The incongruent condition in both types of task requires participants to suppress irrelevant visual information (such as the position of a colored block in the Simon task, or arrows pointing in the opposite direction to the target arrow in the flanker task). The inhibitory control hypothesis predicts that bilinguals will show an advantage in the incongruent condition only. The so-called Simon effect is the difference in response speed between the incongruent condition and the congruent condition. Bilinguals are expected to experience a smaller Simon effect than monolinguals as they are better at controlling the conflicting information.
The Simon effect has hardly ever been reported in children. An exception is Poarch and van Hell (Reference Poarch and van Hell2012), who found a significant Simon effect in trilingual 5- to 7-year-olds, and a marginally significant Simon effect in bilingual 5- to 7-year-olds, but not in the monolingual controls. Several studies in which no Simon effect was observed nonetheless report a bilingual advantage in terms of reduced reaction times in both congruent and incongruent conditions, so long as the task was sufficiently demanding and included response competition. This global Reaction Time (RT) advantage has been found in 5-year-olds (Bialystok, Martin, & Viswanathan, Reference Bialystok, Martin and Viswanathan2005; Martin-Rhee & Bialystok, Reference Martin-Rhee and Bialystok2008). A similar global RT advantage was also observed in the flanker task in 8-year-old bilinguals (Engel de Abreu, Cruz-Santos, Tourinho, Martin, & Bialystok, Reference Engel de Abreu, Cruz-Santos, Tourinho, Martin and Bialystok2012) and in 4-year-old bilinguals compared with three monolingual control groups based on culture (i.e., imposing self-regulation of behavior or not) (Yang, Yang, & Lust, Reference Yang, Yang and Lust2011).
By contrast to the positive results reported in the preceding text, Morton and Harper (Reference Morton and Harper2007) found no bilingual advantage in the Simon task in a group of 6- to 7-year-olds. They attribute this lack of difference to the control for SES. In a design that carefully controlled for age, nonverbal IQ, SES (indexed by maternal education), receptive vocabulary, receptive morphosyntax, and short-term memory (STM), Namazi and Thordardottir (Reference Namazi and Thordardottir2010) also found no bilingual advantage in the Simon task in terms of accuracy or speed. Instead, both were predicted by the children’s WM scores on a pattern recall task. Several large-scale studies using a variety of tasks probing inhibitory control did not find a bilingual advantage either (e.g., Antón et al., Reference Antón, Duñabeitia, Estévez, Hernández, Castillo, Fuentes and Carreiras2014; Duñabeitia et al., Reference Duñabeitia, Hernández, Antón, Macizo, Estévez, Fuentes and Carreiras2015—see Paap, Reference Paap2014 for an in-depth review).
It has been claimed that the bilingual advantage in inhibitory control is particularly elusive in young children (Hilchey & Klein, Reference Hilchey and Klein2011). In their meta-analysis of 39 studies, Donnelly, Brooks, and Homer (Reference Donnelly, Brooks, Homer and Noelle2015) ascertained the existence of a moderate but statistically significant bilingual advantage overall on global reaction time and interference costs from conflict resolution tasks. However, different effects emerged at different ages, and in children, larger effect sizes for global reaction times were observed, compared with interference costs.
In the 34 studies that they review, Paap, Johnson, and Sawi (Reference Paap, Johnson and Sawi2014) observe that the bilingual advantage tends to be found in studies with small sample sizes and argue that the lack of a significant effect in large-sample studies coupled with significant effects in small-sample studies is worrisome (as it is unexpected given the properties of null hypothesis statistical testing). Donnelly and colleagues (Reference Donnelly, Brooks, Homer and Noelle2015) also reveal a significant lab effect across studies, which they speculate could be due to sociolinguistic differences of subject pools or different data-preparation methods, such as outlier removal.
How should one interpret the contradictory findings regarding the hypothesized bilingual advantage in EF abilities? The extent of the lack of replicability of findings is not known, given that null results tend not to be published (Adesope, Lavin, Thompson, & Ungerleider, Reference Adesope, Lavin, Thompson and Ungerleider2010; de Bruin, Treccani, & Della Sala, Reference de Bruin, Treccani and Della Sala2015). It is therefore impossible to draw a conclusion based on the balance between results and null results. Matters are complicated further by the methodological differences across studies, and in particular by differences in how possible confounds are considered (Paap & Sawi, Reference Paap and Sawi2014).
SES might have acted as a confound in some studies (as suggested by Hilchey & Klein, Reference Hilchey and Klein2011). Socially advantaged 4- to 7-year-old children have been shown to perform faster than their age-matched peers in terms of accuracy and speed in a flanker task (Mezzacappa, Reference Mezzacappa2004), and parental level of education has been shown to predict children’s development of EFs (Ardila, Rosselli, Matute, & Guajardo, Reference Ardila, Rosselli, Matute and Guajardo2005; Merz et al., Reference Merz, Landry, Williams, Barnes and Eisenberg2015). Several studies controlling for SES indeed found no bilingual advantage (e.g., Duñabeitia et al., Reference Duñabeitia, Hernández, Antón, Macizo, Estévez, Fuentes and Carreiras2015; Morton & Harper, Reference Morton and Harper2007; Paap & Greenberg, Reference Paap and Greenberg2013). However, evidence also exists of a bilingual advantage in socioeconomically deprived children (Calvo & Bialystok, Reference Calvo and Bialystok2014; Engel de Abreu et al., Reference Engel de Abreu, Cruz-Santos, Tourinho, Martin and Bialystok2012).
Differences between children and adults are to be expected, given the protracted development of EFs. Important stages of EF maturation have been identified in the preschool years (Hongwanishkul, Happaney, Lee, & Zelazo, Reference Hongwanishkul, Happaney, Lee and Zelazo2005) and between the ages of 6 and 13 (Brocki & Bohlin, Reference Brocki and Bohlin2004). For instance, this might contribute to explaining the paucity of evidence for the Simon effect in children but not in older adults (e.g., Bialystok et al., Reference Bialystok, Martin and Viswanathan2005).
Various types of experience that are not usually controlled for in experiments probing EF performance also have a significant effect. Acute physical activity, for instance, has been shown to affect EF performance positively in 6- to 10-year-olds (Best, Reference Best2012). Musical training (Moreno et al., Reference Moreno, Bialystok, Barac, Schellenberg, Cepeda and Chau2011) and physical exercise (Diamond & Lee, Reference Diamond and Lee2011) have also been shown to have a positive effect. Psycho-emotional factors such as lack of sleep, stress, and loneliness also impact EF performance, in this case negatively (Diamond, Reference Diamond2011).
Most importantly, the level of bilingualism of the populations tested is not reported consistently across studies. This is partly due to the lack of a consensus as to how bilingual experience should be measured (see, e.g., Bedore et al., Reference Bedore, Peña, Summers, Boerger, Resendiz, Greene and Gillam2012 on assessing language dominance). Several aspects known to vary in bilingual experience have been argued to have an effect on EF performance, such as proficiency (Gutiérrez-Clellen, Calderón, & Ellis Weismer, Reference Gutiérrez-Clellen, Calderón and Ellis Weismer2004; Iluz-Cohen & Armon-Lotem, Reference Iluz-Cohen and Armon-Lotem2013; Rosselli, Ardila, Lalwani, & Vélez-Uribe, Reference Rosselli, Ardila, Lalwani and Vélez-Uribe2015), language dominance (Mueller Gathercole et al., Reference Mueller Gathercole, Thomas, Kennedy, Prys, Young, Viñas Guasch and Jones2014; Weber, Johnson, Riccio, & Liew, Reference Weber, Johnson, Riccio and Liew2015), language exposure (Brito, Sebastián-Gallés, & Barr, Reference Brito, Sebastián-Gallés and Barr2015), and patterns of language switching (de Bruin et al., Reference de Bruin, Treccani and Della Sala2015; Scaltritti, Peressotti, & Miozzo, Reference Scaltritti, Peressotti and Miozzo2015; Soveri, Rodriguez-Fornells, & Laine, Reference Soveri, Rodriguez-Fornells and Laine2011; Verreyt, Woumans, Vandelanotte, Szmalec, & Duyck, Reference Verreyt, Woumans, Vandelanotte, Szmalec and Duyck2015). Several researchers are now calling for the integration of the variability of bilingual experience in the analyses (e.g., Kaushanskaya & Prior, Reference Kaushanskaya and Prior2015), to account for the whole spectrum of language experience, from monolingualism to the highest levels of bilingualism (Luk, Reference Luk2015). Our study takes up this challenge.
AIMS OF THE PRESENT STUDY
This study aims to investigate the EF correlates of childhood bilingualism in a highly heterogeneous sample in terms of bilingual experience and SES. We sought to embrace the heterogeneity of bilingual experience rather than control for it as an inclusion criterion; this was achieved by using a gradient measure of bilingual experience that encompasses both exposure (input) and production (output). We also sought to disentangle the effect of bilingualism from that of other factors (such as SES, proficiency in English, STM, WM, and gender); this was achieved by incorporating them into the analysis. To achieve maximum comparability with other studies, we relied on widely used tasks.
A key aim is to explore and exploit new methods of analysis to better achieve the objectives listed in the preceding text. On the one hand, we exploit linear regression to model the additive effect of all the predictors, thereby isolating the specific effect of bilingual experience (or “adjusting” its effect considering other significant factors). On the other hand, we exploit the Cox Proportional Hazard (PH) model to capture accuracy and speed within a single analysis of performance in the Simon task, while exploring the additive effect of all predictors. Two additional advantages of the Cox PH model are (a) that it does not require the exclusion of any observation, and (b) that it can consider the auto-correlation between trials.
The use of modeling techniques and the operationalization of bilingualism as a continuum allow us to identify the threshold from which the performance of bilingual children differs from that of monolingual children. In that way, we aim to contribute to bridging the gap between studies identifying bilingual advantages and studies reporting null results, thereby starting to answer the question as to how bilingual one needs to be to benefit from a cognitive advantage.
Methods Participants
We recruited 174 children attending year 1 or 2 of primary school in the North of England, including 87 monolinguals and 87 children with some amount of exposure to a home language other than English. For convenience, we will refer to these groups as the “monolinguals” and the “bilinguals,” respectively—even though the language experience of children at the lower end of the bilingualism spectrum is hardly distinguishable from that of monolinguals. Forty-one children were sequential bilinguals.Footnote 1 Table 1 summarizes the distribution of the two groups in gender and age. All children were developing typically and did not have any known hearing deficit.
Distribution in gender and age (in years and months)

The language of schooling was English for all the children. The bilingual children were also exposed to another language (henceforth the home language) in varying degrees (see following text). There was a total of 28 home languages in our sample:Footnote 2 Arabic (9%), Bengali, Cantonese, Catalan, Dutch, Farsi, and French (8%); Greek, Hindi, Italian, Kurdish, Mandarin, Marathi, Mirpuri, Nepalese, Pashto, Polish, Portuguese, and Punjabi (21%); Shona, Somalian, and Spanish (6%); and Swedish, Tamil, Telugu, Thai, Tigrinya, and Urdu (17%).
Socioeconomic Profiles
The SES of the children’s families was estimated based on information gathered through a parental questionnaire. Two measures were obtained: one for Levels of parental education (1), one for parental level of current occupation. The highest level was chosen in each case (on the assumption that the status of the household was determined by the best educated parent and the highest occupation among the parents).

The occupational data were scored using the reduced method of the National Statistics Socio-economic Classification (simplified NS-SEC—see Table 14 in the Appendix), which is based on the Goldthorpe Scheme of sociological classification. For each family, the highest current occupation was selected, as recommended by the NS-SEC guidelines, and entered into a 48-point ranking scale. The score obtained was reversed for ease of interpretability (being positively correlated with educational level).
The proxy measures for SES are strongly and significantly associated, as shown in Table 2 (χ 2(4, N = 174) = 83.57, p < 0.0001). We subsequently used the simplified NS-SES measures in all our analyses as it afforded the possibility of capturing SES as a continuous variable (based on the 48-point scale).
SES measures (reduced to three levels): education by occupation. Correspondence with NS-SEC categories listed in Table 14: High < 7, Low ≥ 10

Quantifying Bilingual Experience
To quantify bilingual experience as a continuum, we used the Bilingualism Profile Index (BPI) (De Cat & Serratrice, forthcoming). The BPI encapsulates children’s cumulative exposure to an “additional” language (i.e. additional to the language of schooling) as well as their active (cumulative) use of that language.Footnote 3 Because English is the language of schooling, we assumed it was (or had become) a language actively used by all children. Greater variability was therefore expected in the exposure to and use of the home language (which, for many children, would be the weaker language). The BPI intends to apprehend that variability of bilingual experience, and can be interpreted as a gradient measure of language dominance (De Cat & Serratrice, forthcoming).
The BPI is a composite score of cumulative input and cumulative output in the home language, derived by a standard measure of dimensionality reduction, that is, Principal Component Analysis (PCA). The PCA of cumulative input and cumulative output yields two principal components, the first of which captures most of the variability (given the strength of the correlation between the two cumulative measures). In our data, the first component captured 98% of the variability, so it can be interpreted as a reliable measure combining the two cumulative (input and output) measures. The BPI scores correspond to the loadings of that first component.Footnote 4 It can be interpreted as a measure of the child’s experience of their home language (with a score of 0 indicating monolingualism).
Figure 1 shows the correlation of the BPI with current and cumulative measures of input and output in the home language. The amount of dispersion from the linear relationship between the BPI and each of the cumulative measures shows that it is not reducible to either of these measures. The BPI is also very strongly correlated with the age of onset of exposure to an additional language (r = .85, p < 0.0001). This correlation is much stronger than that between current input and onset of exposure to an additional language (r = .51, p < 0.0001).
The BPI and its relationship with input and output measures in the home language.

In De Cat and Serratrice (forthcoming) we provide independent validation for the BPI by predicting the BPI scores (using linear regression) from factors not used to derive the BPI but standardly assumed to predict levels of bilingualism, such as home environment (e.g., one-parent one-language), bilingualism onset, and length of exposure. We also demonstrate that, although based on estimates of experience in the home language, the BPI predicts proficiency in the language of schooling (English).
In summary, our sample ranges across an evenly distributed continuum of bilingual language experience, as indexed by the BPI score. At the lower end, some children had a very limited experience in a language other than English. At the higher end, some children were late bilinguals, having only experienced the home language until their first significant exposure to English at primary school. Current exposure to a language other than English ranges from 9% to 89% in our sample.
A weak but significant negative correlation was observed between the level of bilingualism and SES (based on the occupational classification): r = −.25, p = 0.0009.
PROFICIENCY
The EF tasks used in this study did not rely on language production from the participants (except for the use of numbers in the memory tasks), but the instructions were given in English. It is therefore possible that children’s proficiency in English could have an impact. For that reason, we assessed their global proficiency with a sentence repetition task (the short version of the School-Age Sentence Imitation Test—Marinis, Chiat, Armon-Lotem, Gibbons, & Gipps, Reference Marinis, Chiat, Armon-Lotem, Gibbons and Gipps2010), which was originally designed to identify children at risk of Specific Language Impairment in bilingual populations.Footnote 5 The distribution of scores is shown in Table 3. See De Cat and Serratrice (forthcoming) for analysis of this and other proficiency tests in the present sample of participants.
Distribution of scores in the sentence repetition task, by group

Measures of Executive Function Abilities
Updating.
Measures of STM and WM were obtained from the Digit Span tasks (Wechsler Intelligence Scale for Children III, Wechsler, 1991). The use of numerical memoranda has been shown to be relatively independent of test language and cultural status (Engel de Abreu, Baldassi, Puglisi, & Befi-Lopes, Reference Engel de Abreu, Baldassi, Puglisi and Befi-Lopes2013). In those tasks, the examiner verbally presents digits that the child must repeat in the same order (in the Forward Digit Recall task) or in reversed order (in the Backward Digit Recall task). The number of digits increases by one until the child consecutively fails two trials of the same digit span length. There were four trials per digit span.
The Forward Digit Span measure was used as a proxy for children’s episodic buffer capacity (i.e., STM). The Backward Digit Span measure was used as a proxy for children’s updating abilities (i.e., WM).
Shifting.
To assess children’s flexible use of rules to govern behavior, we administered the DCCS task. The protocol was as described in Zelazo (Reference Zelazo2006). The child was presented in each trial with a picture representing either a rabbit or a boat, that was either blue or red, and asked to place the card in one of two boxes according to a sorting rule (by shape or by color). The boxes were identified by either a blue rabbit or a red boat. The first block trials (N = 6) required using the shape criterion, and the second block (N = 6) required using the color criterion. As the children in our sample were older than 5, we also administered a more advanced block of trials (N = 12) in which a star appeared on some of the cards. Cards without a star had to be sorted according to the shape dimension, and cards with a star had to be sorted according to the color dimension. The repetition of instructions on every trial (in all blocks) ruled out the possibility that difficulty could be attributed to hypothesis testing or memory of the relevant rules. The test session was preceded by a demonstration and two practice trials. The test trials were presented in two counterbalanced orders.
Inhibition.
Inhibition was assessed with computer-based version of the Simon task (Simon, Reference Simon1969), programmed and run using E-Prime software. This task manipulates the compatibility of stimulus and response according to two dimensions: color and position. To perform accurately on critical trials, participants must inhibit the prepotent association of irrelevant position information and focus on color information exclusively. Children were sat in front of a computer (Toshiba Satellite L-855 laptop with a 15.6” screen) with an E-Prime serial response button box featuring a green button and a red button.Footnote 6 They were asked to press the button whose color matched that of a square as fast as possible after it appeared on the screen. In the matching condition, the color of the square was aligned with the position of the button (i.e., left for red, right for green). In the mismatching condition, the square was aligned with the button with the wrong color. Children were asked to respond as fast as possible, and their reaction time was recorded. There was no neutral condition (in which the colored square would appear centrally). Children started with an 8-trial practice session, immediately followed by 48 test trials. Comparison with other protocols is summarized in Table 4.
Number of critical trials in the Simon task: cross-study comparison

1 In addition to these critical trials, there were 42 items in a neutral condition, in which the colored square was presented centrally.
ANALYSIS
For the results of the WM task and the switching task (DCCS), we fitted linear models using packages lme4 (version 1.1.11) and ordinal (2015.6.28) in R (3.2.4). The models were built by adding factors incrementally; factors were retained only if they improved the fit of the model, yielding a significant reduction in Akaike Information Criterion (AIC)Footnote 7 and a significant R-squared value for the model. This allowed the data to determine which variables and interactions were justified in the model, through systematic testing. The same procedure of incremental model building was adopted in the Cox PH analysis of the Simon task results (which is explained in detail in the following relevant section). All model summary tables report the statistics for the optimal model. Statistics for each nonsignificant variable or interaction of interest were computed by adding it back to the optimal model. These are reported in the text only.
The following variables were tested for inclusion in all models:Footnote 8 BPI, SES (occupational score), STM (forward digit recall score), Proficiency (Sentence Repetition score), Age (in months), and Gender, as well as interactions between these variables. Additional, task-specific predictors were also considered, as explained in the following relevant sections. Age was centered in all analyses to make the value at the intercept interpretable (i.e., not zero months but the average age) and mitigate its correlation with other variables.
Results Updating
Three (bilingual) children failed the WM test: They did not manage to reverse even two digits. One of them also failed the DCCS test. The three children were excluded from the analysis of the memory measures. The raw results prior to this exclusion are summarized in Tables 5 and 6.
Forward Digit Recall (digits correctly recalled)

Backward Digit Recall (digits correctly reversed)

To account for the fact that memory increases with age, we divided the forward digit span score and the backward digit span score by age (in months).Footnote 9 This turned them into continuous measures capturing STM and WM regardless of Age (assuming that increment in STM and WM is linear with Age). These new measures were used as dependent variables in the linear regression analyses reported in the following text.
As shown in the optimal model reported in Table 7, the only significant predictor of the WM score was STM (t(181) = 54.15, p < 0.0001). Neither BPI (t(181) = −0.29, p = 0.77) nor SES (t(181) = −0.40, p = 0.69) reached significance, and there were no significant interactions. The model accounted for 94% of the variance (R 2 = 0.94).
Coefficients of the linear regression model fitted to the Backward Digit Recall score divided by Age

As the strongest predictor of WM, the STM performance is interesting to model in its own right. It was found to be predicted by SES (t(181) = 2.94, p = 0.004) and gender, with boys performing less well than girls (t(181) = −2.18, p = 0.03), as shown in Table 8. BPI was not a significant predictor (t(181) = 0.80, p = 0.42). The model accounted for 6% of the variance (R 2 = 0.06).
Coefficients of the optimal linear regression model fitted to the Forward Digit Recall scores divided by Age

SHIFTING
We adopted the method recommended by Zelazo (Reference Zelazo2006) to analyze the DCCS data. It assigns a score between 0 and 3 based on a pass-fail criterion on each trial block. Passing the first two blocks requires sorting at least five out of six cards correctly (on each block). Passing the third block requires sorting at least 9 out of 12 cards correctly. A child is assigned a score of 0 if they fail the preswitch block, a score of 1 if they pass the preswitch block only, a score of 2 if they also pass the postswitch block, and a score of 3 if they pass all three blocks.
Little variability is observed, as shown in Table 9, as many children performed at ceiling. Only one (bilingual) child did not pass the first block, and was excluded from analysis (as he was not able to perform the task).
Distribution of overall DCCS scores (based on block pass-fail)

We fitted an ordinal Cumulative Link Model to the DCCS overall 0–3 score (to capture the order of the dependent variable’s levels). The optimal model is summarized in Table 10. Performance in the DCCS was predicted by (a) the child’s SES in bilingual children only (Z = 1.98, p < 0.05), (b) the age of the child (Z = 3.58, p < 0.001), and (c) the child’s proficiency in English (Z = 4.02, p < 0.001). WM approached significance (Z = 1.65, p = 0.10). BPI did not reach significance (Z = 0.38, p = 0.70).Footnote 10 Importantly, despite a significant correlation between BPI and Proficiency score (r = −.49, p < 0.001), BPI does not turn out as a significant predictor even in the absence of Proficiency, or in interaction with it.
Coefficients of an ordinal Cumulative Link Model fitted to the DCCS overall score. Reference level: Bilingual = no

INHIBITION
As expected, incongruent trials in the Simon task resulted in lower accuracy in average (as shown in Table 11), and slower reaction time (shown in Table 12 for accurate responses only).
Accuracy of responses in the Simon task

Speed of accurate responses in the Simon task

Issues with Traditional Analyses
Reaction time data is known to feature a positively skewed distribution, as the scale is bounded on the left (i.e., one cannot respond faster than X number of milliseconds) but not to the right (i.e., response can be delayed for a variety of reasons). Performance in the Simon task is usually analyzed by comparing mean reaction times across conditions (congruent vs. incongruent) and across groups (e.g., bilingual vs. monolingual)—as done in all the relevant studies cited in the preceding text. This assumes that the data is normally distributed (which it isn’t, as explained in the preceding text). The traditional solution is to remove observations further than two standard deviations from the mean (for each participant).
In addition to this, auto-correlation between trials is usually not considered by traditional analyses. On the one hand, self-monitoring is likely to have an effect, whereby the participant might slow down after noticing they had answered incorrectly on a particular trial. On the other hand, the trials form part of a time series, and there might be an effect of, for example, habituation or tiredness. Removing the trial immediately following an erroneous response (as done by, e.g., Poarch & van Hell, Reference Poarch and van Hell2012) results in further loss of data, and does not consider the time-series effect.
Finally, and most importantly, traditional approaches cannot apprehend accuracy and response time within the same analysis. Any trial eliciting an incorrect response is removed from the reaction time analysis. If a group is less accurate, the number of data points in the reaction time analysis will be reduced, but the analysis cannot take this disparity into account. In addition to this, the information carried by the incorrect trials is lost.
The combination of these three issues results in the removal of informative data, which means that the estimates of the model parameters are heavily biased and cannot really estimate the truth. This jeopardizes the interpretation of the parameter estimates.Footnote 11
A Solution: Cox Proportional Hazard Model
To address these concerns, we propose the use of a Cox PH model to analyze children’s responses to the Simon task. We start by describing how this type of model allows us to account for the difference between efficient and less efficient inhibitors before explaining the technique in detail.
Imagine a “good” inhibitor takes X amount of time to answer correctly on a particular trial in the incongruent condition. A “bad” inhibitor is expected to either take longer to answer correctly, or possibly the same amount of time (or shorter) but with a likely incorrect response. It is most unlikely that the bad inhibitor would be able to respond correctly in that trial in a shorter amount of time than the good inhibitor.Footnote 12 The Cox PH model enables us to capture this by including the time to an incorrect response as a censored observation (defined in the next paragraph). Censored observations are interpreted as the minimum amount of time it would have taken to produce a correct response in that trial (even though we do not know how long it would have taken). In that way, all responses are included in the analysis (i.e., both the time taken to answer correctly, and the time taken to answer incorrectly), while being interpreted differently.
The Cox PH technique (also known as Cox regression in the context of survival analysis) is commonly employed to model time-to-event data (Armitage, Berry, & Matthews, Reference Armitage, Berry and Matthews2008; Collett, Reference Collett2015). In the case of the Simon task, the “event” is defined as “correct response to a trial” (as opposed to an incorrect response). This definition has two consequences for how the data is treated. First, the time span from stimulus presentation to correct registered response is treated as an uncensored observation, in the sense that the time to end point (i.e., correct response) is known/observed. Second, when the children gave a wrong response, the time leading to it is treated as censored, as the end point (i.e., correct response) is not observed. Censored observations are considered in the model as they carry valuable information: They indicate that the amount of time to a correct response would have taken at least as long as that of the censored observation. Ignoring that information would result in biased estimates. The Cox PH model considers the censored times because it does not model the response time directly, but rather the hazard rate, which is defined as the probability (known as the “[instantaneous] hazard”) of responding correctly at any time, given the covariates or predictors. The hazard rate is modeled as a function of baseline hazard and covariates as predictors. The baseline hazard can be interpreted as a “typical” rate of correct response over time (independent of the predictors). The effect of covariates is to modify the baseline hazard multiplicatively. This means that the baseline “hazard” function effectively serves as the intercept (as in linear regression models).
In the context of the Cox PH model, longer reaction times are not considered as outliers (indeed, they are expected) and therefore are included in the analysis. Consequently, it is not necessary to log-transform reaction times prior to analysis.
To account for the auto-correlation between trials due to self-monitoring, we included accuracy at the previous trial as a dummy-coded factor. Furthermore, the observations between items are expected to be correlated as they are taken in sequence. To take this correlation into account, we consider Item as a random effect in the Cox PH model. This allows the model to consider the excess “risk” or “frailty” for Item, over any measured covariates (Therneau, Grambsch, & Pankratz, Reference Therneau, Grambsch and Pankratz2003): A random intercept is calculated for each item. The normality assumption shrinks the random effects estimates toward the population mean (Lee, Nelder, & Pawitan, Reference Lee, Nelder and Pawitan2006). Hence, as an indication that the correlation between items is considered, we expect (and, in the present case, find) a reduction in the degrees of freedom of fit in random effects relative to the case in which we would include Item as fixed effects.
Participant could not be included as a random effect because individual variation is accounted for by the fixed effects in this model. Participant variability is collinear with participant-related variables such as BPI, SES, and so forth,Footnote 13 as shown by the following diagnostic: When we include Participant as a fixed effect to check its impact on the other variables in the predictors,Footnote 14 collinearity with the other variables in the model makes some parameters unestimable. Furthermore, excluding Participant from the random effect structure is sound in terms of modeling, as confirmed by the following diagnostic: When we include Participant as a random effect, the reduction in the degrees of freedom is minimal (only 8%), indicating that the (random) effects due to individual participants are relatively independent (e.g., in terms of background or genetic profile). This shows that there is no participant-induced structure that must be accounted for by the model in addition to the baseline hazard function and their covariates as modifying factors.Footnote 15
Implementation of the Cox PH regression analysis is explained in the Appendix.
Results of the Cox PH Regression Analysis
The results of the optimal Cox PH model for our data are summarized in Table 13. As expected, performance was poorer in the incongruent condition (χ 2(1) = 117.54, p < 0.0001). The strongest predictor of performance was Age (χ 2(1) = 813.92, p < 0.0001), followed by self-monitoring—resulting in better performance in a given trial if the response to the previous trial had been accurate (χ 2(1) = 119.81, p < 0.0001). SES had the opposite effect in monolingual children versus bilingual children as a group: Whereas higher SES seemed to yield marginally poorer performance in monolingual children (χ 2(1) = 4.48, p = 0.03), it conferred a pronounced advantage in bilingual children, when considered as a group (χ 2(1) = 40.60, p < 0.0001). An alternative interpretation (suggested by an anonymous reviewer) is that as SES increases, a bilingual difference emerges. There was also a trend for the bilingual group to do better than the monolingual group (χ 2(1) = 3.8, p = 0.05). Over and above that effect of group, the amount of bilingual experience conferred an overall advantage (χ 2(1) = 12.13, p = 0.0005). That advantage was not significantly greater in the incongruent condition (χ 2(1) = 0.07, p = 0.78)—that is, bilingualism did not give rise to the so-called Simon effect given the absence of a significant interaction between BPI and Condition.Footnote 16
Coefficients of the optimal Cox Proportional Hazard model fitted to the Time to Correct Response (with Item as random effect; reference levels: Condition = “congruent,” Accuracy at previous trial = “inaccurate,” Bilingual = “no,” Gender = “female”). Coefficient (scaled) are for the same model fitted using scaled predictors for BPI, SES, and Age. The values in the other columns remain identical for both models.

NS-SEC operational categories (each further subdivided according to level of responsibility and expertise to yield 48 categories in total). Source: Office for National Statistics (2010)

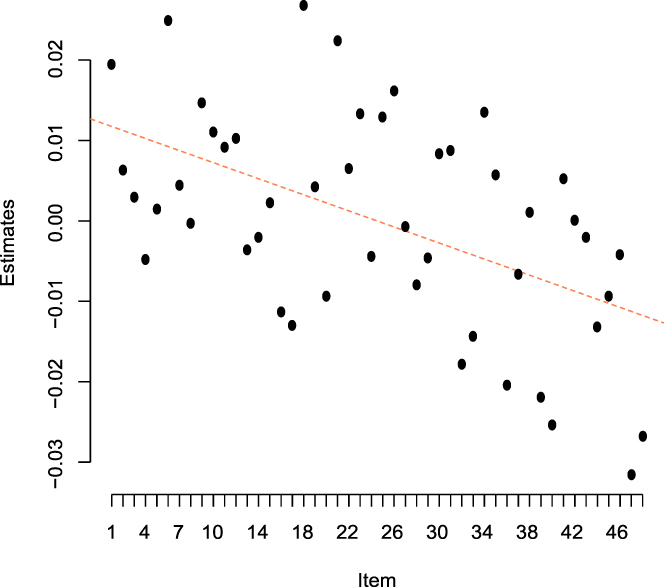
As shown in Figure 2, participants tended to slow down as the experiment progressed. Figure 2 presents the random effects estimates for items 1 to 48 in the experiment. Considering the sequence of items, the figure indicates that the estimates have a significant downward linear trend (p = 0.013). Considering that the random effects estimates modify the baseline hazard, a lower estimate corresponds to a longer time in responding correctly to the Simon tasks.
Random effect for item in the Cox PH model fitted to the Time to Correct Response.
Identifying a Critical Threshold of Bilingual Advantage
The use of a continuous variable indexing bilingualism makes it possible to identify the amount of bilingual experienceFootnote 17 above which children’s performance on the Simon task starts to differ significantly from that of monolingual children. This can be done by partitioning children in two groups (insufficiently bilingual vs. sufficiently bilingual) recursively at each point of the BPI scale, and fitting the optimal Cox PH model (reported in Table 13) using each binary partition for bilingualism in turn. The model with the lowest AIC value is the one with the best fit, and is therefore interpreted as the one with the optimal BPI partitioning score. The AIC value for each of the 98 resulting models is plotted in Figure 3. The model with the lowest AIC value was based on a binary bilingualism partitioning at BPI = 59.Footnote 18
Model fit at each BPI cutoff point, identifying a threshold for the bilingual advantage.

In our sample, 33 children had a BPI score of 59 or higher, which means they were likely to benefit from an inhibitory advantage compared with monolinguals, all other things being equal. This represents 38% of the group of children who were exposed to more than one language. Their profiles are summarized in a table in the Supplementary Online Material.
It is important to stress that being above the BPI threshold is only one among many factors predicting enhanced performance in the Simon task. Figure 4 illustrates this by plotting the bilingual children’s modeled scores against three of the significant predictors in our model (Age, SES, and BPI, taking care of scaling them beforehand),Footnote 19 highlighting whether the children were above the critical BPI threshold. This plot also shows that Age is much more strongly correlated with a high score than SES or BPI.
Bilingual children’s modeled scores in the Simon task (as estimated by the Cox regression model), according to scaled predictors for (a) Age, (b) SES, and (c) bilingual experience (BPI). A higher value on the y-axis indicates better performance (i.e., more accurate and faster).

DISCUSSION
The results reveal a mixed picture regarding the impact of bilingual experience on EF performance, as indexed by the three tasks in our study. This is not unexpected “because of the uncertainty about what components of executive functions different tasks tap, and uncertainty about the importance of task features that are orthogonal to executive function” (Valian, Reference Valian2015, p. 9).
Results from the WM tests showed very little variation, making them insufficiently discriminative to be able to detect the influence of likely predictors. Most of the variance in WM was predicted by STM. Because of this, we suggest that the predictors of STM could be interpreted as indirect predictors of WM. This includes Age, SES (conferring an advantage), and Gender (with girls outperforming boys). Given the lack of substantial variation, our study remains inconclusive as to the effect of bilingualism on updating skills. Other studies have reported a bilingual advantage at similar ages (Blom et al., Reference Blom, Küntay, Messer, Verhagen and Leseman2014) or younger (Brito et al., Reference Brito, Sebastián-Gallés and Barr2015).
Although considered to be nonverbal, the DCCS switching task included constant verbal reminders of the sorting rules. This was intended to control for the effect of STM, but there remained a trend for better performance in children with better STM. Crucially, it appears the frequent verbal instructions induced an effect of language proficiency on performance. The amount of bilingual experience did, however, not have an effect (even if Proficiency was not included as a predictor). Instead, only the children in the (highly heterogeneous) bilingual group benefited from a socioeconomic advantage. A limitation of our study is that reaction times were not recoded.
Using Cox PH regression to model the Simon task data allowed us to capture accuracy and response speed within the same analysis (i.e., not discarding inaccurate responses at any stage of the analysis), and to consider all the data points (i.e., including “outliers”) without violating model assumptions. The retention of all the potentially informative data allows the model parameter estimates to be interpreted with confidence. All children were found to have taken progressively longer over the course of the experiment. Self-monitoring was evident in longer response time in the trial following an incorrect response. Bilingual children performed better than monolingual children, in the sense that they were faster at responding accurately. The BPI predicted better performance overall, over and above a significant group advantage. The advantage was a global one, as there was no significant Simon effect in favor of the bilinguals: No interaction was observed between bilingualism and condition (congruent vs. incongruent). However, a global advantage might still indicate superior inhibition abilities if performance in congruent trials is affected by the overall context of the task. Support for this interpretation comes from the fact that this global advantage is only found in tasks that are sufficiently demanding and include response competition (Martin-Rhee & Bialystok, Reference Martin-Rhee and Bialystok2008). Other studies have also reported a global advantage for bilingual children over their monolingual peers in the Simon task (Bialystok et al., Reference Bialystok, Martin and Viswanathan2005) or the flanker task (Engel de Abreu et al., Reference Engel de Abreu, Cruz-Santos, Tourinho, Martin and Bialystok2012; Yang et al., Reference Yang, Yang and Lust2011). The only study to date reporting a Simon effect in favor of bilingual children is Poarch and van Hell (Reference Poarch and van Hell2012). That study included twice as many trials in the Simon task compared with other children studies, and it included a neutral condition (in which the colored block appeared centrally). The effect of these aspects of the design and of the substantial quantity of discarded dataFootnote 20 will need to be scrutinized in future research.
Our analysis controlled for age, SES, gender, and self-monitoring (i.e., accuracy at the previous trial). This gives us confidence that the bilingual advantage observed is unlikely to be due to confounds arising from these factors.
The Bilingual Advantage
As called for by many (e.g., Abutalebi & Rietbergen, Reference Abutalebi and Rietbergen2014; Baum & Titone, Reference Baum and Titone2014; Kaushanskaya & Prior, Reference Kaushanskaya and Prior2015; Luk, Reference Luk2015), we have integrated the variability of bilingual experience in our model, alongside other relevant factors, and this has allowed us to better capture the specific impact of bilingualism on EF. The BPI indexes children’s cumulative experience in their home language, thereby taking variations in their bilingual history into account. It is derived from the combination of cumulative measures of input and output measures, and thus measures the extent to which a child actively uses his or her home language—a dimension that might require additional neuro-cognitive resources compared with language switching for comprehension only (see Abutalebi & Rietbergen, Reference Abutalebi and Rietbergen2014). There is a strong and significant correlation or association between the BPI and each of the following measures: age of first exposure, current input, current output, and household type (defined by patterns of language use). Although derived from measures of exposure to the home language, the BPI has also been shown to predict proficiency in the language of schooling (De Cat & Serratrice, forthcoming). It is therefore a useful index of bilingual experience overall, which can be interpreted as varying quantitatively and qualitatively. As such, it makes it possible to capture globally the effect of bilingual experience on EF performance. Our study therefore answers the question as to how much bilingual experienceFootnote 21 is enough for 5- to-7-year-olds to benefit from an inhibition advantage (Luk, Reference Luk2015).
The bilingual advantage is hypothesized to arise from bilinguals’ regulation of their two languages. The aspects of bilingual experience conferring a cognitive advantage are, however, not yet fully understood (Kroll & Fricke, Reference Kroll and Fricke2014). Code-switching is likely to be a significant factor (Green & Abutalebi, Reference Green and Abutalebi2013; Prior & Gollan, Reference Prior and Gollan2011), itself influenced by several other dimensions of the bilingual experience (Genesee, Reference Genesee2014; Green, Reference Green2014). Further research will be necessary to investigate this. In our study, bilingualism varied in terms of age of initial exposure (although this was below 5 years of age for all children), amount of exposure to a home language (ranging from 9% to 89% in terms of current input), amount of output produced by the child in their home language, household type (in terms of patterns of language use), and home language (from a range of 28). The opportunities for code-switching at school also varied, but unfortunately we did not have a reliable indicator to include in the analyses. In other respects, there was little variation: The language of schooling was English for all children, none of the children were in a bilingual education program. Although our approach does not allow us to ascertain if aspects of bilingual experience had significantly more impact, observing the characteristics of the children who were above the critical BPI threshold is a first step in that direction. The profile of these children is detailed in the Supplementary Materials. These children were exposed to their home language 58% of waking hours on average (the lowest was 23%), and were generally “active” speakers of that language (with current output at 52% on average, and one child not producing any).Footnote 22 This suggests that on average, these children were balanced bilinguals. In terms of cumulative exposure, they had received the equivalent of 54 months’ exposure to their home language on average (minimum 43 months) and their cumulative output amounted to the equivalent of 52 months on average (minimum 36 months). Only one of them came from a one-parent-one-language household. Twenty-two came from a household in which only the home language was reported to be used, and ten from a household in which both parents spoke the home language but children sometimes interacted in English.
Other Significant Factors
EF components cannot be fully isolated from each other. Children’s updating performance (indexed by the WM task) was, however, not a significant predictor of performance in the other tasks. This was expected in the DCCS (as the protocol controlled for the effect of memory). In the Simon task, our results seem at odds with those of Espy and Bull (Reference Espy and Bull2005), who found that in younger children (3- to 6-year olds), performance on attention control tasks was predicted by their STM span. Aside from the age difference between the two studies, methodological differences are likely to explain this apparent discrepancy in findings: We used age in months and STM as predictors and found that memory did not predict performance in the Simon task over and above the effect of age; Espy and Bull (Reference Espy and Bull2005) compared children in three age groups and found that their memory span predicted their inhibition performance.
SES is known to confer an EF advantage (Ardila et al., Reference Ardila, Rosselli, Matute and Guajardo2005). The nature of that advantage is difficult to interpret, however, as SES is most likely a proxy for the opportunity to engage in challenging activities that lead to better EF (Valian, Reference Valian2015). It has been suggested that the impact of bilingualism might be stronger at certain SES levels (Woodard & Rodman, Reference Woodard and Rodman2007). In our study, a positive interaction between bilingualism and SES was observed in the Simon task and the DCCS task (conferring an advantage), but this could be due to the moderate association between Group (monolingual vs. bilingual) and SES in our sample.
Age was a highly significant predictor of performance in all tasks. This is unsurprising as children experience critical phases in EF development within the age range considered in our study (Brocki & Bohlin, Reference Brocki and Bohlin2004; Garon et al., Reference Garon, Bryson and Smith2008; Hongwanishkul et al., Reference Hongwanishkul, Happaney, Lee and Zelazo2005).
In addition to the preceding, several experiences are known to be associated with superior EF, including immigrant status, physical exercise, musical training, video games, and time spent in leisure activities (see Valian, Reference Valian2015 for a review). Personality variables may also play a role, and it is highly likely that other yet unidentified factors are also significant. Indeed, in our study, we found that individual variation dominates over the effect of participant-related variables. This suggests that, although significant, the bilingual advantage is likely to be small in comparison with other factors—as we clearly observed in the case of age. Further research will be essential to uncover these hitherto hidden factors and estimate the magnitude of their impact.
Methodological Remarks
In terms of size, the population tested (N = 174) compares favorably with most relevant studies involving children. In that sense, our study bucks the trend identified by Paap and colleagues (Reference Paap, Johnson and Sawi2014), according to which the bilingual advantage was confined to studies with small sample sizes.
The modeling methods adopted in our analyses allowed the use of fine-grained, continuous factors for age and SES, thereby effectively controlling for their effect and isolating (or “adjusting”) the specific effect of bilingual experience. By contrast, analyses relying on measures of central tendency are prone to confounds induced by age, SES, and amount of bilingual experience, as it is impossible to match children precisely on each of these variables. In particular, we found that age in months very strongly predicted performance in the Simon task, with each additional month in age having a clear effect. Discrepancies between studies could therefore have arisen partly from overly coarse matching of groups in terms of age.
CONCLUSION
The past few years have featured a lively and productive debate regarding the investigation of the EF correlates of bilingualism. This debate is starting to crystallize into agreement as to the way forward in terms of the questions that remain to be addressed and the methods required to that effect.
Our contribution has been threefold. First, we have responded to the call for an operationalization of bilingualism as a continuum, to start answering the question as to how bilingual one must be to benefit from EF advantages. Second, we have used state-of-the-art statistical modeling techniques to analyze the data, including the pioneering use of Cox PH regression to capture accuracy and reaction time within a single analysis (in the Simon task). The use of regression in all analyses has enabled us to effectively control for SES, age, and other potential confounds. Third, we have demonstrated a significant correlation between inhibition performance and bilingual experience in 5- to 7-year-old children, based on a relatively large sample (N = 174) from a heterogeneous population. If inhibition indexes the common factor underlying all aspects of EF (Miyake & Friedman, Reference Miyake and Friedman2012; Valian, Reference Valian2015), this can be interpreted as a general EF advantage. Importantly, this advantage was observed at ages characterized by intense development of EFs.
The BPI enabled us to identify the critical threshold of bilingual experience from which an advantage can be observed at group level. To understand the exact cause of the advantage will require a different approach, in which the various aspects of bilingual experience are disentangled and allowed to vary, so that their effect and how they interact can be brought to light.
SUPPLEMENTARY MATERIAL
To view supplementary material for this article, please visit https://doi.org/10.1017/S0272263116000486
APPENDIX
IMPLEMENTATION OF THE COX PH REGRESSION
We denote the response time t of a child as a sample value of a random variable T ≥ 0, which has an underlying probability density function f (t), and the distribution function F (t) = P (T < t) =  $\{ _0^t f(u)du$. The survivor function S(t) is defined as the probability that the response time is greater than or equal to t, and so S(t) = P (T ≥ t) = 1 − F (t). S(t) can therefore be used to represent the probability that a child responds correctly at atleast t (since the moment of showing the task on the screen).
The hazard function is defined as
 $$\mathop {h\left( t \right) = \lim }\limits_{t \to 0} {{p\left[ {t \le T &lt; t + L:,\left. t \right|T \ge t} \right]} \over {L:,t}}$$
which is interpreted as the instantaneous “risk” of responding correctly to the task at time t, or the rate of responding correctly at time t. In Cox PH model (Cox, Reference Cox1972), the hazard at time t of an individual with some covariates x i, denoted h i(t|X), is modeled as a multiplication of the baseline hazard function that only depends on t, denoted h 0(t), with the exponential of linear predictors exp {x iβ}, where β is a vector of model parameters (without intercept).
The (standard) Cox PH model does not take into account the correlation structure between items, but it can take into account different intercepts. We exploit this to include random effect for Item in the model. Specifically, let t ij be the response time of the i-th child in task j, i = 1, 2, . . . , nc and j = 1, 2, . . . , n t, δij be the event indicator: δij = 1 if the event was uncensored and δij = 0 if the time was censored. Let h ij (t|X) be the hazard rate at time t for the i-th child in j-th item, given the matrix of covariates X. The extended Cox PH model can be expressed as
 $${h_{ij}}\left( {t;\left. X \right|\theta } \right) = {h_0}\left( t \right)\exp \left\{ {{X_i}\beta + {\theta _j}} \right\}$$
where θ j is the random effect of j-th item in the sequence of tasks assumed to follow a normal distribution with mean zero and variance σ θ2, that is, θ j ∼ N (0, σ θ2) for j = 1, . . . , q.
The estimation of parameters, both fixed effects and random effects, are based on the method proposed by (Ripatti & Palmgren, Reference Ripatti and Palmgren2002), which are implemented in the R package “survival” (Therneau et al., Reference Therneau, Grambsch and Pankratz2003).


