

Metabolic syndrome (MetS) is identified by the presence of abdominal obesity, hypertension, fasting hyperglycaemia and dyslipidaemia (reduced HDL cholesterol and increased TAG)( Reference Alberti, Eckel and Grundy 1 ). In the USA, MetS is a common disease with a prevalence of 32·9 % in 2003–2004 and 34·7 % in 2011–2012( Reference Aguilar, Bhuket and Torres 2 ); this increasing tendency is also developing throughout the world( Reference Eckel, Grundy and Zimmet 3 ). Persons with MetS have an increased risk of death from all causes as well as CVD( Reference Resnick, Jones and Ruotolo 4 – Reference Trevisan, Liu and Bahsas 8 ). Increasing evidence indicates that MetS is affected by genetic( Reference Povel, Boer and Reiling 9 , Reference Gao, Ding and Huang 10 ) and lifestyle factors, such as alcohol consumption, soft drink intake, coffee consumption and sedentary behaviours( Reference Sun, Ren and Liu 11 – Reference Yamaoka and Tango 14 ). As the two important determinants of body weight, diet and physical activity can influence obesity and most of the MetS components directly( Reference Cornier, Dabelea and Hernandez 15 ).
Fruits and vegetables are important components of the diet and have been reported to have many potential health benefits, since they are rich in fibre, minerals, vitamins and phytochemicals. Several studies have indicated fruits and vegetables significantly decrease the risk of inflammatory bowel disease( Reference Li, Liu and Wang 16 ), lung cancer( Reference Vieira, Abar and Vingeliene 17 ), depression( Reference Liu, Yan and Li 18 ), hypertension( Reference Li, Li and Wang 19 , Reference Wu, Sun and He 20 ), type 2 diabetes mellitus( Reference Wu, Zhang and Jiang 21 ) and all-cause mortality( Reference Wang, Ouyang and Liu 22 ). Antioxidants and anti-inflammatory components from fruits and vegetables are hypothesized to play an important role in MetS( Reference Qiao and Group 23 ). A previous study investigated circulatory levels of vitamins C and E, as well as Zn, Mg and Se, finding them inversely correlated with obesity and body fat mass( Reference Hosseini, Saedisomeolia and Allman-Farinelli 24 ). Meanwhile, obesity is a crucial component of MetS. Thus, it is speculated that fruits and vegetables may have relationship with MetS. Many epidemiological studies have been performed to investigate the relationship between fruit or/and vegetable consumption and risk of MetS. However, the results remain controversial. Some studies( Reference Park, Ham and Lee 25 – Reference Boucher, Sidebottom and Sillah 32 ) have revealed that fruit or/and vegetable consumption is significantly associated with a decreased risk of MetS, while other studies( Reference Shin, Lim and Sung 33 – Reference Baik, Lee and Jun 37 ) showed no significant relationship.
Therefore, we performed a systematic meta-analysis combining all of the available data from observational studies to assess the associations of fruit or/and vegetable consumption with risk of MetS, separately.
Methods
The PRISMA (Preferred Reporting Items for Systematic Reviews and Meta-Analyses) guidelines were consulted in the current analysis( Reference Moher, Liberati and Tetzlaff 38 ).
Literature search strategy
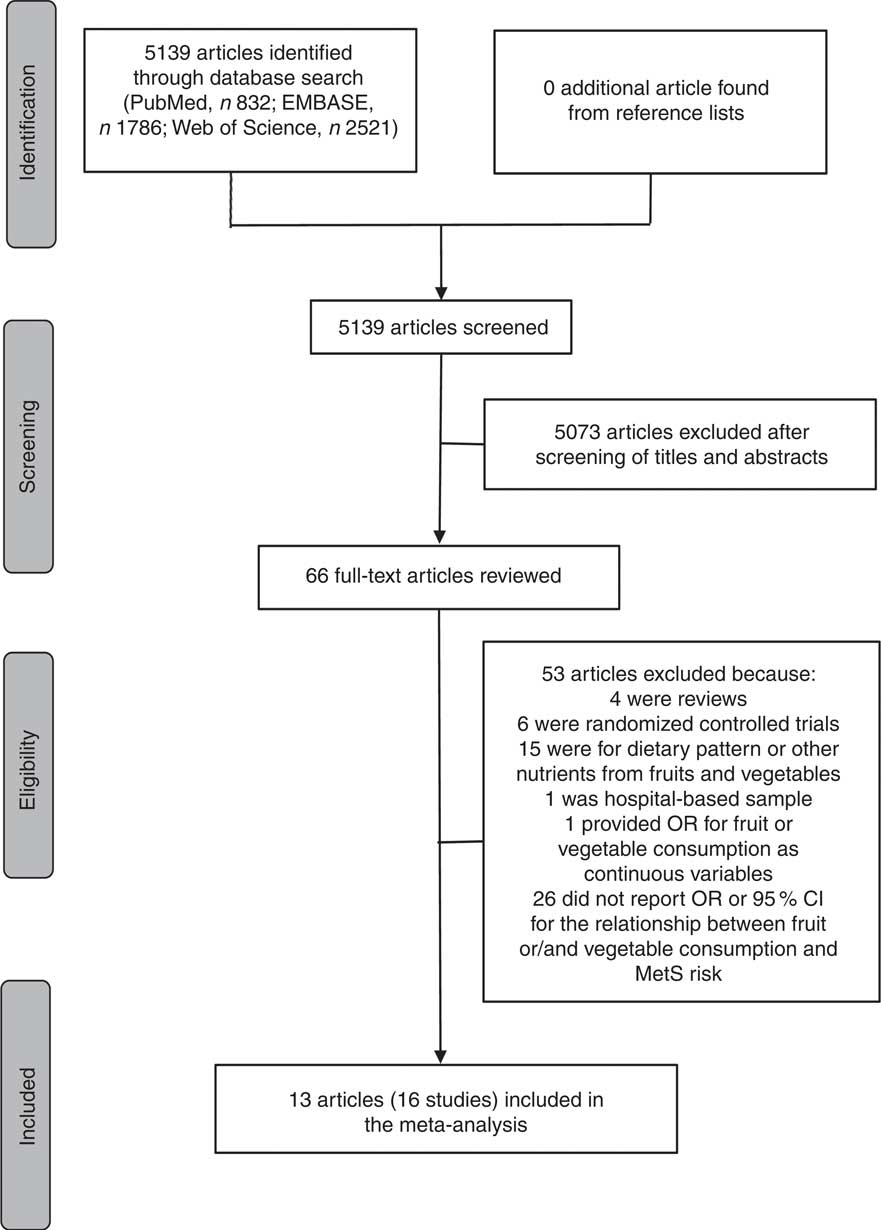
A literature search was conducted for relevant available articles published in English from three databases: PubMed, EMBASE and Web of Science, up to July 2017. We used the search terms ‘fruit’, ‘fruits’, ‘vegetable’ or ‘vegetables’ in combination with ‘metabolic syndrome’ or ‘MetS’. The reference lists from the reviews and articles included were also reviewed for undetected relevant articles. The detailed steps of the literature search are shown in Fig. 1.
Flow diagram of the literature search for studies included in the present meta-analysis on fruit or/and vegetable consumption and risk of metabolic syndrome (MetS)
Inclusion criteria and exclusion criteria
The inclusion criteria were as follows: (i) observational study published as an original study; (ii) population-based sample; (iii) exposure of interest was defined as fruit or/and vegetable consumption; (iv) outcome of interest was defined as MetS; (v) study presented estimates of OR, relative risk (RR) or hazard ratio (HR) with corresponding 95 % CI for the associations of fruit or/and vegetable consumption with risk of MetS; and (vi) the most recent and complete study was selected if data from the same population had been published more than once.
The exclusion criteria were as follows: (i) study did not report OR, RR or HR with 95 % CI for the relationship between fruit or/and vegetable consumption and MetS risk; and (ii) study provided OR, RR or HR for fruit or/and vegetable consumption as continuous variables, not categorical variables.
All identified studies were carefully reviewed independently by two investigators, and discrepancies were discussed and resolved by a third investigator.
Data extraction and quality assessment
Two investigators were required to extract and tabulate key data from retrieved studies independently, and any discrepancies were resolved by a third investigator. The following information was extracted from studies: the first author’s name, publication year, country where the study was conducted, study design, baseline age, gender, number of cases and sample size, fruit or/and vegetable assessment method, MetS assessment method, adjusted OR with 95 % CI (we present all results with OR for simplicity) of MetS for fruit or/and vegetable consumption, and adjusted covariates. If the overall results were not provided, results for men and women were included as separate study results. The Newcastle–Ottawa quality assessment scale was used to assess the quality of original studies.
Statistical analysis
The pooled effect was calculated as the inverse variance-weighted mean of the logarithm of adjusted OR with 95 % CI to assess the strength of the associations between fruit or/and vegetable consumption and risk of MetS. The I 2 statistic of Higgins and Thompson was adopted to assess the heterogeneity between studies; I 2 values of 0, 25, 50 and 75 % represented no, low, moderate and high heterogeneity, respectively( Reference Higgins and Thompson 39 ). The random-effects model (REM) was adopted if moderate or higher heterogeneity (I 2≥50 %) was found; otherwise (I 2<50 %), the fixed-effects model (FEM) was used( Reference Higgins, Thompson and Deeks 40 ). Meta-regression with restricted maximum likelihood estimation was performed to explore the potentially important covariates that might exert substantial impacts on between-study heterogeneity(41). Influence analysis was also conducted to determine whether an individual study affected the aggregate result( Reference Tobias 42 ). Potential small-study effect was evaluated using Egger’s regression asymmetry test( Reference Egger, Davey Smith and Schneider 43 ) and visual inspection of the funnel plot. Subgroup analyses were performed by continent where the study was conducted, age of the population, MetS assessment method, and whether adjusted for BMI and physical activity. All statistical analyses were performed using the statistical software package STATA version 12.0. All reported P values were two-sided, with P<0·05 considered statistically significant.
Results
Literature search and study characteristics
As shown in Fig. 1, the search strategy identified 832 articles from PubMed, 1786 articles from EMBASE and 2521 articles from Web of Science, but no additional article was found from reference lists. After reviewing the titles and abstracts, 5073 articles were excluded. In all, sixty-six potentially relevant full-text articles were reviewed, with fifty-three articles were excluded because: four were reviews; six were randomized controlled trials; fifteen were for dietary pattern or other nutrients from fruits and vegetables; one was not a population-based sample, but a hospital-based sample( Reference Jung, Han and Song 44 ); one provided OR for fruit or vegetable consumption as continuous variables( Reference Jaaskelainen, Magnussen and Pahkala 45 ); and twenty-six did not report OR or 95 % CI for the relationship between fruit or/and vegetable consumption and MetS risk. As a result, a total of thirteen published articles( Reference Park, Ham and Lee 25 – Reference Baik, Lee and Jun 37 ) including sixteen studies were identified as eligible for the present meta-analysis.
The basic characteristics of the included studies for fruit or/and vegetable consumption with risk of MetS are shown in Table 1. Among these studies, seven studies were conducted in Asia, four in Europe, four in North America and one in South America. Considering the age of the population, four were adolescents and twelve were adults. As for study design, there were three cohort studies and thirteen cross-sectional studies included in the meta-analysis. The major adjustment confounding factors included age, gender, BMI, physical activity level, race, education, smoking, alcohol use and energy intake. After assessing the study quality by the Newcastle–Ottawa scale, for fruit consumption, eight studies( Reference Park, Ham and Lee 25 , Reference Pan and Pratt 26 , Reference Kelishadi, Gouya and Adeli 29 – Reference de Oliveira, McLellan and Vaz de Arruda Silveira 31 , Reference Shin, Lim and Sung 33 , Reference Baik, Lee and Jun 37 ) received a quality score of ≥7 and the remaining one study( Reference Masaki 27 ) received a quality score of 6; for vegetable consumption, all nine studies( Reference Park, Ham and Lee 25 , Reference Kelishadi, Gouya and Adeli 29 – Reference de Oliveira, McLellan and Vaz de Arruda Silveira 31 , Reference Shin, Lim and Sung 33 , Reference Kouki, Schwab and Hassinen 35 , Reference Baik, Lee and Jun 37 ) had a quality of ≥7; for fruit and vegetable consumption, six studies( Reference Kwasniewska, Kaleta and Dziankowska-Zaborszczyk 28 , Reference Kelishadi, Gouya and Adeli 29 , Reference Lutsey, Steffen and Stevens 34 , Reference Fletcher, McNaughton and Lacy 36 ) received a quality score of ≥7 and the remaining one study( Reference Boucher, Sidebottom and Sillah 32 ) received a quality score of 5 (see online supplementary material, Supplemental Table 1).
Characteristics of the studies included in the present meta-analysis on fruit or/and vegetable consumption and risk of metabolic syndrome (MetS)

NA, not available; NCEP ATPIII, National Cholesterol Education Program Adult Treatment Panel III; IDF, International Diabetes Federation; AHA, American Heart Association; T2DM, type 2 diabetes mellitus; PA, physical activity; %E, percentage of energy; CRP, C-reactive protein; MET, metabolic equivalent of task; FTO, fat mass and obesity-associated (gene); SEP, socio-economic position; TV, television.
Quantitative synthesis
Fruit consumption and risk of metabolic syndrome
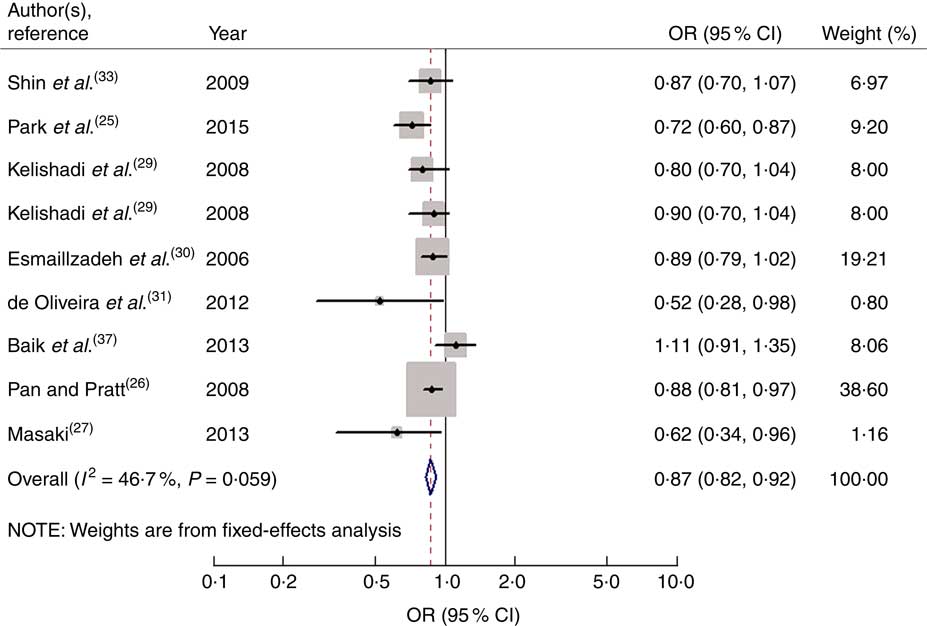
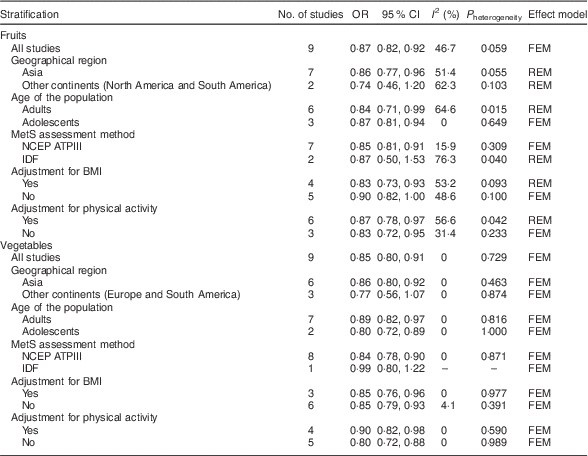
Nine studies from eight articles involving 37 018 participants (6205 cases) evaluated the association of fruit consumption with risk of MetS. Four of the nine studies( Reference Park, Ham and Lee 25 – Reference Masaki 27 , Reference de Oliveira, McLellan and Vaz de Arruda Silveira 31 ) revealed an inverse association, while the other five studies( Reference Kelishadi, Gouya and Adeli 29 , Reference Esmaillzadeh, Kimiagar and Mehrabi 30 , Reference Shin, Lim and Sung 33 , Reference Baik, Lee and Jun 37 ) indicated no relationship. For the highest v. lowest category of fruit consumption, the pooled OR of MetS was 0·87 (95 % CI 0·82, 0·92; I 2=46·7 %, P heterogeneity=0·059, FEM; Fig. 2). For subgroup analysis stratified by continent where the study was conducted, the result indicated that higher consumption of fruits was inversely associated with risk of MetS for studies conducted in Asia (OR=0·86; 95 % CI 0·77, 0·96). With regard population age, higher consumption of fruits was inversely associated with risk of MetS in both adults (OR=0·84; 95 % CI 0·71, 0·99) and adolescents (OR=0·87; 95 % CI 0·81, 0·94). With regard to MetS assessment method, higher consumption of fruits was inversely associated with risk of MetS in the National Cholesterol Education Program Adult Treatment Panel III (NCEP APTIII) subgroup (OR=0·85; 95 % CI 0·81, 0·91). The remaining results of subgroup analysis are shown in Table 2.
Forest plot for the pooled OR of the association of fruit consumption with risk of metabolic syndrome. The study-specific OR and 95 % CI are represented by the black diamond and the horizontal line, respectively; the area of the grey square is positively proportional to the weight assigned to each study, which is inversely proportional to the se of the OR. The centre of the open diamond and the vertical dashed line represent the pooled OR, and the width of the open diamond represents the pooled 95 % CI
Summary of pooled OR for the association of fruit consumption and vegetable consumption with risk of metabolic syndrome (MetS)
NCEP ATPIII, National Cholesterol Education Program Adult Treatment Panel III; IDF, International Diabetes Federation; FEM, fixed-effects model; REM, random-effects model;
When men and women were analysed separately, the result indicated that higher consumption of fruits was inversely associated with risk of MetS in both men (OR=0·81; 95 % CI 0·71, 0·94; I 2=0·0 %, P heterogeneity=0·481, FEM) and women (OR=0·85; 95 % CI 0·77, 0·93; I 2=47·5 %, P heterogeneity=0·149, FEM).
Vegetable consumption and risk of metabolic syndrome
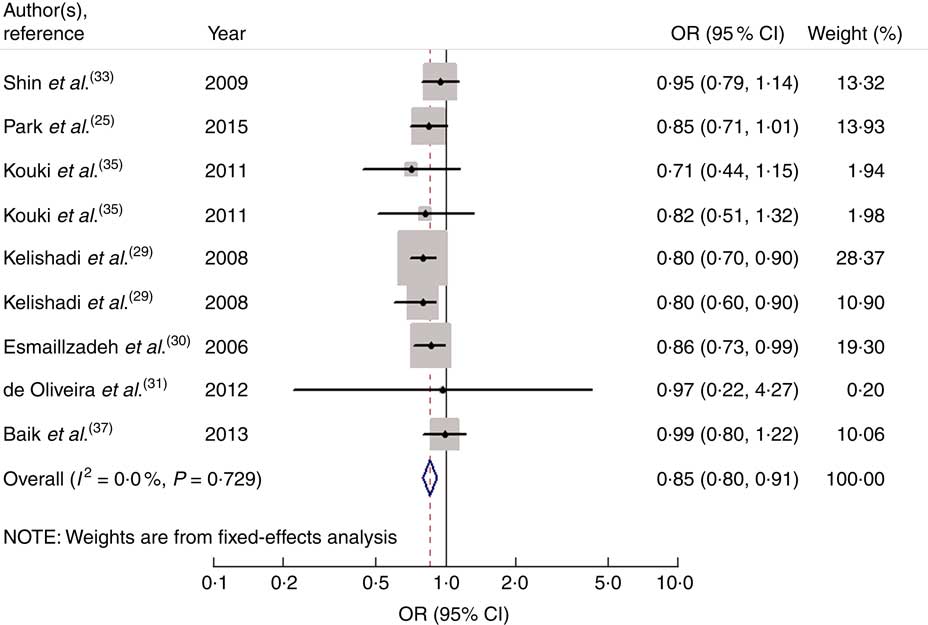
Nine studies from seven articles involving 33 902 participants (6400 cases) investigated the association of vegetable consumption with risk of MetS. Three of the nine studies( Reference Kelishadi, Gouya and Adeli 29 , Reference Esmaillzadeh, Kimiagar and Mehrabi 30 ) revealed an inverse association, while the other six studies( Reference Park, Ham and Lee 25 , Reference de Oliveira, McLellan and Vaz de Arruda Silveira 31 , Reference Shin, Lim and Sung 33 , Reference Kouki, Schwab and Hassinen 35 , Reference Baik, Lee and Jun 37 ) indicated no relationship. For the highest v. lowest category of vegetable consumption, the pooled OR of MetS was 0·85 (95 % CI 0·80, 0·91; I 2=0·0 %, P heterogeneity=0·729, FEM; Fig. 3). For subgroup analysis stratified by continent where the study was conducted, the result indicated that higher consumption of vegetables was inversely associated with risk of MetS for studies conducted in Asia (OR=0·86; 95 % CI 0·80, 0·92). With regard to population age, higher consumption of vegetables was inversely associated with risk of MetS in both adults (OR=0·89; 95 % CI 0·82, 0·97) and adolescents (OR=0·80; 95 % CI 0·72, 0·89). With regard to MetS assessment method, higher consumption of vegetables was inversely associated with risk of MetS in the NCEP APTIII subgroup (OR=0·84; 95 % CI 0·78, 0·90). The remaining results of subgroup analysis are shown in Table 2.
Forest plot for the pooled OR of the association of vegetable consumption with risk of metabolic syndrome. The study-specific OR and 95 % CI are represented by the black diamond and the horizontal line, respectively; the area of the grey square is positively proportional to the weight assigned to each study, which is inversely proportional to the se of the OR. The centre of the open diamond and the vertical dashed line represent the pooled OR, and the width of the open diamond represents the pooled 95 % CI
When men and women were analysed separately, the result indicated that higher consumption of vegetables was inversely associated with risk of MetS in both men (OR=0·84; 95 % CI 0·76, 0·93; I 2=28·0 %, P heterogeneity=0·249, FEM) and women (OR=0·84; 95 % CI 0·76, 0·93; I 2=0·0 %, P heterogeneity=0·954, FEM).
Fruit and vegetable consumption and risk of metabolic syndrome
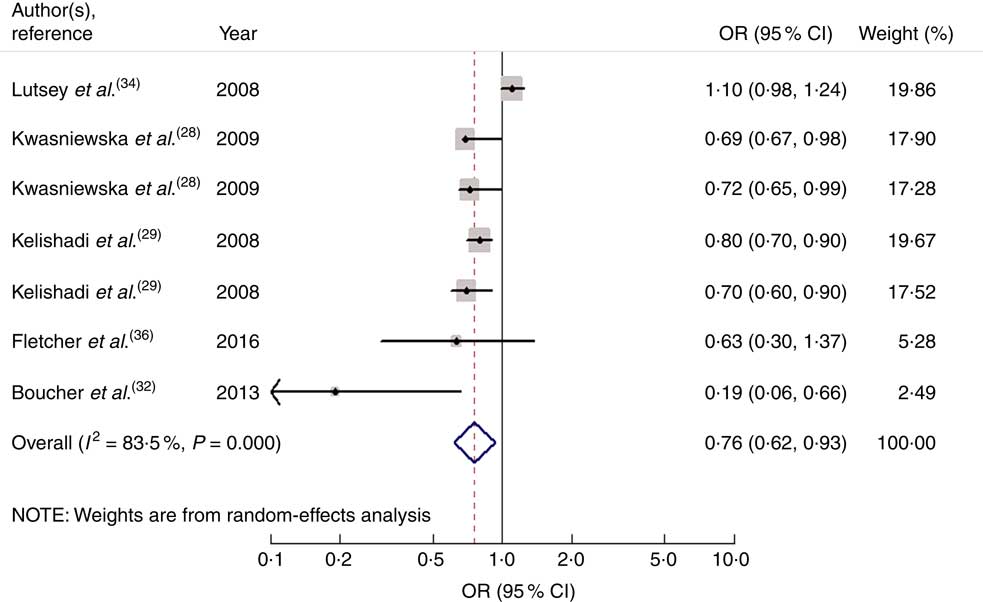
Seven studies from five articles involving 17 950 participants (4937 cases) explored the association of fruit and vegetable consumption with risk of MetS. Five of the seven studies( Reference Kwasniewska, Kaleta and Dziankowska-Zaborszczyk 28 , Reference Kelishadi, Gouya and Adeli 29 , Reference Boucher, Sidebottom and Sillah 32 ) revealed an inverse association, while the other two studies( Reference Lutsey, Steffen and Stevens 34 , Reference Fletcher, McNaughton and Lacy 36 ) indicated no relationship. For the highest v. lowest category of fruit and vegetable consumption, the pooled OR of MetS was 0·76 (95 % CI 0·62, 0·93; I 2=83·5 %, P heterogeneity=0·000, REM; Fig. 4).
Forest plot for the pooled OR of the association of fruit and vegetable consumption with risk of metabolic syndrome. The study-specific OR and 95 % CI are represented by the black diamond and the horizontal line, respectively; the area of the grey square is positively proportional to the weight assigned to each study, which is inversely proportional to the se of the OR. The centre of the open diamond and the vertical dashed line represent the pooled OR, and the width of the open diamond represents the pooled 95 % CI
Meta-regression
For the association between fruit consumption and risk of MetS, in order to explore the sources of heterogeneity, we performed univariate meta-regression with covariates of publication year (P=0·554), gender (P=0·308), age of the population (P=0·907), continent where the study was conducted (P=0·791), study design (P=0·056), MetS assessment method (P=0·178), whether adjusted for BMI (P=0·467) and whether adjusted for physical activity (P=0·605). However, none of these covariates were found to contribute to the low heterogeneity in the analysis.
High heterogeneity was demonstrated for the association between fruit and vegetable consumption (I 2=83·5 %, P heterogeneity=0·000) and risk of MetS. In order to explore the sources of heterogeneity, we performed univariate meta-regression with covariates of publication year (P=0·242), gender (P=0·627), age of the population (P=0·844), continent where the study was conducted (P=0·185), study design (P=0·026), MetS assessment method (P=0·634), whether adjusted for BMI (P=0·642) and whether adjusted for physical activity (P=0·552). Only study design (P=0·026) was found to contribute to the high heterogeneity in the analysis.
Influence analysis and small-study effect
In the influence analyses, all of the point estimates lay within the 95 % CI of the combined analysis, indicating that no individual study had excessive influence on the above-mentioned aggregate results.
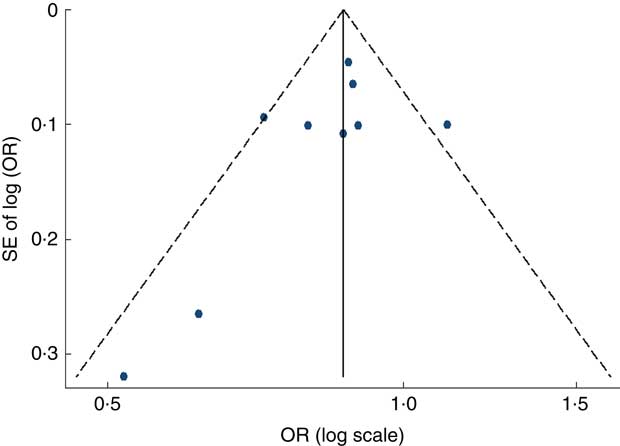
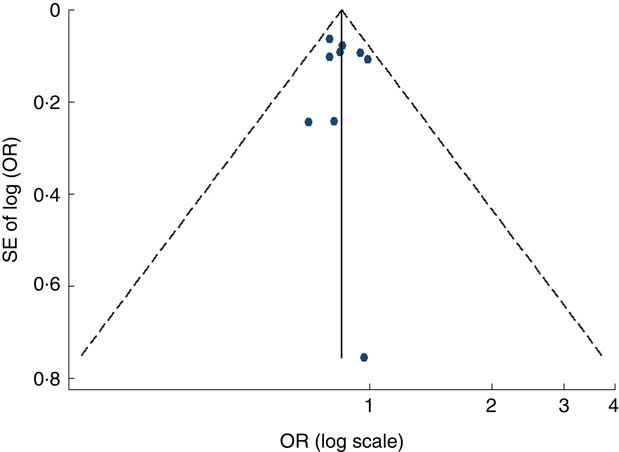
Visual inspection of the funnel plot and Egger’s test suggested there was no evidence of significant small-study effects for the associations of fruit consumption (P=0·247; Fig. 5), vegetable consumption (P=0·902; Fig. 6) and fruit and vegetable consumption (P=0·113) with risk of MetS.
Funnel plot, with pseudo 95 % CI represented by dashed lines, for the analysis of fruit consumption with risk of metabolic syndrome. Each dot represents a different study
Funnel plot, with pseudo 95 % CI represented by dashed lines, for the analysis of vegetable consumption with risk of metabolic syndrome. Each dot represents a different study
Discussion
Our meta-analysis included sixteen studies from thirteen available articles, based on observational evidence. The results indicated that fruit consumption, vegetable consumption as well as fruit and vegetable consumption was associated with a significantly decreased risk of MetS. Subgroup analyses indicated that the results for studies in the adult subgroup and the adolescent subgroup, studies conducted in Asia and studies with NCEP APTIII assessment remained significant. The results for studies conducted in other continents were statistically insignificant, possibly because few studies were included. There was no sufficient evidence to suggest small-study effect.
There are several potential mechanisms underlying the impact of fruit and vegetable consumption on risk of MetS. First, MetS is associated with oxidative stress and insulin resistance( Reference Ando and Fujita 46 ). Fruits and vegetables are abundant in antioxidants, such as vitamins C and E, Mg, K, folic acid and phytochemicals. A higher intake of antioxidants can reduce reactive oxygen species and improve antioxidant status in both man and animal models( Reference Qiao and Group 23 , Reference Bokov, Chaudhuri and Richardson 47 ), which can slow the development of systemic oxidative damage causing the overproduction of reactive oxygen species( Reference Grundy 48 , Reference Palmieri, Grattagliano and Portincasa 49 ); phytochemicals can increase the body’s production of insulin( Reference Jayaprakasam, Vareed and Olson 50 ), suggesting the possibility that these components may have a role in the prevention of insulin resistance, and then have an important function in the prevention of MetS; the MetS-protective effects of fruits and vegetables also may be mediated through the effect of their components (such as antioxidants) on inflammatory markers, such as C-reactive protein( Reference Brighenti, Valtueña and Pellegrini 51 , Reference Wannamethee, Lowe and Rumley 52 ). A higher consumption of fruits and vegetables is associated with lower plasma concentrations of C-reactive protein( Reference Esmaillzadeh, Kimiagar and Mehrabi 30 , Reference Watzl, Kulling and Moseneder 53 ), which may have protective effect for MetS. Second, increased fruit and vegetable consumption may have an impact on raising dietary fibre consumption and reducing fat intake, and this diet structure has been shown to be significantly associated with decreased risk of MetS( Reference Singh, Niaz and Ghosh 54 ).
Between-study heterogeneity is common in meta-analysis( Reference Munafo and Flint 55 ) and it is essential to explore the sources of between-study heterogeneity. High heterogeneity was found from the association between fruit and vegetable consumption and risk of MetS. Meta-regression revealed that the heterogeneity was associated with study design. The factors accounting for the heterogeneity between studies are complicated. First, there were differences in fruit and vegetable variety, methods of preservation and cooking methods, which might contribute to the heterogeneity. One study by Kelishadi et al.( Reference Kelishadi, Gouya and Adeli 29 ) classified juice into the fruit group, but other studies did not. One study by Baik et al.( Reference Baik, Lee and Jun 37 ) classified seaweed into the vegetable group, which was different from other studies. Second, variables adjusted for varied among studies, including age, smoking status, BMI, energy intake, fat intake, protein intake, dietary fibre intake, education level and physical activity level.
Several strengths must be noticed in our meta-analysis. First, a relatively larger number of participants included, with a reduction in sampling error to a huge extent, enabled a much greater possibility of reaching reasonable conclusions. Second, the interference of potential confounding factors, such as age, smoking status, BMI and physical activity level, was controlled to the greatest extent due to the most fully adjusted OR being extracted. Third, almost consistent associations were identified after undertaking extensive subgroup analyses, identifying the results as robust and credible.
Nevertheless, our study has potential limitations as well. First, most of the studies we included were cross-sectional in design; larger prospective cohort studies are needed to confirm these results. Second, although most major confounders had been adjusted for in most of the included studies, unmeasured and residual confounding was still possible. Confounders adjusted for in each study were also different, which might affect the observed association. Third, the MetS assessment methods differed among studies, which might have a certain influence on the results. However, due to the limited number of studies, we could not further explore the impact of inconsistent assessment methods on the strength of the associations. Fourth, due to insufficient data at present, we could not identify a dose–response relationship between fruit and vegetable consumption and the risk of MetS in the current meta-analysis.
Conclusions
The present meta-analysis indicates that fruit or/and vegetable consumption may be inversely associated with risk of MetS, separately. It suggests that people should consume more fruits and vegetables to decrease the risk of MetS.
Acknowledgements
Financial support: This research received no specific grant from any funding agency in the public, commercial or not-for-profit sectors. Conflict of interest: None. Authorship: Y.T. and X.J. conceived the study and participated in its design and coordination. Y.T. and L.S. carried out the literature search and data extraction. Y.T. and X.D. were involved in the interpretation of the data. Y.T. and J.W. drafted the manuscript and conducted its critical revision for important intellectual content. Ethics of human subject participation: Ethical approval was not required.
Supplementary material
To view supplementary material for this article, please visit https://doi.org/10.1017/S136898001700310X


