

Introduction
Lichens are excellent indicators of air pollution (Hawksworth & Rose Reference Hawksworth and Rose1970; Chaparro et al. Reference Chaparro, Lavornia, Chaparro and Sinito2013; Seed et al. Reference Seed, Wolseley, Gosling, Davies and Power2013). Many lichens are substantially affected by air pollution (Hawksworth & Rose Reference Hawksworth and Rose1970) and, depending on their pollution sensitivity with respect to compounds containing nitrogen, they can be classified as nitrophilic or nitrophobic (de Bakker Reference de Bakker1989; van Dobben Reference van Dobben1996; van Dobben & ter Braak Reference van Dobben and ter Braak1998). Since about the 1950s, SO2 air pollution has been a major concern, causing die-offs of lichens and rendering heavily polluted inner cities virtually lichen-free. Since the 1980s, populations of SO2-sensitive lichens have been able to recover to some degree in Central Europe (Heibel et al. Reference Heibel, Lumbsch and Schmitt1999; Vorbeck & Windisch Reference Vorbeck and Windisch2001). For example, in surveys in 1968, there were no foliose lichens at all in four sites within the city of Munich. However, by 1973, a small number of species had managed to recolonize the area (Vorbeck & Windisch (Reference Vorbeck and Windisch2001) and references therein).
Air pollution in the form of NO2 has remained constantly high in cities in Central Europe and is affecting lichen communities adversely, leading to decreased abundances of acidophilic lichens and increases of nitrophilic species. NO2 pollution levels were found to determine the species composition of epiphytic lichen communities on deciduous trees in the urban area of Munich in Germany, and all common species except one were nitrophilic (Sebald et al. Reference Sebald, Goss, Ramm, Gerasimova and Werth2022). In regions with depositions of NO2 and ammonia, acidophilic lichens have been largely replaced by nitrophilic ones (de Bakker Reference de Bakker1989; van Dobben & de Bakker Reference van Dobben and de Bakker1996; van Herk Reference van Herk2001; Gadsdon et al. Reference Gadsdon, Dagley, Wolseley and Power2010). For example, the nitrophilic Xanthoria parietina (L.) Th. Fr. has become highly abundant across Central Europe in areas with high levels of air pollution by nitrogen-containing compounds (de Bakker Reference de Bakker1989; Ruoss Reference Ruoss1999; Gaio-Oliveira et al. Reference Gaio-Oliveira, Branquinho, Maguas and Martins-Loucao2001; van Herk Reference van Herk2001) and in areas with high pollution from alkaline dust (Marmor & Randlane Reference Marmor and Randlane2007; Degtjarenko et al. Reference Degtjarenko, Marmor and Randlane2016a).
The population genetic structure of rare lichens such as Lobaria pulmonaria (L.) Hoffm. has been investigated in much detail, and at different spatial scales (Werth et al. Reference Werth, Wagner, Holderegger, Kalwij and Scheidegger2006, Reference Werth, Gugerli, Holderegger, Wagner, Csencsics and Scheidegger2007; Dal Grande et al. Reference Dal Grande, Widmer, Wagner and Scheidegger2012). Nitrophilic lichen species have received comparatively little attention with respect to population genetic analyses. Xanthoria parietina (Lecanoromycetes, Teloschistales) is one of the most widespread and common nitrophilic lichen species in Central Europe. The species occurs on a wide range of natural and anthropogenic substrata and can be recognized by its characteristic golden yellow colour which originates from its cortical pigment, parietin. The species is distributed from the Caucasus to westernmost Europe and from North to South Africa, and it can also be found in America (Lindblom Reference Lindblom1997; Fraser et al. Reference Fraser, Bowman, Gianopulos and Newcombe2016). This lichen once possibly had a more restricted distribution on nutrient-rich substrata but appears to have undergone a large population expansion and now dominates epiphytic lichen communities in many urban areas of Central Europe (Wirth et al. Reference Wirth, Hauck and Schultz2013; personal observations). For example, the lichen flora of four sites in the inner city of Munich were surveyed over the course of several decades (e.g. Vorbeck & Windisch Reference Vorbeck and Windisch2001; Sebald et al. Reference Sebald, Goss, Ramm, Gerasimova and Werth2022). In 1968, there were no foliose lichens at all and X. parietina was also absent from all sites. Xanthoria parietina was found in only one of the surveyed sites in 1973, but by the year 2000 it had recolonized all four inner city sites (Vorbeck & Windisch (Reference Vorbeck and Windisch2001) and references therein). We were interested to see if we could see signs of this population expansion in genetic data. Two scenarios could be predicted: if sites are colonized by just a small number of individuals and subsequent immigration remains low, one might see distinct genetic clusters in recolonized sites. Alternatively, high migration rates may homogenize the genetic structure among sites.
Large thalli of X. parietina are almost always fertile, their central thalline areas being covered by apothecia, the fruiting bodies with which the fungal partner reproduces sexually through ascospores (Itten & Honegger Reference Itten and Honegger2010). The two main sexual breeding systems in the filamentous Ascomycotina are either heterothallism, in which partners of the opposite mating type are required for sex to occur, or homothallism, in which single isolates are self-fertile whilst often retaining the ability to outcross. The sexual breeding system is determined by mating-type (MAT) genes at one or more mating-type (MAT) loci in the genome (Dyer et al. Reference Dyer, Inderbitzin, Debuchy and Wendland2016). Xanthoria parietina contains a MAT locus characteristic of heterothallic species, with only a single MAT1-2 gene detected rather than a combination of both MAT1-1 and MAT1-2 genes seen commonly in homothallic species (Pizarro et al. Reference Pizarro, Dal Grande, Leavitt, Dyer, Schmitt, Crespo, Lumbsch and Divakar2019). However, Honegger et al. (Reference Honegger, Zippler, Gansner and Scherrer2004b) found that the progeny of X. parietina from a single ascus were genetically homogeneous in terms of phenotypic features and DNA fingerprint patterns. Scherrer et al. (Reference Scherrer, Zippler and Honegger2005) also reported that all ascospore progeny contained a MAT1-2 gene at the MAT locus, rather than segregation of MAT genes seen in other heterothallic Xanthoria species. These results indicated that the species is able to reproduce via selfing, and Pizarro et al. (Reference Pizarro, Dal Grande, Leavitt, Dyer, Schmitt, Crespo, Lumbsch and Divakar2019) speculated that X. parietina might exhibit a novel form of homothallism known as unisexuality (Heitman et al. Reference Heitman, Carter, Dyer and Soll2014).
While X. parietina does not produce specific vegetative propagules, there are ways for the species to disperse both partners vegetatively. Lichenivorous invertebrates feed on the apothecia and thalli of the lichen, and their faecal pellets may contain viable hyphae, ascospores, and Trebouxia photobiont cells (Meier et al. Reference Meier, Scherrer and Honegger2002; Boch et al. Reference Boch, Prati, Werth, Rüetschi and Fischer2011). Birds may passively carry lichen-containing invertebrate faecal pellets with them and disperse the lichens over long distances (Meier et al. Reference Meier, Scherrer and Honegger2002).
Xanthoria parietina forms a lichen symbiosis with Trebouxia, a genus of green-algal photobionts. Saxicolous or epilithic thalli of X. parietina associate with the green alga Trebouxia arboricola, while epiphytic thalli form lichen symbioses with T. decolorans (Nyati et al. Reference Nyati, Werth and Honegger2013, Reference Nyati, Scherrer, Werth and Honegger2014). It is assumed that Trebouxia species are exclusively asexual (Friedl & Büdel Reference Friedl, Büdel and Nash2008) and they are unable to reproduce sexually while in lichen symbiosis. Trebouxia algae are able to live without their fungal partner; however, free-living Trebouxia populations are small and do not seem to be persistent (Bubrick et al. Reference Bubrick, Galun and Frensdorff1984; Mukhtar et al. Reference Mukhtar, Garty and Galun1994; Sanders Reference Sanders2005; Wornik & Grube Reference Wornik and Grube2010). Honegger et al. (Reference Honegger, Zippler, Scherrer and Dyer2004a) investigated the presence of genetic diversity in worldwide samples of X. parietina using RAPD-PCR fingerprinting of axenically cultured ascospore discharge. They found evidence for two main groups based on phylogenetic analysis, namely an Iberian branch from south-west Europe versus all other global isolates that formed a separate grouping. In a subsequent study, Itten & Honegger (Reference Itten and Honegger2010) found low but significant regional genetic differentiation and high genetic diversity within five western and Central European populations of X. parietina, again based on RAPD-PCR fingerprinting of axenically cultured specimens. The Trebouxia photobionts of these X. parietina lichens also exhibited high genetic variability (Nyati et al. Reference Nyati, Werth and Honegger2013). It remains unknown whether populations of X. parietina are also structured if smaller geographical areas are investigated, and how much genetic diversity is found in urban areas and along pollution gradients.
We developed new microsatellites for X. parietina taking advantage of this fungal species’ publicly available whole genome sequence to study genetic diversity and structure at small spatial scales. Moreover, we used existing microsatellites developed for T. decolorans (Dal Grande et al. Reference Dal Grande, Beck, Singh and Schmitt2013, Reference Dal Grande, Alors, Divakar, Bálint, Crespo and Schmitt2014a) to investigate the genetic structure of the photobiont in order to compare the genetic structure among the symbionts. We carried out our investigations in the urban area of Munich, Bavaria, and included a site with clean air in southern Bavaria for comparison. Our main research question was whether there is significant genetic differentiation in populations of X. parietina and its green-algal photobiont T. decolorans at small spatial scales. We discuss the results in the light of air pollution levels and the history of X. parietina populations in Munich.
Methods
Sample collection
Xanthoria parietina was collected between May and July 2018 from seven urban sampling sites in the city of Munich (Botanical Garden, Flaucher, Freimann, Landshuter Allee, Lothstraße, Pasing and Stachus), representing parks and other green spaces within the city and in one remote site 110 km away with relatively clean air (< 1.71 μg m−3 NO2, 3.35 μg/m3 SO2 according to Sebald et al. (Reference Sebald, Goss, Ramm, Gerasimova and Werth2022)) located in Hinterstein (Oberallgäu) (Fig. 1; see Table 1 for latitude and longitude details). From each location, we collected X. parietina samples from the trunk of six deciduous trees which were at least 10 m apart (28 Acer sp., 10 Fraxinus excelsior, 6 Fagus sylvatica, 2 Betula sp., 1 Malus sp., 1 Prunus sp., 1 Platanus × hispanica, 1 Aesculus hippocastaneum). From each tree, at least two thalli of X. parietina were collected; in total 112 samples were included in the analysis.
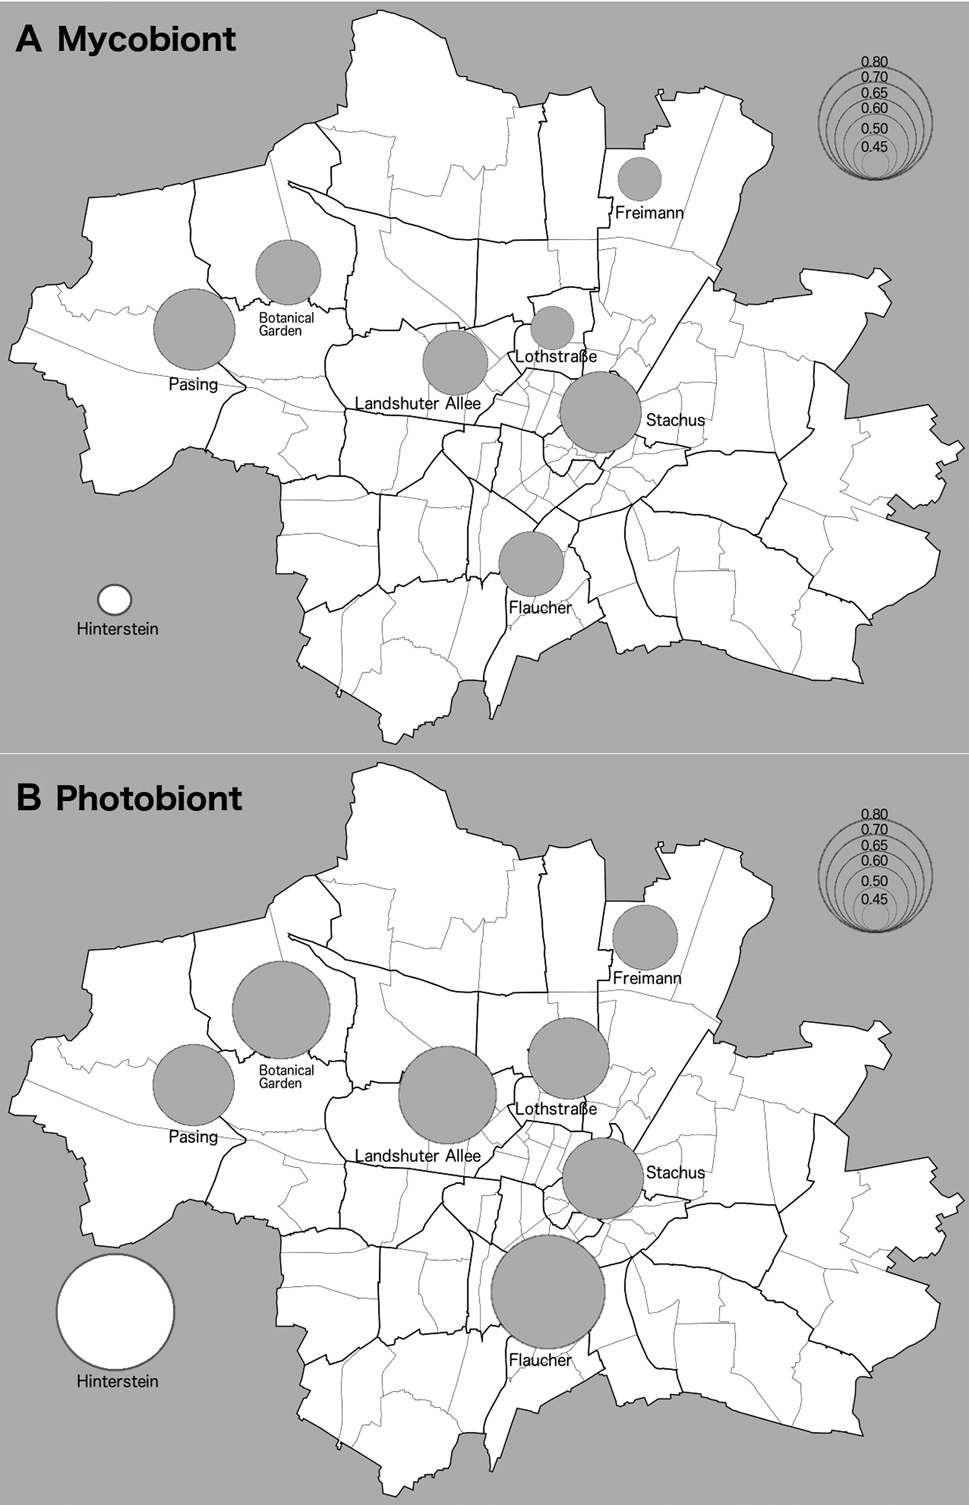
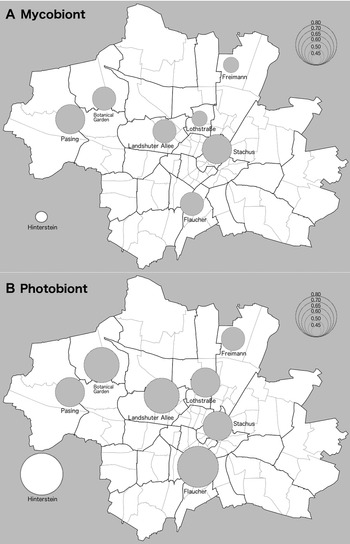
Map of Nei's gene diversity in populations of Xanthoria parietina and its photobiont. Size of circles is proportional to gene diversity at sampling sites as per key in the top right-hand side of figures. Seven of the sampling sites were located in the city of Munich (Bavaria, Germany). The inset represents a geographically distant population located in an area with clean air (Hinterstein valley, Oberallgäu). A, mycobiont. B, photobiont. Base map by Maximilian Dörrbecker, shared via Wikimedia Commons (https://de.m.wikipedia.org/wiki/Datei:M%C3%BCnchen_-_Stadtbezirke_und_Stadtbezirksteile_(Karte).svg: accessed 29 March 2021).
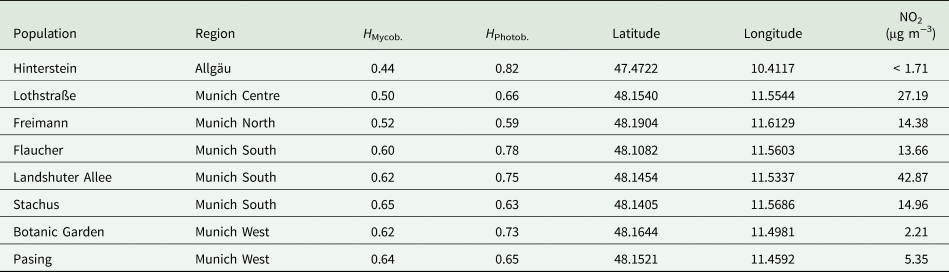
Data for eight populations of Xanthoria parietina sampled in southern Bavaria, Germany. The table provides Nei's gene diversity H of the mycobiont and photobiont (higher values of H correspond to greater diversity) as well as the geographical location of the sampling sites (decimal degrees, map datum WGS84). NO2 data represent averages of two measurements and were taken from Sebald et al. (Reference Sebald, Goss, Ramm, Gerasimova and Werth2022).
Air pollution analyses
For comparative purposes, air pollution data were generated with NO2/SO2 diffusion measuring tubes and analyzed by ion chromatography at Gradko Environmental, as described in Sebald et al. (Reference Sebald, Goss, Ramm, Gerasimova and Werth2022). In each site except Lothstraße, two devices were analyzed; in Lothstraße, one device went missing. Diffusion tubes were exposed on average for 359 h (range 338.5–383.25). NO2/SO2 data from our sampling sites have been reported by Sebald et al. (Reference Sebald, Goss, Ramm, Gerasimova and Werth2022).
Laboratory work
DNA extraction
Total genomic DNA was extracted from small terminal lobes of the lichen thalli, to avoid extracting DNA of multiple individuals intermingled since the lichens tended to grow on top of each other. We extracted the DNA of X. parietina following the protocol from Werth et al. (Reference Werth, Reynisdóttir, Guðmundsson and Andrésson2016). DNA samples were stored at −20 °C until processing.
Primer design, PCR and DNA sequencing
We developed and tested new microsatellites for the mycobiont X. parietina based on this species’ genome (sequenced based on an axenic fungal culture) available through DOE-JGI Joint Genome Institute (https://mycocosm.jgi.doe.gov/Xanpa2/Xanpa2.home.html) (Table 2). To find microsatellites and design primers, the genomic data was analyzed with the software MSATCOMMANDER v. 0.8.2 (Faircloth Reference Faircloth2008) which implemented the Primer3 software (Rozen & Skaletsky Reference Rozen, Skaletsky, Krawetz and Misener2000). Microsatellite markers for the photobiont, Trebouxia decolorans, were based on an existing study where the microsatellites were developed on the basis of axenic algal cultures (Dal Grande et al. Reference Dal Grande, Beck, Singh and Schmitt2013).
Newly developed microsatellites for the lichenized fungus Xanthoria parietina. The table shows the forward and reverse primer names and sequences (5ʹ–3ʹ), microsatellite motif, number of repeats (Rep), the genomic scaffold on which the locus is located, and alignment coordinates on the scaffold (start_bp, end_bp), as well as the product size in the sample used for genome sequencing, the number of alleles (NA) and the percentage of missing data (% Missing). Scaffold names and alignment coordinates refer to the Xanpa1 genome assembly of Xanthoria parietina (DOE-JGI Joint Genome Institute). Note that locus Xpa15 did not amplify in our final PCRs and was therefore excluded.
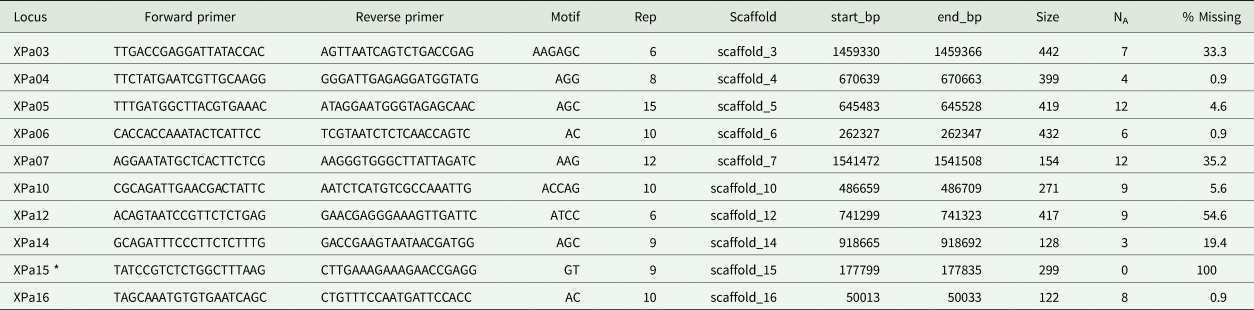
*No successful amplifications
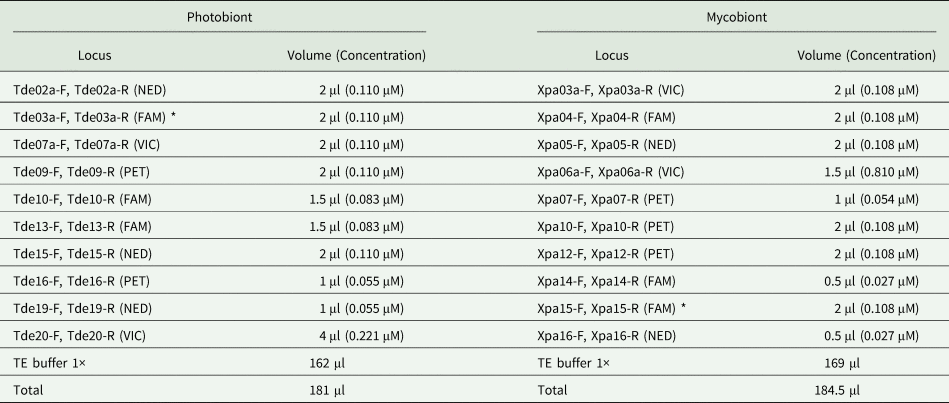
For the microsatellite analysis, 10 primer pairs for the mycobiont X. parietina (Xpa), each located on a different genomic contig and thus presumably unlinked, were used in the PCR. Moreover, 10 loci were included for the photobiont T. decolorans. Primers were ordered from Microsynth, Balgach, Switzerland. After optimizing primer concentrations for the photobiont (primer names starting with ‘Tde’) with 1:5 diluted DNA samples, the most efficient mix was chosen (Table 3). Primer concentrations had to be optimized because we found that some microsatellites initially produced too strong signals and others were very low. After these preliminary tests, we did not need to dilute the DNA in order to increase the quality of the results.
Primer mixes for the lichenized fungus Xanthoria parietina (Xpa) and its photobiont Trebouxia decolorans (Tde). NED, VIC, FAM and PET refer to the fluorescent dye labels located at the 5ʹ end of each reverse primer. Each primer stock solution was 10 μM. Note that two primers included in the mix marked with an asterisk (*) did not amplify successfully.
For the PCR, 4.5 μl PCR-mix (consisting of 0.5 μl of the respective primer mix, 2.5 μl 2× Qiagen Type-IT Master Mix and 1.5 μl nuclease-free water) and 0.5 μl of total genomic DNA (30–70 ng μl−1) was added to 96-V-Thin-Wall-MT-Plates. Amplification was performed in a T100 Thermal Cycler (Bio-Rad, Feldkirchen) with an initial denaturation step at 95 °C for 3 min, followed by 35 cycles of 1 min at 95 °C, 10 s at 95 °C, 60 s at 55 °C and 30 s at 72 °C, with a final elongation at 72 °C for 5 min.
A total of 39 μl of ddH2O were added to the PCR product, and 1 μl of the dilution was taken and combined with 8.5 μl Hi-Di Formamide and 0.5 μl LIZ 500 (Applied Biosystems), an internal size standard. Fragment length analysis was performed at the Genetics Sequencing Service located in the Faculty of Biology at the Ludwig Maximilian University in Munich, with dye set G5 on an ABI 3730 capillary sequencer (Applied Biosystems). Microsatellite genotyping was performed with Geneious v. 6.1 (https://www.geneious.com) with which fragments were sized with the aid of the internal size standard LIZ500.
During the data analyses, we noticed that one of the primer pairs for T. decolorans (Tde-3a-FAM) had high amounts of missing data and it was therefore excluded from further analyses. In addition, locus Xpa-15 from the mycobiont did not yield products and was excluded. Thus, the total number of markers was nine for the Trebouxia photobiont and nine for the Xanthoria parietina mycobiont. The final dataset contained data for 102 samples of T. decolorans and 112 of X. parietina.
Data analysis
Nei's gene diversity was calculated in Arlequin v. 3.5 (Excoffier & Lischer Reference Excoffier and Lischer2010). Univariate linear regression was used to test for a relationship between gene diversity of the mycobiont and photobiont and NO2 pollution levels. Principal coordinates analysis (PCoA) and multilocus match analysis were performed with GenAlEx v. 6.5 (Peakall & Smouse Reference Peakall and Smouse2012) in order to see how different the microsatellite genotypes were from each other, and if there was a grouping of similar genotypes by population. An analysis of molecular variance (AMOVA) was performed with GenAlEx v. 6.5 to test if there was population structure at different hierarchical scales. For this purpose, the populations were divided into five regions (West, Central, North, South Munich, and Allgäu; see Fig. 1, Table 1).
Population structure was analyzed with STRUCTURE v. 2.3.4 (Pritchard et al. Reference Pritchard, Stephens and Donnelly2000) using an admixture model without prior population information, where allele frequencies were correlated among populations. Different values of FST were assumed for different subpopulations (mean prior: 0.01). The allele frequency parameter was constant (1.0). In each run, the parameter for the degree of admixture, α, was inferred, starting with an initial value of 1.0 (maximum 10). Using these settings, STRUCTURE was run 20 times for K = 1 to K = 8 (number of populations) with a burn-in period of 5000 and 50000 MCMC reps after burn-in. To compute the most likely number of clusters, the ΔK statistic was used as implemented in STRUCTURE HARVESTER, web v. 0.6.94 (Earl & von Holdt Reference Earl and von Holdt2012). The bar plots were created with the CLUMPAK web software (http://clumpak.tau.ac.il; accessed 29 March 2021) (Kopelman et al. Reference Kopelman, Mayzel, Jakobsson, Rosenberg and Mayrose2015).
Results
Mycobiont
Nei's gene diversity of the Xanthoria parietina mycobiont ranged from 0.44 to 0.65 (Table 1, Fig. 1A). Stachus and Pasing were the populations with the highest mycobiont gene diversity (average 0.65). The control area with high air quality in the Hinterstein valley had the lowest gene diversity in the mycobiont (0.44). There was no statistically significant relationship between mycobiont gene diversity and NO2 pollution levels as assessed by a univariate linear regression model.
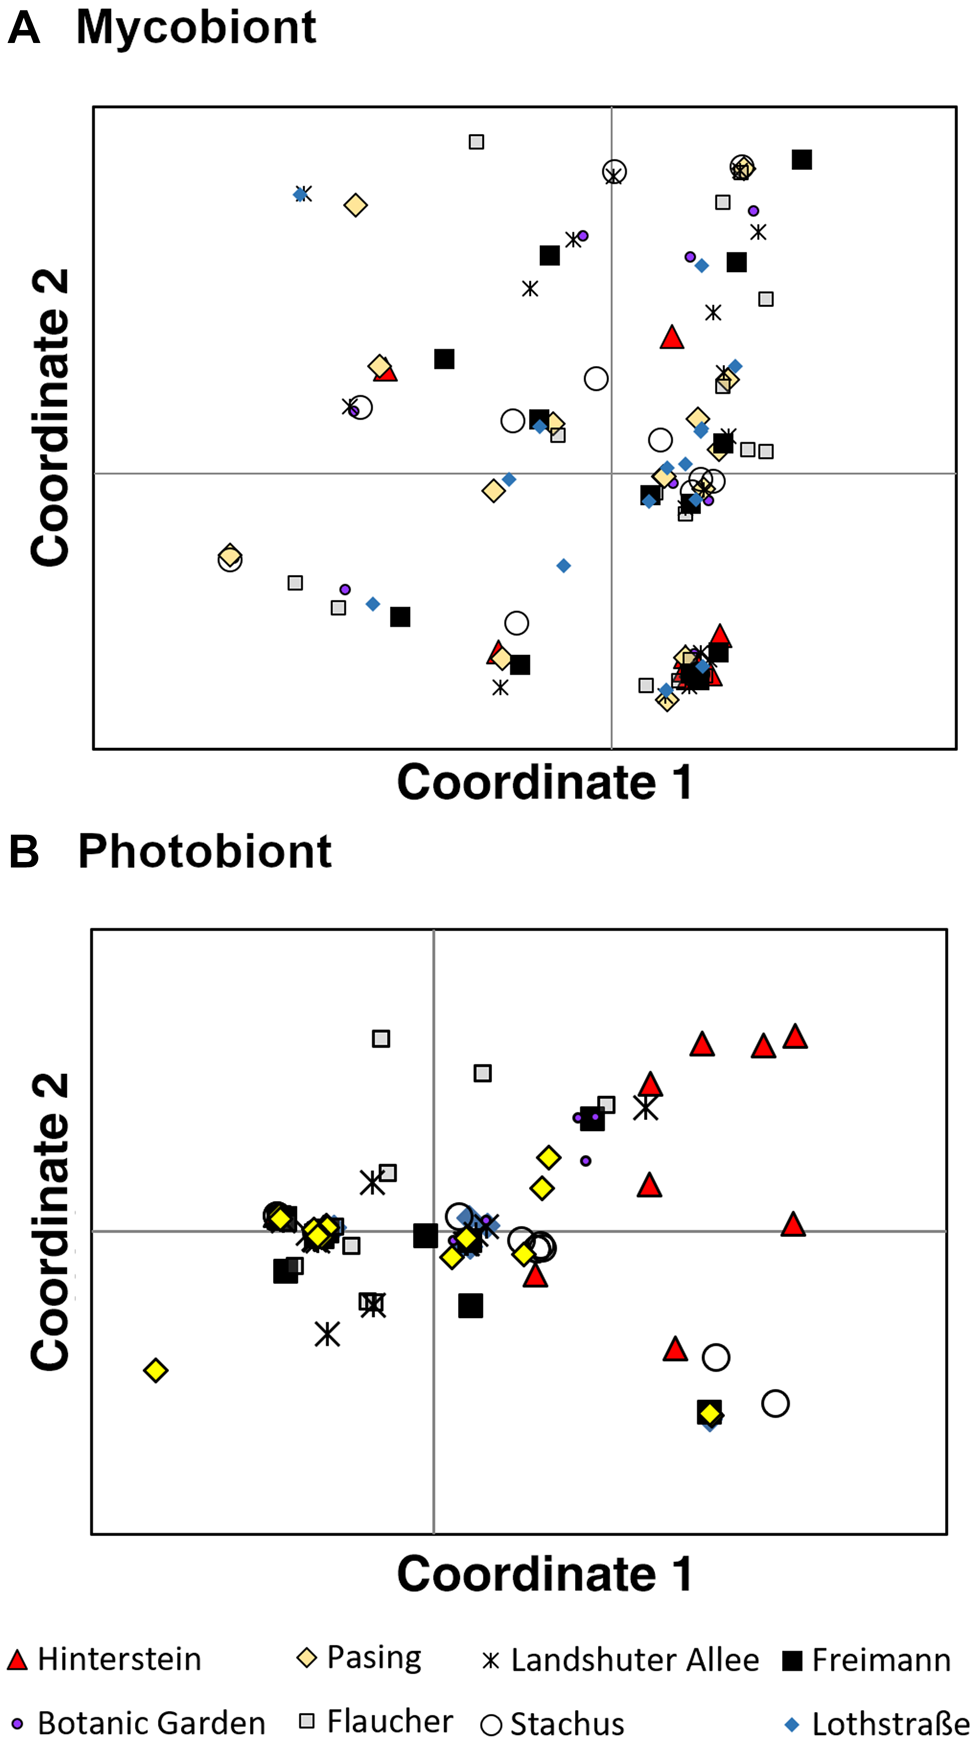
PCoA was performed to visualize similarities among mycobiont genotypes (Fig. 2A). The first PCoA axis explained 24.2% of the variance in the data, the second axis 18.22%. Some genotypes clustered together, such as those in the lower right corner of the PCoA plot. These points, however, did not consist of samples originating from the same population, as one would expect if these contained similar genotypes. The samples from different populations were found more or less scattered across the plot, indicating an absence of population structure.
Principal coordinates analysis of eight populations of Xanthoria parietina and its photobiont in Munich (Bavaria, Germany). Patterns displayed for the first two axes. Each point represents a thallus and symbols represent different populations. A, mycobiont. B, photobiont. In colour online.
There were four repeated multilocus genotypes in the mycobiont: A, B, C and D (see Supplementary Material Table S1, available online). The remaining samples had different genotypes. Repeated genotypes A and C consisted of samples from locations that were geographically close (Stachus, Lothstraße and Landshuter Allee). The samples from the repeated genotypes B and D, on the other hand, came from locations geographically further away from each other.
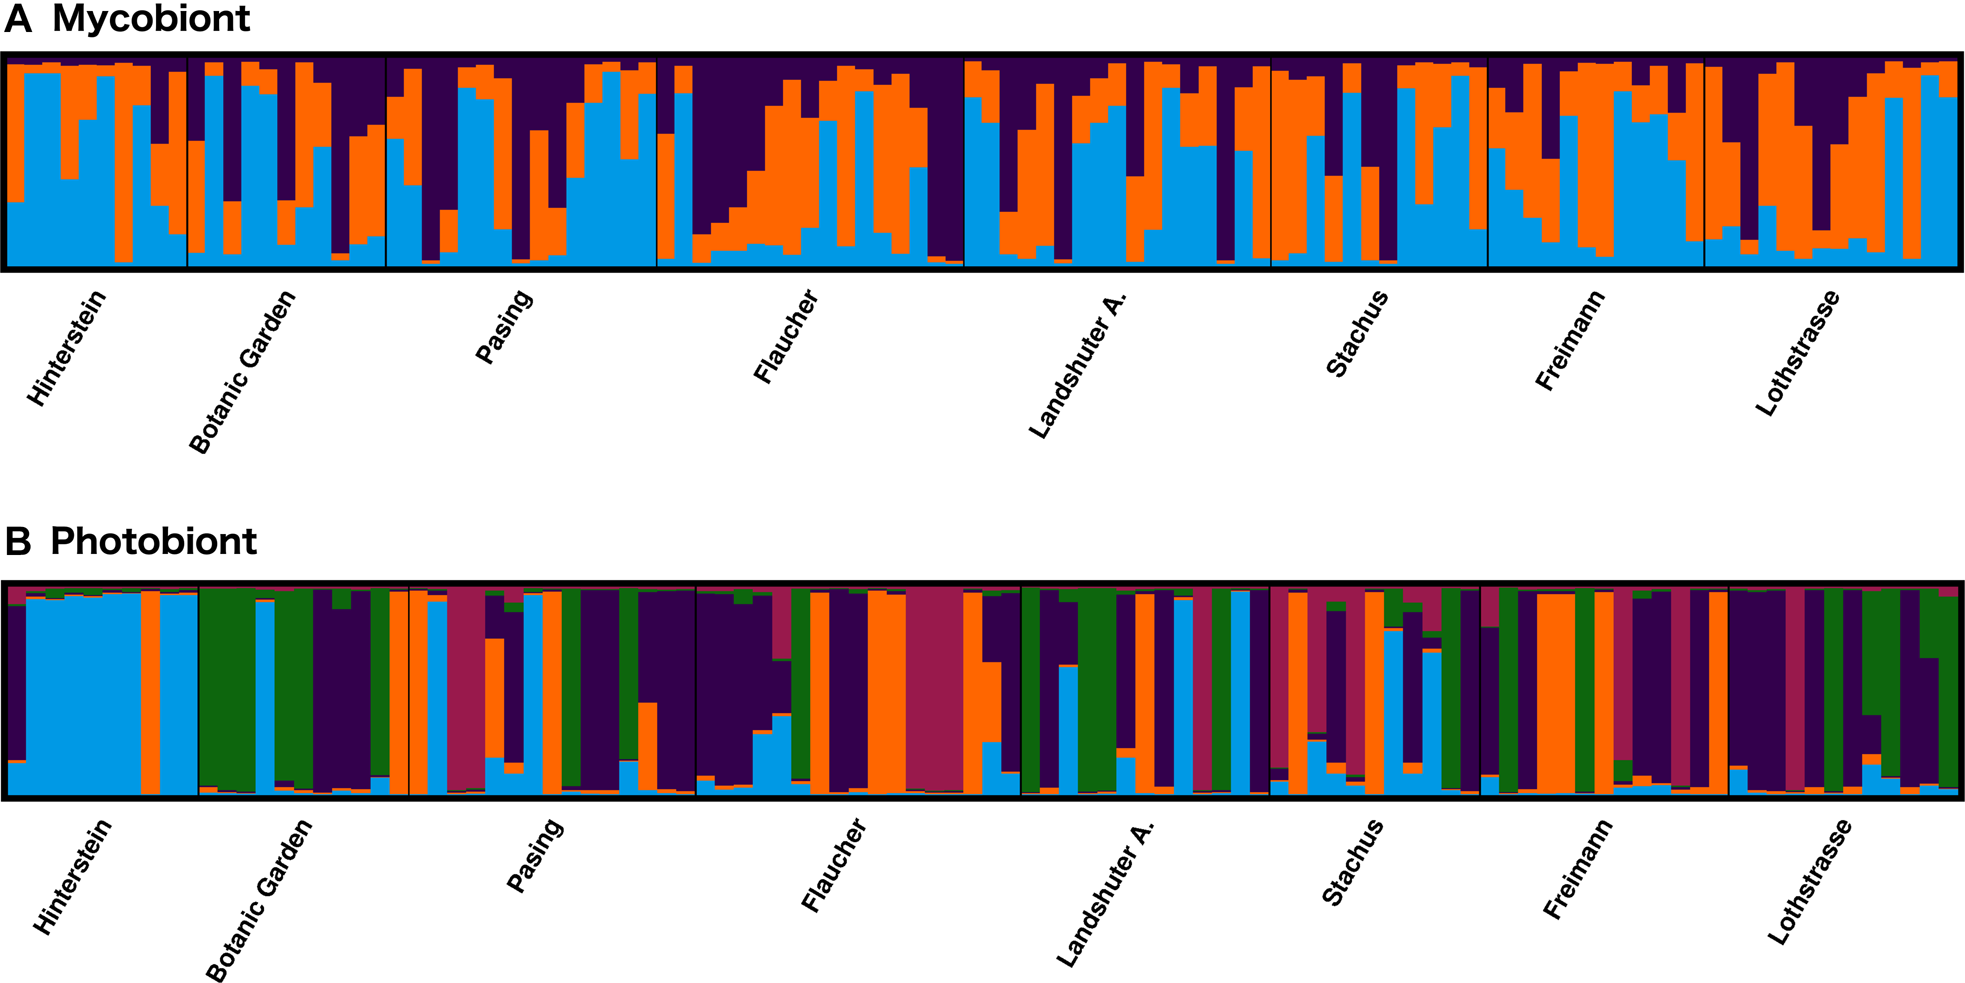
There was no population structure in the mycobiont, with AMOVA resulting in no significant genetic differentiation between regions (ϕRT = 0.028, P = 0.169) or populations (ϕPT = 0.032, P = 0.094). Nor was any structure found between regions or populations when changing the grouping of populations to consider Landshuter Allee as a ‘central’ population (data not shown). Nevertheless, three genetic clusters were inferred by Bayesian analysis of population structure with the delta K method (Supplementary Material Figs S1 & S2, available online), but none of these mycobiont genetic clusters showed any geographical tendencies (Fig. 3A). Instead, there was high admixture in the studied individuals, with most individuals having ancestry in more than one genetic cluster (Fig. 3A). Sampling sites in the inner city area (e.g. Stachus, Lothstraße, Landsberger Allee) that were situated within the lichen desert zone in the late 1960s (Vorbeck & Windisch Reference Vorbeck and Windisch2001) were not populated by a single genetic cluster or genetically similar individuals, but by several genetic clusters and genetically admixed individuals. Moreover, genetic distance-based population trees showed no clustering of nearby populations (Supplementary Material Fig. S7, available online). For example, the spatially proximate Pasing and Botanical Garden populations did not group together.
Bayesian analysis of population structure for nine microsatellite markers of Xanthoria parietina and nine microsatellite markers of its photobiont, showing the affiliation of individuals (vertical bars) to genetic clusters (STRUCTURE software). A, mycobiont with three clusters evident (shown in blue, orange, purple). B, photobiont with five clusters evident (shown in blue, green, orange, purple, red). In colour online.
Photobiont
Nei's gene diversity of the photobiont T. decolorans ranged between 0.59–0.82 (Table 1, Fig. 1B). Hinterstein had by far the highest gene diversity in the photobiont (0.82). The urban sites in Munich Botanic Garden, Flaucher and Landshuter Allee also showed high photobiont gene diversity with values > 0.7. The photobiont population in Freimann had the lowest gene diversity (0.59). We found no significant relationship between gene diversity and air pollution levels in univariate linear regressions (Table 1).
There was substantially more genetic structure in the photobiont of X. parietina than in its mycobiont. In PCoA, the first axis explained 34.7% of the variance in the data, the second axis 24.4%. The Hinterstein, Stachus and Flaucher populations showed some distinct genotypes, while the samples from the remaining Munich populations largely overlapped (Fig. 2B).
Altogether 10 repeated multilocus genotypes were found (A–J; Supplementary Material Table S2, available online). There was no tendency for recurrent photobiont genotypes to be found only in nearby sites; they appeared to be rather widespread within Munich.
In the photobiont, there was substantial genetic differentiation among regions in AMOVA (8%; ϕRT = 0.080; P = 0.005) and between populations (13%; ϕPT = 0.128; P = 0.001). When the grouping was changed to consider Landshuter Allee as a central population, there was still significant differentiation between geographical regions (data not shown). The genetic differentiation was mainly due to the Hinterstein population; when this population was removed, no significant genetic differentiation between populations remained (data not shown). Bayesian analysis of population structure revealed either two or five genetic clusters: delta K values had a bimodal distribution with maxima at K = 2 and K = 5 (Supplementary Material Figs S3–S6, available online). However, in contrast to the mycobiont data, some photobiont genetic clusters had a tendency to be restricted to specific locations (Fig. 3B). As expected in a predominantly clonal organism, only a small number of photobiont individuals were admixed (see bar plots from STRUCTURE analysis; Fig. 3). In a genetic distance-based population tree, spatially proximate populations mostly did not group together, with the exception of Lothstraße and Landshuter Allee populations which were geographically close and clustered together (Supplementary Material Fig. S7B, available online).
Discussion
In the present study, we developed nine new polymorphic microsatellite markers (Table 2) and investigated genetic diversity and population differentiation in the homothallic, sexually reproducing lichen-forming fungus Xanthoria parietina. The new fungal microsatellites were found to exhibit suitably high levels of genetic variability, and our results showed that they are appropriate for the study of population genetic diversity and genetic differentiation since they were able to detect distinct genetic clusters within local populations of X. parietina. We also studied the photobiont's genetic variation based on a set of existing microsatellite markers. This revealed that the photobionts had high variability within populations (Table 1). Finally, we compared the mycobiont's population genetic structure with that of its green-algal photobiont.
Prior studies of X. parietina found a pattern reminiscent of isolation by ecology (for definition, see Sexton et al. (Reference Sexton, Hangartner and Hoffmann2014)): when populations growing on bark and rock substrata were investigated, substantial genetic differentiation was found between them, but not within (Lindblom & Ekman Reference Lindblom and Ekman2006, Reference Lindblom and Ekman2007). Therefore, it is conceivable that the environment creates a selection pressure favouring specific, substratum-adapted mycobiont genotypes. Since we focused on bark substrata in our study, less genetic differentiation was expected and indeed we found a lack of population structure (i.e. no distinct populations) in the lichen fungus X. parietina in the studied populations in southern Bavaria. Populations of lichen mycobionts which were not structured at all have been found by others, for example in Ramalina menziesii Taylor (Werth & Sork Reference Werth and Sork2010), interestingly even in the predominantly clonal lichen species Usnea subfloridana Stirt. (Degtjarenko et al. Reference Degtjarenko, Tõrra, Mandel, Marmor, Saag, Scheidegger and Randlane2018, Reference Degtjarenko, Jüriado, Mandel, Tõrra, Saag, Scheidegger and Randlane2019), and sometimes even at large spatial scales, (i.e. across the Mediterranean and Macaronesia in Parmelina carporrhizans (Taylor) Hale; Alors et al. Reference Alors, Grande, Cubas, Crespo, Schmitt, Molina and Divakar2017). Similar to our findings, other studies conducted at a larger spatial scale and employing other marker types found little genetic differentiation between populations of the mycobiont of X. parietina growing on bark substrata (Lindblom & Ekman Reference Lindblom and Ekman2006, Reference Lindblom and Ekman2007; Itten & Honegger Reference Itten and Honegger2010).
Population genetic structure depends on numerous factors. Particularly important is gene flow, that is the number of migrants exchanged per generation between populations (Wright Reference Wright1931). Gene flow wipes out genetic structure by homogenizing allele frequencies among populations and it takes only a small number of migrants per generation to remove any genetic differentiation (Wright Reference Wright1931). Another factor influencing population structure is population size. Lichenized fungi forming small populations tend to have higher levels of genetic differentiation (e.g. Werth et al. Reference Werth, Gugerli, Holderegger, Wagner, Csencsics and Scheidegger2007, Reference Werth, Meidl and Scheidegger2021). Populations which are genetically isolated change their allele frequencies over time in a process known as random genetic drift. In small populations, fewer generations are necessary for allele frequencies to drift apart than in large populations. The aforementioned examples of lichen species showing panmixia (random mating) such as Parmelina carporrhizans or Ramalina menziesii represent common species forming large populations, which might partly explain their lack of population structure. In one of these common lichens, the mycobiont showed panmixia at the local scale (Werth & Sork Reference Werth and Sork2008), but there was considerable population structure when the entire geographical range of the fungus was investigated and several genetic lineages were found (Sork & Werth Reference Sork and Werth2014).
We expected clonal propagation to be of low importance in determining population structures because X. parietina lacks easily dispersed clonal propagules such as soredia or isidia with which mycobiont and photobiont are co-dispersed. Vegetative propagation by symbiotic propagules does not seem to be an important reproductive mode in the studied populations of X. parietina, as indicated by the incongruence between fungal and algal genetic patterns and the scarcity of repeated fungal multilocus genotypes. Xanthoria parietina is not known to form vegetative propagules but the species could in principle disperse vegetatively when eaten by invertebrates whose faeces are known to contain viable fungal and algal cells (Meier et al. Reference Meier, Scherrer and Honegger2002), or when thallus fragments are dispersed. Co-dispersal of the mycobiont and photobiont mediated by vegetative propagules must be rare, and dispersal in X. parietina may occur mainly through the mycobiont's microscopic ellipsoid ascospores (size range 12.9–16.0 × 5.9–8.7 μm; Lindblom Reference Lindblom1997). At least in the studied areas in Munich and Allgäu, almost all large-sized individuals of X. parietina were fertile (i.e. apotheciate and thus able to produce ascospores). We know from a study of the lichen Lobaria pulmonaria that large and heavy symbiotic propagules disperse over a distance two orders of magnitude shorter on average than microscopic ascospores (Ronnås et al. Reference Ronnås, Werth, Ovaskainen, Várkonyi, Scheidegger and Snäll2017). One possible reason why there was no association between geography and genetic structure in our data might therefore be that the mycobiont disperses mainly with its presumably far-reaching, microscopic ascospores. Large symbiotic propagules (e.g. thallus fragments) should lead to more genetic structure than smaller propagules because they do not reach as far and consequently there should be less gene flow (but see Werth et al. (Reference Werth, Cheenacharoen and Scheidegger2014)).
While exhibiting a MAT locus characteristic of heterothallic species (Pizarro et al. Reference Pizarro, Dal Grande, Leavitt, Dyer, Schmitt, Crespo, Lumbsch and Divakar2019), Honegger et al. (Reference Honegger, Zippler, Scherrer and Dyer2004a) reported that X. parietina appears to show breeding behaviour consistent with selfing (homothallism). This was supported by mating-type (MAT) gene analysis, with all progeny shown to be of the same MAT genotype as seen elsewhere in homothallic ascomycete species (Scherrer et al. Reference Scherrer, Zippler and Honegger2005; Dyer et al. Reference Dyer, Inderbitzin, Debuchy and Wendland2016). If a haploid fungus reproduces via selfing, its offspring will be identical to the parent, leaving a genetic footprint resembling clonality (Murtagh et al. Reference Murtagh, Dyer and Crittenden2000). By contrast, outcrossing would be predicted to shuffle the alleles originating from the maternal and paternal individuals due to random chromosomal segregation. However, it is important to note that many fungal species that are able to undergo selfing are not restricted to self-fertility, and can instead outcross if a suitable opportunity arises, and indeed outcrossing might be favoured (Dyer et al. Reference Dyer, Inderbitzin, Debuchy and Wendland2016). Several lines of evidence from the present study indicate that outcrossing does seem to occur in X. parietina: i) the finding that most multilocus genotypes occurred only once points towards their origin by sexual reproduction involving outcrossing; ii) most fungal individuals were found to be admixed (i.e. having ancestry in several genetic clusters), noting that matings involving outcrossing among individuals belonging to different gene pools would create such an admixed pattern. Thus, our data suggest that outcrossing has occurred in the X. parietina mycobiont and seems to have resulted in large within-population variability. There are various ways in which species containing a single heterothallic form of a MAT locus may become self-fertile (homothallic). It may be achieved via secondary homothallism, also referred to as pseudohomothallism. One way this is enabled is by the occurrence of two genetically different nuclei in each ascospore, one of each mating type, as is the case for example in Neurospora tetrasperma Shear & B.O. Dodge (Boddy Reference Boddy, Watkinson, Boddy and Money2016; Wilson et al. Reference Wilson, Gabriel, Singer, Schuerg, Wilken, van der Nest, Wingfield and Wingfield2021). Since this type of secondary homothallism results in dinucleate hyphae from the onset, the resulting mycelia are dinucleate and in microsatellite data one should frequently detect two alleles per locus. However, we found no such evidence of two alleles per microsatellite locus in a given sample, and therefore our data exclude this possibility of pseudohomothallism. A second type of pseudohomothallism occurs in some fungal species whose cells can switch their mating type, which enables a single culture to be self-fertile (Lin & Heitman Reference Lin, Heitman, Heitman, Kronstad, Taylor and Casselton2007). However, Scherrer et al. (Reference Scherrer, Zippler and Honegger2005) found no evidence of a MAT1-1 gene elsewhere in the genome to allow such switching. Although we found some repeated genotypes, there was also clear evidence of outcrossing (i.e. admixed fungal individuals), which further makes mating-type switching unlikely. The third way a genetically heterothallic species can undergo selfing is by ‘unisexuality’, where an individual of a single mating type can undergo selfing, which is thought to be enabled by mutations in specific genes involved in the initiation of sexual reproduction (Wilson et al. Reference Wilson, Gabriel, Singer, Schuerg, Wilken, van der Nest, Wingfield and Wingfield2021). Our data overall is therefore consistent with the suggestion of unisexuality, as proposed by Pizarro et al. (Reference Pizarro, Dal Grande, Leavitt, Dyer, Schmitt, Crespo, Lumbsch and Divakar2019). However, additional studies are required to quantify the frequency of outcrossing in X. parietina and to screen for possible causal mutations typical for unisexual fungi (Wilson et al. Reference Wilson, Gabriel, Singer, Schuerg, Wilken, van der Nest, Wingfield and Wingfield2021).
Xanthoria parietina mycobionts were genetically admixed (i.e. with each individual having ancestry in multiple gene pools). By contrast, most individuals of the photobionts predominantly had ancestry in only one genetic cluster. This latter pattern implies that sexuality involving recombination between individuals is rare in the Trebouxia photobionts of X. parietina. These findings are also in line with the hypothesis that photobionts should be clonal while in lichen symbiosis (Honegger Reference Honegger1993).
If mycobiont and photobiont were mainly co-dispersed, their genetic structures should be congruent, such as in Swiss Lobaria pulmonaria and its Symbiochloris reticulata photobiont (Werth & Scheidegger Reference Werth and Scheidegger2012). Conversely, if there was little co-dispersal of lichen symbionts, differences in mycobiont and photobiont genetic structures would be expected. This is also what we observed for X. parietina: the degree of genetic differentiation was fundamentally different in the mycobiont and photobiont. While the mycobiont showed no population structure, populations of the photobiont of X. parietina were substantially structured. For example, gene pools of the mycobiont did not show geographical separation in a Bayesian analysis of population structure and individuals were admixed, indicating an absence of population structure, while there was more of a geographical pattern in the photobiont, with also far less admixture of individuals. Moreover, genotypes in the principal coordinates analysis showed no clustering by population in the mycobiont, while there was some distinctiveness of the Hinterstein, Stachus and Flaucher populations in the photobiont. Analysis of molecular variance showed significant differentiation between populations in the photobiont but not the mycobiont. Previous studies have found a similar pattern of more genetic structure in photobiont than in mycobiont populations (Werth & Sork Reference Werth and Sork2010; Lutsak et al. Reference Lutsak, Fernández-Mendoza, Kirika, Wondafrash and Printzen2016). Some studies indicate that Trebouxia photobionts can be structured by ecological factors such as the tree species they are growing on, or other habitat-related factors (Werth & Sork Reference Werth and Sork2010, Reference Werth and Sork2014). When lichen-forming fungi disperse to new sites with the tiny ascospores resulting from sexual reproduction, they are able to form a novel symbiosis with a locally adapted photobiont (Werth & Sork Reference Werth and Sork2010, Reference Werth and Sork2014; Lutsak et al. Reference Lutsak, Fernández-Mendoza, Kirika, Wondafrash and Printzen2016). This should be highly advantageous for spores dispersing over long distances and that reach sites outside of the species’ climatic optimum, because in this way, at least one partner of the symbiosis is adapted to the environment. In our study, the genetic differentiation between populations of the photobiont was mainly due to the remote Hinterstein population, indicating that at very fine spatial scales there was no detectable genetic structure in the photobiont.
Genetic diversity was higher in the photobiont of X. parietina than in its mycobiont. A similar pattern of higher photobiont than mycobiont genetic diversity has been found previously for the lichen Cetraria aculeata (Schreb.) Fr. sampled from different continents (Lutsak et al. Reference Lutsak, Fernández-Mendoza, Kirika, Wondafrash and Printzen2016). In lichens, one mycobiont species can associate with more than one photobiont species. Although some improvements have been made in recent years to generate more realistic species concepts of photobionts (Škaloud & Peksa Reference Škaloud and Peksa2010; Malavasi et al. Reference Malavasi, Škaloud, Rindi, Tempesta, Paoletti and Pasqualetti2016; Škaloud et al. Reference Škaloud, Friedl, Hallmann, Beck and Dal2016), the species concepts of several lichen photobiont groups still need to be clarified and algal morphospecies may represent multiple phylogenetic species (Kroken & Taylor Reference Kroken and Taylor2000). The photobionts of X. parietina belong to the Trebouxia arboricola–T. decolorans species complex, for which 34 OTUs have been reported which may represent different species (Leavitt et al. Reference Leavitt, Kraichak, Nelsen, Altermann, Divakar, Alors, Esslinger, Crespo and Lumbsch2015). Microsatellites usually only amplify the species they were developed for, or closely related species. We were nevertheless able to generate microsatellite data for the Trebouxia photobiont based on the markers from Dal Grande et al. (Reference Dal Grande, Beck, Singh and Schmitt2013), but these data did not allow us to distinguish different species of Trebouxia. Other lichens might share algal strains with Xanthoria parietina in the area of Munich. Trebouxia decolorans has been reported as a photobiont of various other lichen species or genera, including Anaptychia ciliaris (L.) Körb. ex A. Massal. (Dal Grande et al. Reference Dal Grande, Alors, Divakar, Bálint, Crespo and Schmitt2014a), Punctelia subrudecta (L.) Körb. ex A. Massal., Lecanora (Blaha et al. Reference Blaha, Baloch and Grube2006) and Xanthomendoza (Nyati et al. Reference Nyati, Scherrer, Werth and Honegger2014), and of species of Candelaria, Ramalina and Xanthoria (Werth Reference Werth2012; Dal Grande et al. Reference Dal Grande, Alors, Divakar, Bálint, Crespo and Schmitt2014a). Candelaria concolor Arnold frequently co-occurs with Xanthoria parietina in the Munich area (Sebald et al. Reference Sebald, Goss, Ramm, Gerasimova and Werth2022) and it is conceivable that these species might share algal strains, but further investigations need to confirm this hypothesis.
Other investigations have found multiple genotypes of the photobiont within thalli of X. parietina (Dal Grande et al. Reference Dal Grande, Alors, Divakar, Bálint, Crespo and Schmitt2014a) and there have been similar reports for Parmotrema tinctorum (Despr. ex Nyl.) Hale (Mansournia et al. Reference Mansournia, Wu, Matsushita and Hogetsu2011). Our study was not designed to investigate intrathalline genetic variability in X. parietina since we investigated only small marginal pieces of our specimens and these were found to be genetically homogeneous, both for the mycobionts and the photobionts. Molins et al. (Reference Molins, Moya, Muggia and Barreno2021) recently reported that photobiont diversity depended on thallus growth stage in Ramalina farinacea (L.) Ach., with young thalli containing multiple photobionts and larger thalli typically containing only one. Moreover, basal parts of the lichen tended to contain more photobiont types than apical parts. Since in our study we sampled small marginal pieces of rather large thalli, this sampling strategy might have caused us to find a single genotype in each sample, but the focus of our study was not on intrathalline photobiont or mycobiont diversity.
Many studies have investigated the pollution sensitivity of lichens and lichen communities (e.g. Hawksworth & Rose Reference Hawksworth and Rose1970; Richardson Reference Richardson1992; Garty et al. Reference Garty, Karary and Harel1993; Geiser & Neitlich Reference Geiser and Neitlich2007). A large portion of lichen biota in Central Europe have declined tremendously over the last 150 years and air pollution has been identified as one of the key factors causing this dramatic loss of diversity (Hauck et al. Reference Hauck, de Bruyn and Leuschner2013). However, few studies have investigated how air pollution affects the genetic diversity of lichens. Populations of Usnea subfloridana had lower genetic diversity in polluted than in unpolluted sites (Degtjarenko et al. Reference Degtjarenko, Marmor, Tõrra, Lerch, Saag, Randlane and Scheidegger2016b). We did not find a significant relationship between genetic diversity of the mycobiont or photobiont and NO2 pollution levels in our study sites but this might partly be an effect of the relatively small number of populations. Future studies of more sites are needed to conclusively test for a relationship. However, of all studied locations, an unpolluted, remote site in Allgäu had the highest photobiont gene diversity. The effects of nitrogen pollution are dosage dependent, and in high dosage treatments, even the nitrophilic species X. parietina suffered, with several treatments eventually causing mortality (Munzi et al. Reference Munzi, Pisani, Paoli and Loppi2010). In polluted urban sites, there is accumulating evidence that nitrogen pollution levels are influencing the lichen symbioses. In lichen cells, NOx leads to the production of nitrate (NO3−) and toxic nitrite (NO2−) accumulates. The NO3− may endanger the symbiotic balance by providing a nutrient for growth of the algal partner with the risk that it can grow faster than the mycobiont is able to control (Vorbeck & Windisch Reference Vorbeck and Windisch2001). The NO2 level at the remote Allgäu site was much lower than in the urban area of Munich, and it has not been disturbed as much by the fertilizing effect of NO2, so that a larger number of pollution-sensitive lichens are able to grow there.
Guilds of lichen fungi sharing photobionts via release from vegetative propagules have been reported for cyanobacterial lichens (Rikkinen et al. Reference Rikkinen, Oksanen and Lohtander2002) and for Symbiochloris green-algal lichens (Dal Grande et al. Reference Dal Grande, Beck, Cornejo, Singh, Cheenacharoen, Nelsen and Scheidegger2014b). Consequently, the local availability of algal strains may depend on how many symbiotic propagules are deposited at a given site by other lichens with a compatible photobiont species. This, in turn, would depend on the species diversity and abundance in a given site. The Trebouxia arboricola–T. decolorans species complex includes some very common lichen photobionts (Dal Grande et al. Reference Dal Grande, Alors, Divakar, Bálint, Crespo and Schmitt2014a; Leavitt et al. Reference Leavitt, Kraichak, Nelsen, Altermann, Divakar, Alors, Esslinger, Crespo and Lumbsch2015), associating with many ecologically different lichenized fungi, for example with Ramalina menziesii found in foggy climates of coastal western North America (Werth & Sork Reference Werth and Sork2010, Reference Werth and Sork2014; Werth Reference Werth2012), with Caloplaca species in the Atacama Desert in Chile (Vargas Castillo & Beck Reference Vargas Castillo and Beck2012), or with Tephromela atra (Huds.) Hafellner in high elevation habitats of European mountain regions (Muggia et al. Reference Muggia, Zellnig, Rabensteiner and Grube2010). The Trebouxia arboricola–T. decolorans species complex is also found in some lichens which produce symbiotic propagules. The photobiont could therefore be dispersed with the soredia/isidia of other lichen species, followed by uptake by germinating X. parietina spores. Very little is known about the initial stages of lichen establishment but sharing of the same photobiont pool has been reported for other lichen communities (Beck et al. Reference Beck, Kasalicky and Rambold2002; Werth Reference Werth2012). In X. parietina, growing sporelings are apparently able to initially associate with suboptimal Pseudotrebouxia algae, which are later replaced by the compatible partner (Ott Reference Ott1987).
The high genetic diversity of Trebouxia photobionts associating with X. parietina in Allgäu may reflect the presence of a diverse local community of lichens that share the same Trebouxia photobionts. Ongoing studies have found a very high diversity of epiphytic lichens in the Hinterstein valley (I. Buschmann, S. Dehos, T. Karlowski & S. Werth, unpublished data; S. Werth, personal observation). The higher genetic diversity of the photobionts at Allgäu could also be a consequence of there being more algal strains available in unpolluted sites. In contrast, we found very low genetic diversity in the mycobiont of X. parietina in the unpolluted, remote site in Allgäu. This may reflect a relatively small local population size, which is confirmed by our field observations.
One interesting question is whether inner city areas which used to be lichen deserts because of high air pollution are recolonized by one specific gene pool or genotype, or from multiple sources. The recolonization of a formerly heavily polluted city in Germany by the lichen Usnea filipendula Stirt. (U. dasopoga (Ach.) Nyl.) occurred from different source populations, and individuals were not genetically closely related (Heibel et al. Reference Heibel, Lumbsch and Schmitt1999). The city of Munich was never a complete lichen desert but nitrophilic species such as X. parietina were largely restricted to the most basic, eutrophicated substrata until a few decades ago and they have since increased dramatically in local population size (S. Werth, personal observation). Given the admixture found in our data, it seems plausible that the population in the urban area of Munich originates from individuals with different genetic backgrounds after the area became suitable for mass colonization by X. parietina thanks to decreased SO2 air pollution levels. Our data on X. parietina show that urban areas can host substantial genetic diversity in the symbiotic partners of nitrophilic lichens.
Acknowledgements
The authors thank Tanja Ernst for support with the wet-lab work, including DNA isolations, PCR and sample preparation for fragment analyses. We thank Gisela Brinkmann and Andreas Brachmann for running fragment analyses for our samples on an automated capillary DNA sequencer. A collecting permit was obtained from Regierung Schwaben to collect lichen samples in the protected area ‘Naturschutzgebiet Allgäuer Hochalpen’. This work was supported by resources from the US Department of Energy Joint Genome Institute, a DOE Office of Science User Facility, which is supported by the Office of Science of the US Department of Energy under Contract No. DE-AC02-05CH11231. The laboratory of Silke Werth was supported by LMU start-up funds.
Author ORCIDs
Silke Werth, 0000-0002-4981-7850; Paul Dyer, 0000-0003-0237-026X.
CRediT Author Statement
Conceptualization: SW. Methodology: SW. Formal analysis: KW, MW, SW. Investigation: KW, MW. Resources: PSD. Writing (original draft): SW. Writing (review and editing): KW, MW, PSD, SW. Visualization: KW, MW, SW. Supervision: SW.
Supplementary Material
To view Supplementary Material for this article, please visit https://doi.org/10.1017/S002428292300004X.


 Open access
.svg)