

One of the most important changes that has occurred in the practice of critical care over the past 5 years has been the introduction of ‘tight’ glycaemic control for patients in the intensive care unit; i.e. keeping blood glucose between 4·1 and 6·4 mmol/l (Van Den Berghe et al. Reference Van Den Berghe, Wouters, Weekers, Verwaest, Bruyninckx, Schetz, Vlasselaers, Ferdinande, Lauwers and Bouillon2001, Reference Van den Berghe, Wilmer, Hermans, Meersseman, Wouters, Milants, Van Wijngaerden, Bobbaers and Bouillon2006; Krinsley, Reference Krinsley2004) to improve outcome. Tight glycaemic control is part of the ‘Surviving Sepsis’ campaign targets (Dellinger et al. Reference Dellinger, Carlet, Masur, Gerlach, Calandra and Cohen2004) and has been adopted as a marker of quality delivery in critical care. The present paper will review the evidence that being hyperglycaemic is bad for critically ill patients, and that glucose control might be good. The problems and pitfalls standing in the way of implementing a strategy for tight glycaemic control in critical care will also be discussed, and a description will be given of how it has been implemented at the Royal Liverpool University Hospital intensive care unit.
Why do critically-ill patients become hyperglycaemic?
Hyperglycaemia (i.e. blood glucose levels >6·4 mmol/l) occurs in as many as 75% of critically-ill patients (Van Den Berghe et al. Reference Van Den Berghe, Wouters, Weekers, Verwaest, Bruyninckx, Schetz, Vlasselaers, Ferdinande, Lauwers and Bouillon2001; Marik & Raghaven, Reference Marik, Raghaven, Pinsky, Brochard and Mancebo2006). Teleologically, this hyperglycaemia might be thought of as a response to the need to provide a ready energy source for the ‘fight or flight’ reaction that characterises the physiological response to stress.
There are multiple causes of stress hyperglycaemia (Marik & Raghaven, Reference Marik, Raghaven, Pinsky, Brochard and Mancebo2006; Turina et al. Reference Turina, Christ-Crain and Polk2006). Catecholamines, glucocorticoids and glucagon, which are released as part of the stress response, lead to a hypercatabolic state, increasing glucose levels by increasing glycolysis, glycogenolysis and lipolysis peripherally, and gluconeogenesis and glycogenolysis in the liver. Exogenous glucose is administered both parenterally and enterally. Even bed rest alone leads to increased glucose levels, because of impaired uptake in skeletal muscle (Turina et al. Reference Turina, Christ-Crain and Polk2006). At the same time as glucose levels are elevated there is relative insulin deficiency, and inflammatory cytokines such as TNFα and IL-6 induce insulin resistance by interfering with insulin receptors (Marik & Raghaven, Reference Marik, Raghaven, Pinsky, Brochard and Mancebo2006).
Is hyperglycaemia bad for patients in the intensive care unit?
It is well known that patients with diabetes suffer increased incidence of infection and poor wound healing and are at risk of developing diabetic ketoacidosis. Age-adjusted mortality is twice that of patients without diabetes (Turina et al. Reference Turina, Christ-Crain and Polk2006).
Patients who are not diabetic but who present during acute illness with raised blood sugar have a poorer prognosis than patients who are normoglycaemic. This outcome has been observed in patients with myocardial infarction (Capes et al. Reference Capes, Hunt, Malmberg and Gerstein2000), heart failure (Barsheshet et al. Reference Barsheshet, Garty, Grossman, Sandach, Lewis and Gottlieb2006), acute cerebrovascular accident (Capes et al. Reference Capes, Hunt, Malmberg, Pathak and Gerstein2001) and patients with severe traumatic head injury (Jeremitsky et al. Reference Jeremitsky, Olmert, Dunham, Wilberger and Rodriguez2005). Krinsley (Reference Krinsley2003) has retrospectively reviewed 1826 patients in the intensive care unit, finding that mortality increases progressively as glucose increases, even when matched for APACHE severity of illness scoring (see Knaus et al. Reference Knaus, Draper, Wagner and Zimmerman1985).
Is glucose control good for you?
Van Den Berghe et al. (Reference Van Den Berghe, Wouters, Weekers, Verwaest, Bruyninckx, Schetz, Vlasselaers, Ferdinande, Lauwers and Bouillon2001) have published a hallmark study showing that tight glucose control (4·1–6·4 mmol/l) in a group of critically-ill patients who have undergone surgery reduces mortality by 34%, decreases the incidence of bloodstream infections by 46% and decreases intensive care unit length of stay and the incidence of critical illness myoneuropathy. Although this study was criticised on several counts (e.g. it was a single-centre study and the subjects were mostly patients who had undergone cardiac surgery), it was well conducted and had compelling conclusions. Tight glycaemic control was adopted relatively rapidly by the critical care community and incorporated into guidelines for the ‘Surviving Sepsis’ campaign (Dellinger et al. Reference Dellinger, Carlet, Masur, Gerlach, Calandra and Cohen2004). Other studies have followed. Krinsley (Reference Krinsley2004) has shown similarly encouraging results in a mixed group of patients admitted to the intensive care unit with a wide variety of medical and surgical diagnoses, and Pittas et al. (Reference Pittas, Siegel and Lau2004) have published a meta-analysis of thirty-five trials that suggests an overall decrease in mortality of 15% with glycaemic control (relative risk 0·85 (95% CI 0·75, 0·97)).
Van den Berghe et al. (Reference Van den Berghe, Wilmer, Hermans, Meersseman, Wouters, Milants, Van Wijngaerden, Bobbaers and Bouillon2006) have repeated the original trial with patients admitted to the intensive care unit with medical diagnoses. This trial failed to demonstrate a mortality benefit for this group of patients, except for a post hoc analysis of patients staying longer than 3 d in intensive care. Overall, however, morbidity in all patients was found to be decreased, with the added benefit of cost savings associated with decreased lengths of time on mechanical ventilation and length of stay in intensive care, and decreased need for renal support.
Why would glucose control be beneficial?
Controlling glucose in patients with diabetes has beneficial effects on wound healing and infective complications. However, the mechanisms for the beneficial effects of glucose control are not entirely clear. Is it giving insulin or controlling glucose that is more important? It appears that beneficial effects are related to the actual level of glucose rather than the administration of insulin (Van den Berghe et al. Reference Van den Berghe, Wouters, Bouillon, Weekers, Verwaest, Schetz, Vlasselaers, Ferdinande and Lauwers2003); in fact, the administration of insulin has been shown by Finney et al. (Reference Finney, Zekveld, Elia and Evans2003) and by Van den Berghe et al. (Reference Van den Berghe, Wilmer, Hermans, Meersseman, Wouters, Milants, Van Wijngaerden, Bobbaers and Bouillon2006) to be independently positively correlated with mortality.
Should tight glycaemic control be practised in patients in the intensive care unit: is it safe?
The problem with instituting tight glucose control in intensive care units is that it exposes patients to the risk of profound hypoglycaemia. Critically-ill patients are not able to feel or communicate signs and symptoms of hypoglycaemia, because they are usually unconscious or sedated. Insulin in this context becomes a potentially-dangerous drug. In fact, the Efficacy of Volume Substitution and Insulin Therapy in Severe Sepsis Trial in Europe (Brunkhorst et al. Reference Brunkhorst, Kuhnt, Engel, Meier Hellmann, Ragaller and Quintel2005) was stopped early because of an unacceptable incidence of hypoglycaemia (16%). In a review concluding that there were advantages to tight glycaemic control Pittas et al. (Reference Pittas, Siegel and Lau2004) have reported a relative risk of hypoglycaemia of 3·4 (95% CI 1·9, 6·3).
It is, therefore, essential to ensure that monitoring techniques, devices and frequency are all sufficient to ensure that patients do not become hypoglycaemic. In addition, it is essential to ensure that all staff are aware of the potential dangers and of procedures to prevent problems. A straightforward simple-to-use guideline is key to successful implementation of tight glycaemic control, as is frequent monitoring of blood glucose, especially when the patient is unstable.
A description will now be given of how glycaemic control is practised in the Royal Liverpool University Hospital unit.
How is it done: context
The Royal Liverpool University Hospital is a 1200-bed inner-city teaching hospital with renal, pancreas, gastroenterology and other specialist services. It has a thirteen-bed intensive care unit that admits between 450 and 550 patients per year (55% with surgical diagnoses and 45% with medical diagnoses). There are few elective surgical admissions because the hospital has a post-operative intensive care unit for short-term post-operative patients in which tight glycaemic control is not practised.
How to do it: providing energy
In the original study of Van den Berghe et al. (Reference Van Den Berghe, Wouters, Weekers, Verwaest, Bruyninckx, Schetz, Vlasselaers, Ferdinande, Lauwers and Bouillon2001) patients received 4200 kJ (1000 kcal)/24 h before starting insulin infusion. It is essential to provide energy before giving insulin. Normally, the enteral route is preferred, because enteral feeding preserves gut architecture (Khan et al. Reference Khan, Vasquez, Gray, Wians and Kroll2006) and improves immunological function compared with the parenteral route, and because the parenteral route is associated with an increased incidence of hyperglycaemia. However, it may not be appropriate to provide enteral feeding to some patients who have undergone surgery, especially if there is risk of ischaemic gut or if the gut is not working; in the latter case, it is better to start parenteral nutrition than no nutrition at all.
A nasogastric tube is placed and its position confirmed, usually with a chest X-ray. The length of tube is measured at the nostril and the length recorded daily to ensure a stable position. Although the National Patient Safety Agency (2005) has recommended stopping enteral feed for 4 h/d and ensuring that the pH of gastric aspirate is <5·5 before recommencing, this practice is impractical for this population, as interrupting feeding increases the risk of hypoglycaemia, and drugs such as H2 antagonists and proton pump inhibitors raise the pH of gastric aspirate. The National Patient Safety Agency is currently reconsidering their guidance for critically ill patients.
Initially, a feed containing 6·27 kJ (1·5 kcal)/ml is provided through the nasogastric tube at 30 ml/h, increasing to approximately 65 ml/h if gastric aspirates are minimal after 4 h; this regimen provides 8400 kJ (2000 kcal)/d. If aspirates are large, metoclopramide 10 mg three times daily and erythromycin 125 mg three times daily are used to encourage gut motility. Continuous 24 h feeding is used because it makes glucose control easier. However, if gastric feeding is not tolerated despite prokinetic therapy an attempt will be made to place a nasojejeunal tube, either a self-propelling device or one placed endoscopically by a gastroenterologist.
Insulin
Initially, an adaptation of the insulin-infusion protocol used by van den Berghe et al. (Reference Van Den Berghe, Wouters, Weekers, Verwaest, Bruyninckx, Schetz, Vlasselaers, Ferdinande, Lauwers and Bouillon2001) was attempted, but it was found to be too complex and patients were becoming hypoglycaemic too frequently. The insulin-infusion protocol that is currently used is simple and adjustable by nursing staff (see Table 1). The aim is to keep glucose levels between 4 and 8 mmol/l; i.e. not as tight control as that described by Van den Berghe et al. (Reference Van Den Berghe, Wouters, Weekers, Verwaest, Bruyninckx, Schetz, Vlasselaers, Ferdinande, Lauwers and Bouillon2001), but in line with current recommendations (Meijering et al. Reference Meijering, Corstjens, Tulleken, Meertens, Zijlstra and Ligtenberg2006).
Insulin-infusion regimen in place at the Royal Liverpool University Hospital, Liverpool, UK
On admission, measure blood glucose and start an infusion of insulin as indicated, ensuring that the patient is receiving energy (⩽4200 kJ (1000 kcal)/d) either enterally or parenterally:

Measure blood glucose at 1 h (more frequently if changing rapidly) and adjust insulin as indicated:
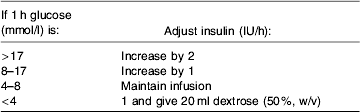
Measure again in 1 h and hourly until stable (four readings in range), then two-hourly until stable (four readings in range), then four-hourly; if the blood glucose is still high and falling gradually adjust as indicated:

Measure again and adjust the dose. If glucose is falling rapidly (>50% fall), decrease insulin by half.
Van den Berghe et al. (Reference Van den Berghe, Wouters, Bouillon, Weekers, Verwaest, Schetz, Vlasselaers, Ferdinande and Lauwers2003) have reported that the mean dose of insulin required is 77 IU/d during the first week of illness (mean 7 IU/h during the first 6 h, with 10% of patients requiring >20 IU/h). Requirements decrease sharply after the first week. In fact, at the Royal Liverpool University Hospital it has been found that in many patients insulin can be stopped completely on their return to the ward. The insulin-infusion regimen in the intensive care unit is never used on general wards because of the danger of unrecognised hypoglycaemia.
Glucose measurement
Frequent measurement of blood glucose is of paramount importance to ensure safety. The clinical staff are concerned, and they encourage their staff to be concerned, about hypoglycaemia, and they must be aware that: patients may stop absorbing feed; patients on dialysis may become hypoglycaemic (because glucose is dialysed out and insulin is not); concurrent medications (e.g. steroids) or the presence of new infection may interfere with glucose levels. Glucose levels are measured hourly initially until there are at least two stable readings between 4 and 8·3 mmol/l, then measured two-hourly until readings are stable, then four-hourly. Glucose levels are plotted on a chart that is on the reverse of the physiological measurement chart, so that staff have a visual prompt about glucose levels (Fig. 1). The target thresholds for upper and lower limits of glucose are clearly indicated on the chart, which makes it immediately obvious if glucose levels are falling rapidly or rising rapidly, so that adjustments can be made to the insulin infusion. If levels are falling or rising rapidly, or if the glucose test result does not make sense (e.g. the glucose is rising despite increased insulin infusion rate), a specimen of blood is sent to the laboratory for cross checking.
An example of a glucose–insulin chart that is in use, which follows the insulin-infusion regimen in place at the Royal Liverpool University Hospital, Liverpool, UK (see Table 1). The target thresholds for upper and lower limits of blood glucose are 8 and 4 mmol/l respectively. *Nursing staff indicate the change they make to the insulin infusion as a result of the glucose level obtained.

Reliance on glucometers for point-of-care testing (Khan et al. Reference Khan, Vasquez, Gray, Wians and Kroll2006) is becoming less frequent. These devices were not intended for critical care use, but for patients in the community who use capillary blood and are able to express signs and symptoms of hypoglycaemia. They need calibration and the test sticks used in them must be handled carefully as they may deteriorate on exposure to O2. Certain substances and drugs interfere with measurement; for example, peritoneal dialysis solutions may falsely elevate glucometer-measured levels. Also, when patients have poor peripheral circulation, skin-prick measurements may not reflect the core glucose level. The glucose measurement obtained from an arterial blood sample analysed on the unit's blood-gas machine is relied on unless patients do not have an arterial line.
Implementing guidelines
Successful implementation of tight glycaemic control relies on enthusiasts in the intensive care unit to drive the process forward. Education of staff in the benefits as well as the perils is essential. Making the process simple and making ‘the right thing to do is the easy thing to do’ is essential for both safety and efficacy. Measurements must be made frequently, and triggers must be in place so that insulin infusions can be adjusted by nursing staff if blood glucose levels are rising or falling faster than expected. Regular audit of results and feeding back to staff is also important.
In the author's experience the actual insulin-infusion regimen used is not the most important part of the process. Successful implementation of glycaemic control depends on the ‘package’ of feeding, thinking about what should be achieved, measuring frequently and reacting to the results. Fig. 2 shows the results of an audit of blood glucose control before and after implementing tight glycaemic control.
Results of an audit of blood glucose levels before ( ) and after () the introduction of real-time charting by means of the glucose–insulin chart currently used at the Royal Liverpool University Hospital, Liverpool, UK, an example of which shown in Fig. 1.

Conclusion
Although there are controversies associated with the use of tight glycaemic control in the critical care environment, it has been widely adopted and has been used as a proxy indicator of the quality of care delivered in critical care. To do it safely requires enthusiasm and meticulous attention to detail.



