

1 Introduction
Ongoing advances in high-power laser technology[Reference Danson, Hillier, Hopps and Neely1] have led to renewed interest in the processes that drive electromagnetic pulse (EMP) generation. Control over the strength and frequency of emission is not just essential for the protection of expensive hardware – it could open the door to a new generation of bespoke laser-driven B-field and radio-frequency sources of interest to the inertial confinement fusion, high-field and astrophysical communities[Reference Poyé, Hulin, Bailly-Grandvaux, Ribolzi, Raffestin, Bardon, Lubrano-Lavaderci, Santos, Nicolaï and Tikhonchuk2–Reference De Marco, Krása, Cikhardt, Velyhan, Pfeifer, Dudžák, Dostál, Krouský, Limpouch, Pisarczyk, Kalinowska, Chodukowski, Ullschmied, Giuffrida, Chatain, Perin and Margarone4].
A number of different mechanisms have been proposed to explain the broad spectral profile of laser-driven EMP and they all rely upon the acceleration of hot electrons within the target. When a sufficiently intense laser pulse ( $I\unicode[STIX]{x1D706}^{2}\gtrsim 10^{15}~\text{W}\cdot \text{cm}^{-2}\cdot \unicode[STIX]{x03BC}\text{m}^{2}$
) interacts with a material, a portion of its energy is resonantly and parametrically absorbed, leading to the production of hot electrons with energies exceeding 10 keV[Reference Courtois, Ash, Chambers, Grundy and Woolsey5]. At still higher intensity, other processes (e.g.
$I\unicode[STIX]{x1D706}^{2}\gtrsim 10^{15}~\text{W}\cdot \text{cm}^{-2}\cdot \unicode[STIX]{x03BC}\text{m}^{2}$
) interacts with a material, a portion of its energy is resonantly and parametrically absorbed, leading to the production of hot electrons with energies exceeding 10 keV[Reference Courtois, Ash, Chambers, Grundy and Woolsey5]. At still higher intensity, other processes (e.g. $\boldsymbol{J}\times \boldsymbol{B}$
heating) can accelerate electrons to MeV energies[Reference Gibbon6]. It is thought that these electrons contribute towards the EMP in three key stages, starting with the emission of THz radiation as they propagate across the target surface[Reference Liao, Li, Zhang, Liu, Ge, Yang, Wei, Yuan, Deng, Zhu, Zhang, Wang, Sheng, Chen, Lu, Ma, Wang and Zhang7]. Although significant currents may be associated with this THz emission, the frequency is generally too high to pose a threat to electronic equipment[Reference Poyé, Dubois, Lubrano-Lavaderci, D’Humières, Bardon, Hulin, Bailly-Grandvaux, Ribolzi, Raffestin, Santos, Nicolaï and Tikhonchuk8]. The second contribution to the EMP is, by contrast, acutely damaging to circuitry and lies within the GHz spectral domain. It occurs when some of the most energetic hot electrons are ejected from the target[Reference Brown, Throop, Eder and Kimbrough9, Reference Dubois, Lubrano-Lavaderci, Raffestin, Ribolzi, Gazave, Compant La Fontaine, D’Humières, Hulin, Nicolaï, Poyé and Tikhonchuk10], leaving behind a potential that both prevents less energetic electrons from escaping and draws a return current out of the chamber surroundings. As this current oscillates across the stalk that connects the target to the chamber, antenna radiation is emitted at radio frequencies[Reference Poyé, Hulin, Bailly-Grandvaux, Ribolzi, Raffestin, Bardon, Lubrano-Lavaderci, Santos, Nicolaï and Tikhonchuk2]. The third spectral component is in the MHz domain and depends on the geometry of the interaction chamber. An expanding cloud of charge is produced by the evaporating target, which strikes the walls of the chamber and causes it to resonate at its natural EM frequency[Reference Mead, Neely, Gauoin, Heathcote and Patel11]. EMP emission is strongest at high laser energy, when more escaping electrons can be produced.
$\boldsymbol{J}\times \boldsymbol{B}$
heating) can accelerate electrons to MeV energies[Reference Gibbon6]. It is thought that these electrons contribute towards the EMP in three key stages, starting with the emission of THz radiation as they propagate across the target surface[Reference Liao, Li, Zhang, Liu, Ge, Yang, Wei, Yuan, Deng, Zhu, Zhang, Wang, Sheng, Chen, Lu, Ma, Wang and Zhang7]. Although significant currents may be associated with this THz emission, the frequency is generally too high to pose a threat to electronic equipment[Reference Poyé, Dubois, Lubrano-Lavaderci, D’Humières, Bardon, Hulin, Bailly-Grandvaux, Ribolzi, Raffestin, Santos, Nicolaï and Tikhonchuk8]. The second contribution to the EMP is, by contrast, acutely damaging to circuitry and lies within the GHz spectral domain. It occurs when some of the most energetic hot electrons are ejected from the target[Reference Brown, Throop, Eder and Kimbrough9, Reference Dubois, Lubrano-Lavaderci, Raffestin, Ribolzi, Gazave, Compant La Fontaine, D’Humières, Hulin, Nicolaï, Poyé and Tikhonchuk10], leaving behind a potential that both prevents less energetic electrons from escaping and draws a return current out of the chamber surroundings. As this current oscillates across the stalk that connects the target to the chamber, antenna radiation is emitted at radio frequencies[Reference Poyé, Hulin, Bailly-Grandvaux, Ribolzi, Raffestin, Bardon, Lubrano-Lavaderci, Santos, Nicolaï and Tikhonchuk2]. The third spectral component is in the MHz domain and depends on the geometry of the interaction chamber. An expanding cloud of charge is produced by the evaporating target, which strikes the walls of the chamber and causes it to resonate at its natural EM frequency[Reference Mead, Neely, Gauoin, Heathcote and Patel11]. EMP emission is strongest at high laser energy, when more escaping electrons can be produced.
Since the GHz component of the EMP is caused by a neutralization current propagating across the target stalk, by reducing the magnitude and duration of this current one may hope to limit the damaging effects of EMP. In this paper, we present new data that shows how a significant reduction in EMP can be achieved with minimal experimental disruption. Experimental results are divided into two main sections – one for EMP variation with laser parameters and the other for variation with target foil and stalk/mount characteristics. The data presented here is independent of target thickness, of which more details can be found in the Appendix (see Appendix A). All data used to produce the figures in this work, along with other supporting material, can be found at http://dx.doi.org/10.15124/a5d78c76-0546-412c-8b02-9edcb75efbb7.
2 Experimental setup
Our experiment was performed at the Vulcan Target Area West (TAW) laser facility on the site of the Rutherford Appleton Laboratory[Reference Edwards, Danson, Hutchinson, Neely and Wyborn12]. We used a short-pulse beamline with 1 ps pulse duration and energies ranging from 1 to 70 J. The incidence angle of the 1030 nm p-polarized beam was $30^{\circ }$
to the target normal. The focal spot size was fixed at 3.5
$30^{\circ }$
to the target normal. The focal spot size was fixed at 3.5 $\unicode[STIX]{x03BC}\text{m}$
, with a maximum laser focal intensity of
$\unicode[STIX]{x03BC}\text{m}$
, with a maximum laser focal intensity of $I=2\times 10^{19}~\text{W}\cdot \text{cm}^{-2}$
.
$I=2\times 10^{19}~\text{W}\cdot \text{cm}^{-2}$
.
Three probes were used to monitor the EMP during the experiment. A B-dot probe and a D-dot probe were placed behind a porthole on the East side of the chamber, $0^{\circ }$
vertically from Target Chamber Centre (TCC). A second B-dot probe was placed opposite, on the West side of the chamber, behind a porthole
$0^{\circ }$
vertically from Target Chamber Centre (TCC). A second B-dot probe was placed opposite, on the West side of the chamber, behind a porthole $35^{\circ }$
vertically from TCC. All three probes were exposed to the air.
$35^{\circ }$
vertically from TCC. All three probes were exposed to the air.
The B-dot probes were Prodyn B-24 detectors connected to a BIB-100G matching box, while the D-dot was an FD-5C model (also made by Prodyn Technologies). In an attempt to limit the amount of EMP noise pick-up, probe measurements were passed through 35-m double-shielded BNC cables to an oscilloscope situated outside of the target area. The oscilloscope was a Tektronix DPO 71254C model with a 12.5 GHz analog bandwidth, though cable parameters restricted measurements to frequencies below ${\sim}$
3 GHz.
${\sim}$
3 GHz.
Probe measurements were converted to EMP energy using the procedure outlined in 2012 by Kugland et al.
[Reference Kugland, Aurand, Brown, Constantin, Everson, Glenzer, Schaeffer, Tauschwitz and Niemann13] Ignoring frequencies above 3 GHz and below 50 MHz, we inverted the RG223 cable attenuation and integrated the corrected signal to yield $B(t)$
(or
$B(t)$
(or $D(t)$
in the case of the D-dot probe). Next, we used the free-space plane wave approximation (
$D(t)$
in the case of the D-dot probe). Next, we used the free-space plane wave approximation ( $\text{}\text{E}\approx c\text{}\text{B}$
) to estimate the instantaneous Poynting flux,
$\text{}\text{E}\approx c\text{}\text{B}$
) to estimate the instantaneous Poynting flux, $S(t)=|\text{}\text{E}\times \text{}\text{H}|$
. The EMP energy could then be calculated via[Reference Kugland, Aurand, Brown, Constantin, Everson, Glenzer, Schaeffer, Tauschwitz and Niemann13]
$S(t)=|\text{}\text{E}\times \text{}\text{H}|$
. The EMP energy could then be calculated via[Reference Kugland, Aurand, Brown, Constantin, Everson, Glenzer, Schaeffer, Tauschwitz and Niemann13]
 $$\begin{eqnarray}\unicode[STIX]{x1D716}_{\text{EMP}}=A_{eq}\sum S(t)\unicode[STIX]{x0394}t,\end{eqnarray}$$
where $A_{eq}$
is the probe equivalent area and
$A_{eq}$
is the probe equivalent area and $\unicode[STIX]{x1D716}_{\text{EMP}}$
is the EMP energy at the probe head.
$\unicode[STIX]{x1D716}_{\text{EMP}}$
is the EMP energy at the probe head.
The standard laser-target design consisted of a $3~\text{mm}\times 8~\text{mm}$
metal foil mounted on a 2.9 mm-diameter cylindrical stalk (see Figure 1). All of the stalks were 30 mm in height and positioned along the circumference of a rotating Al wheel. Stalks were composed either of Cu or an acrylic resin called VEROBLACKPLUS RGD875, which we refer to as CH for the remainder of the paper.
$3~\text{mm}\times 8~\text{mm}$
metal foil mounted on a 2.9 mm-diameter cylindrical stalk (see Figure 1). All of the stalks were 30 mm in height and positioned along the circumference of a rotating Al wheel. Stalks were composed either of Cu or an acrylic resin called VEROBLACKPLUS RGD875, which we refer to as CH for the remainder of the paper.
Schematic of target design and experimental arrangement.
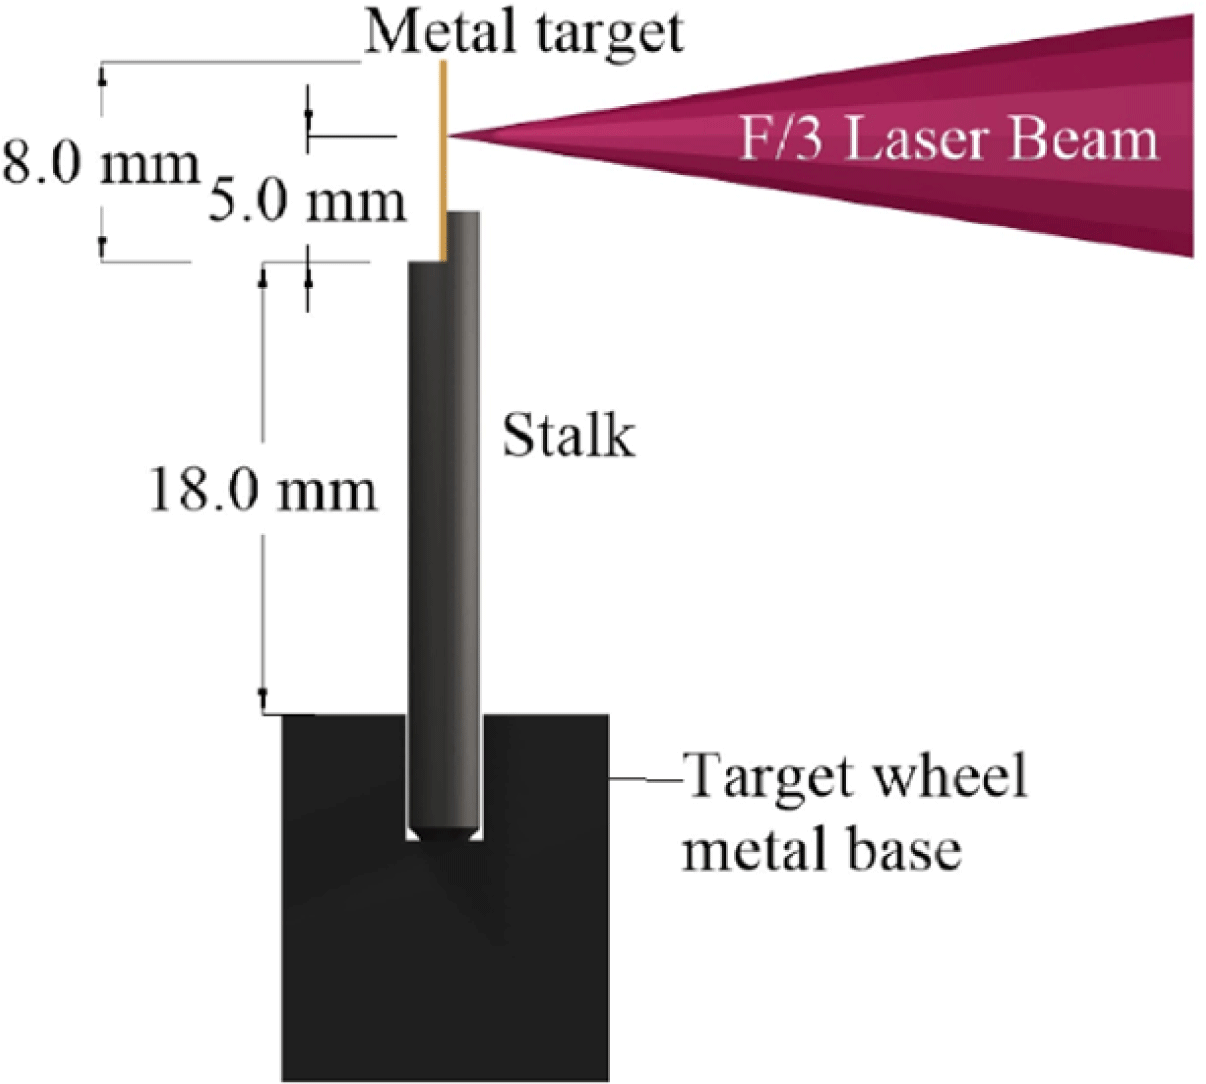
Escaping electrons produced during the interaction were detected using an electron spectrometer. It was positioned directly in line with the laser, facing the target rear surface.
3 Laser parameters
3.1 Laser energy
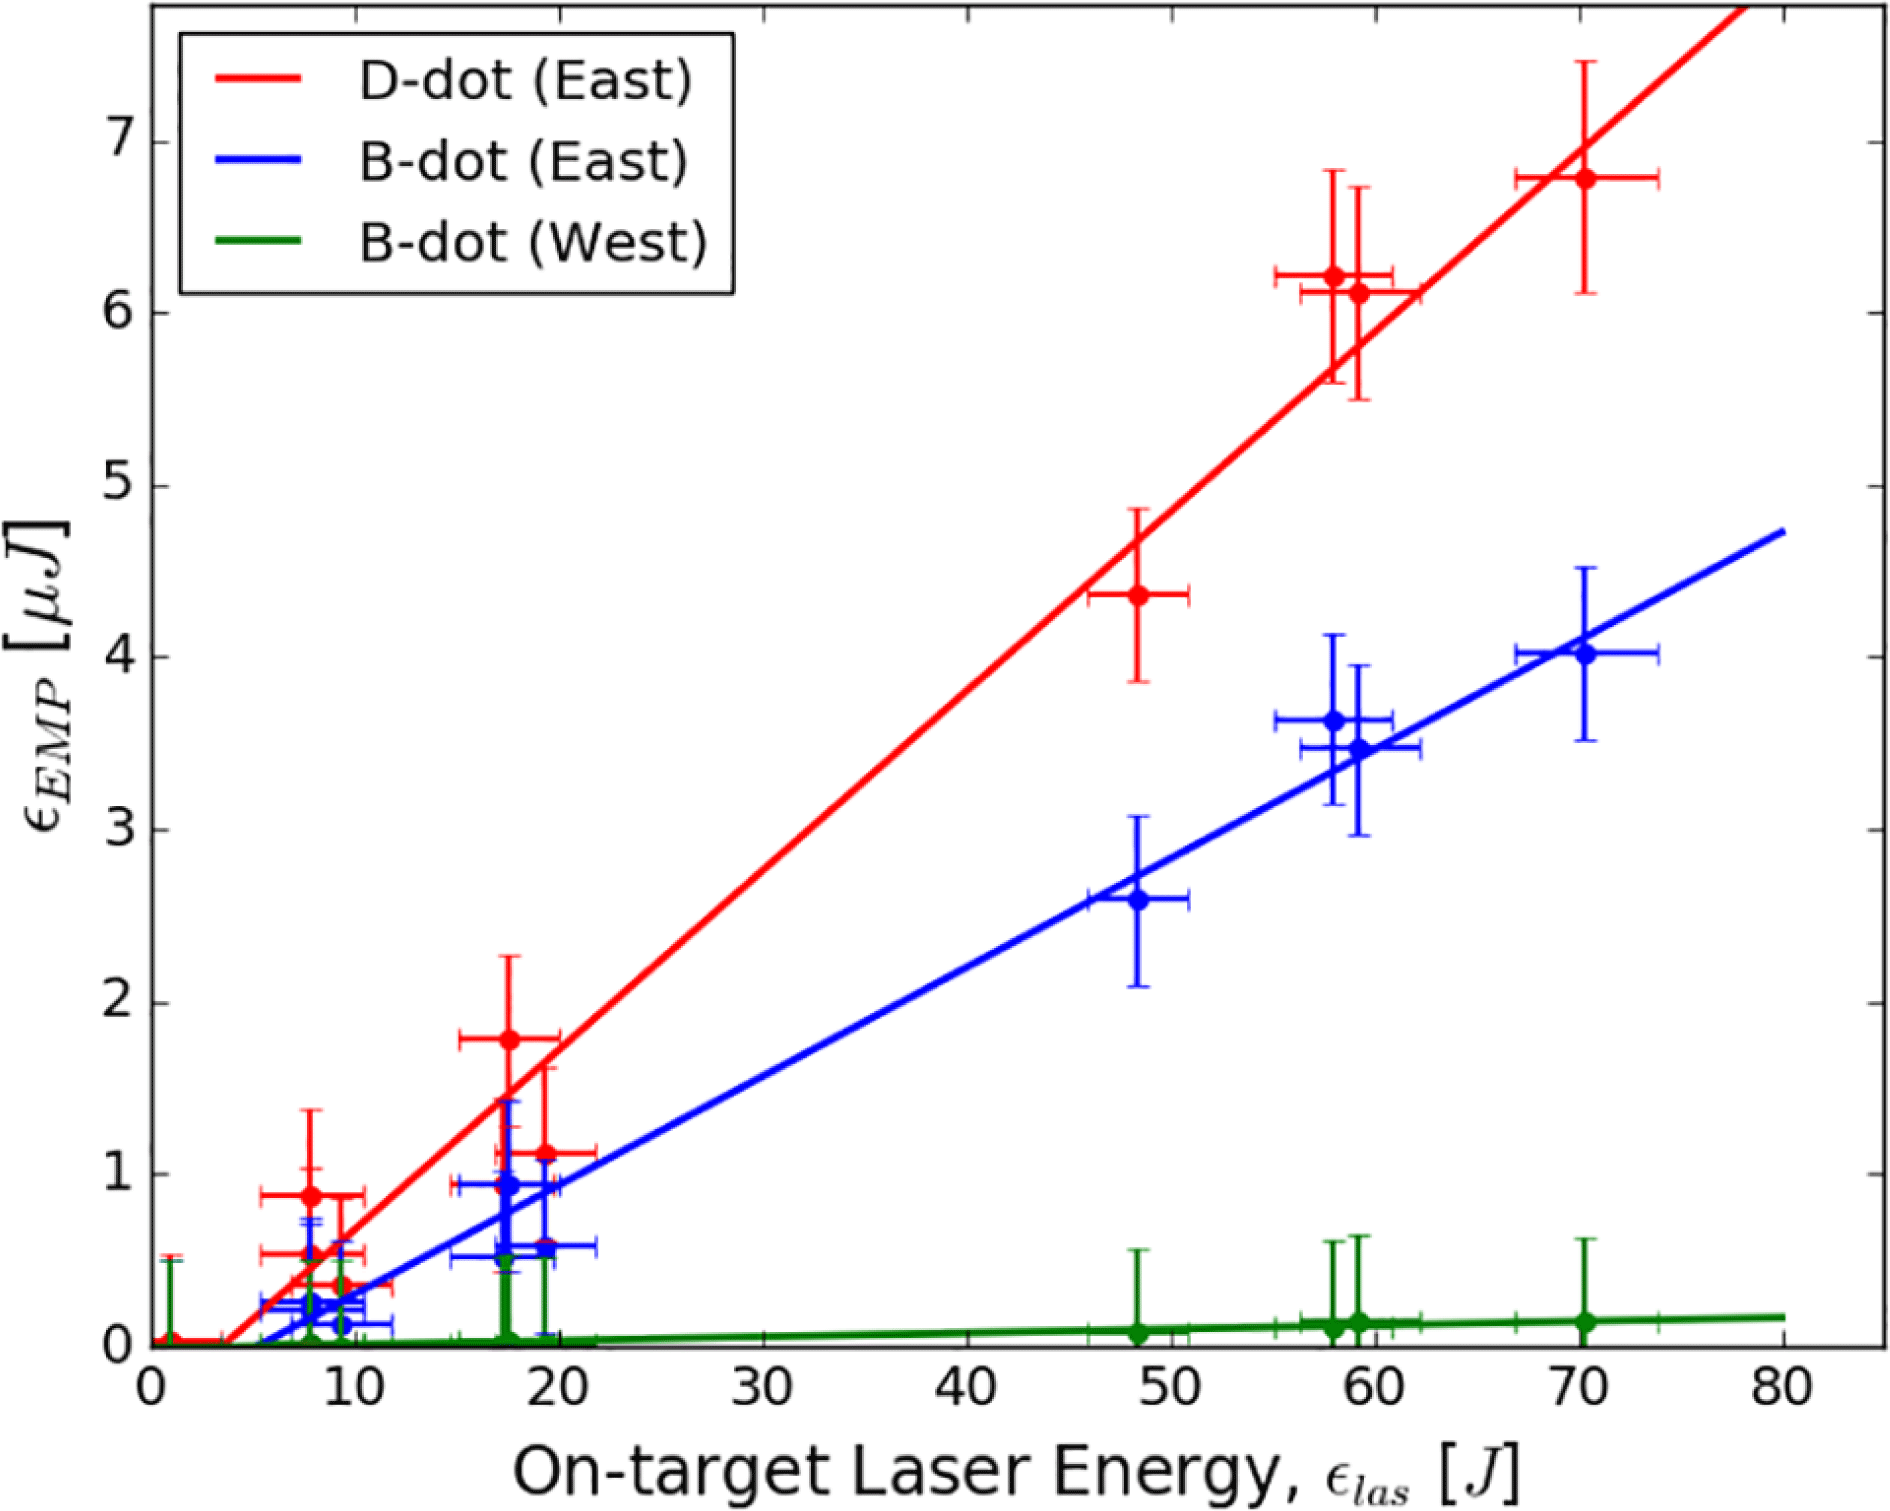
Initial measurements examined the relationship between laser energy and EMP. For this purpose, 1 ps laser pulses were fired at $100~\unicode[STIX]{x03BC}\text{m}$
-thick Cu targets (hereafter Cu100) on cylindrical CH stalks. In Figure 2, we show weighted linear fits for on-target laser energies between
$100~\unicode[STIX]{x03BC}\text{m}$
-thick Cu targets (hereafter Cu100) on cylindrical CH stalks. In Figure 2, we show weighted linear fits for on-target laser energies between ${\sim}1$
and 70 J (
${\sim}1$
and 70 J ( $I=1\times 10^{17}{-}10^{19}~\text{W}\cdot \text{cm}^{-2}$
). Linearity is observed across all three diagnostics for laser energies exceeding
$I=1\times 10^{17}{-}10^{19}~\text{W}\cdot \text{cm}^{-2}$
). Linearity is observed across all three diagnostics for laser energies exceeding ${\sim}7~\text{J}$
, which suggests that EMP measurements may be a reliable measure of laser-target coupling for a given target geometry.
${\sim}7~\text{J}$
, which suggests that EMP measurements may be a reliable measure of laser-target coupling for a given target geometry.
EMP energy versus on-target laser energy for the D-dot and two B-dot probes. The coloured lines represent linear fits for all three probes.
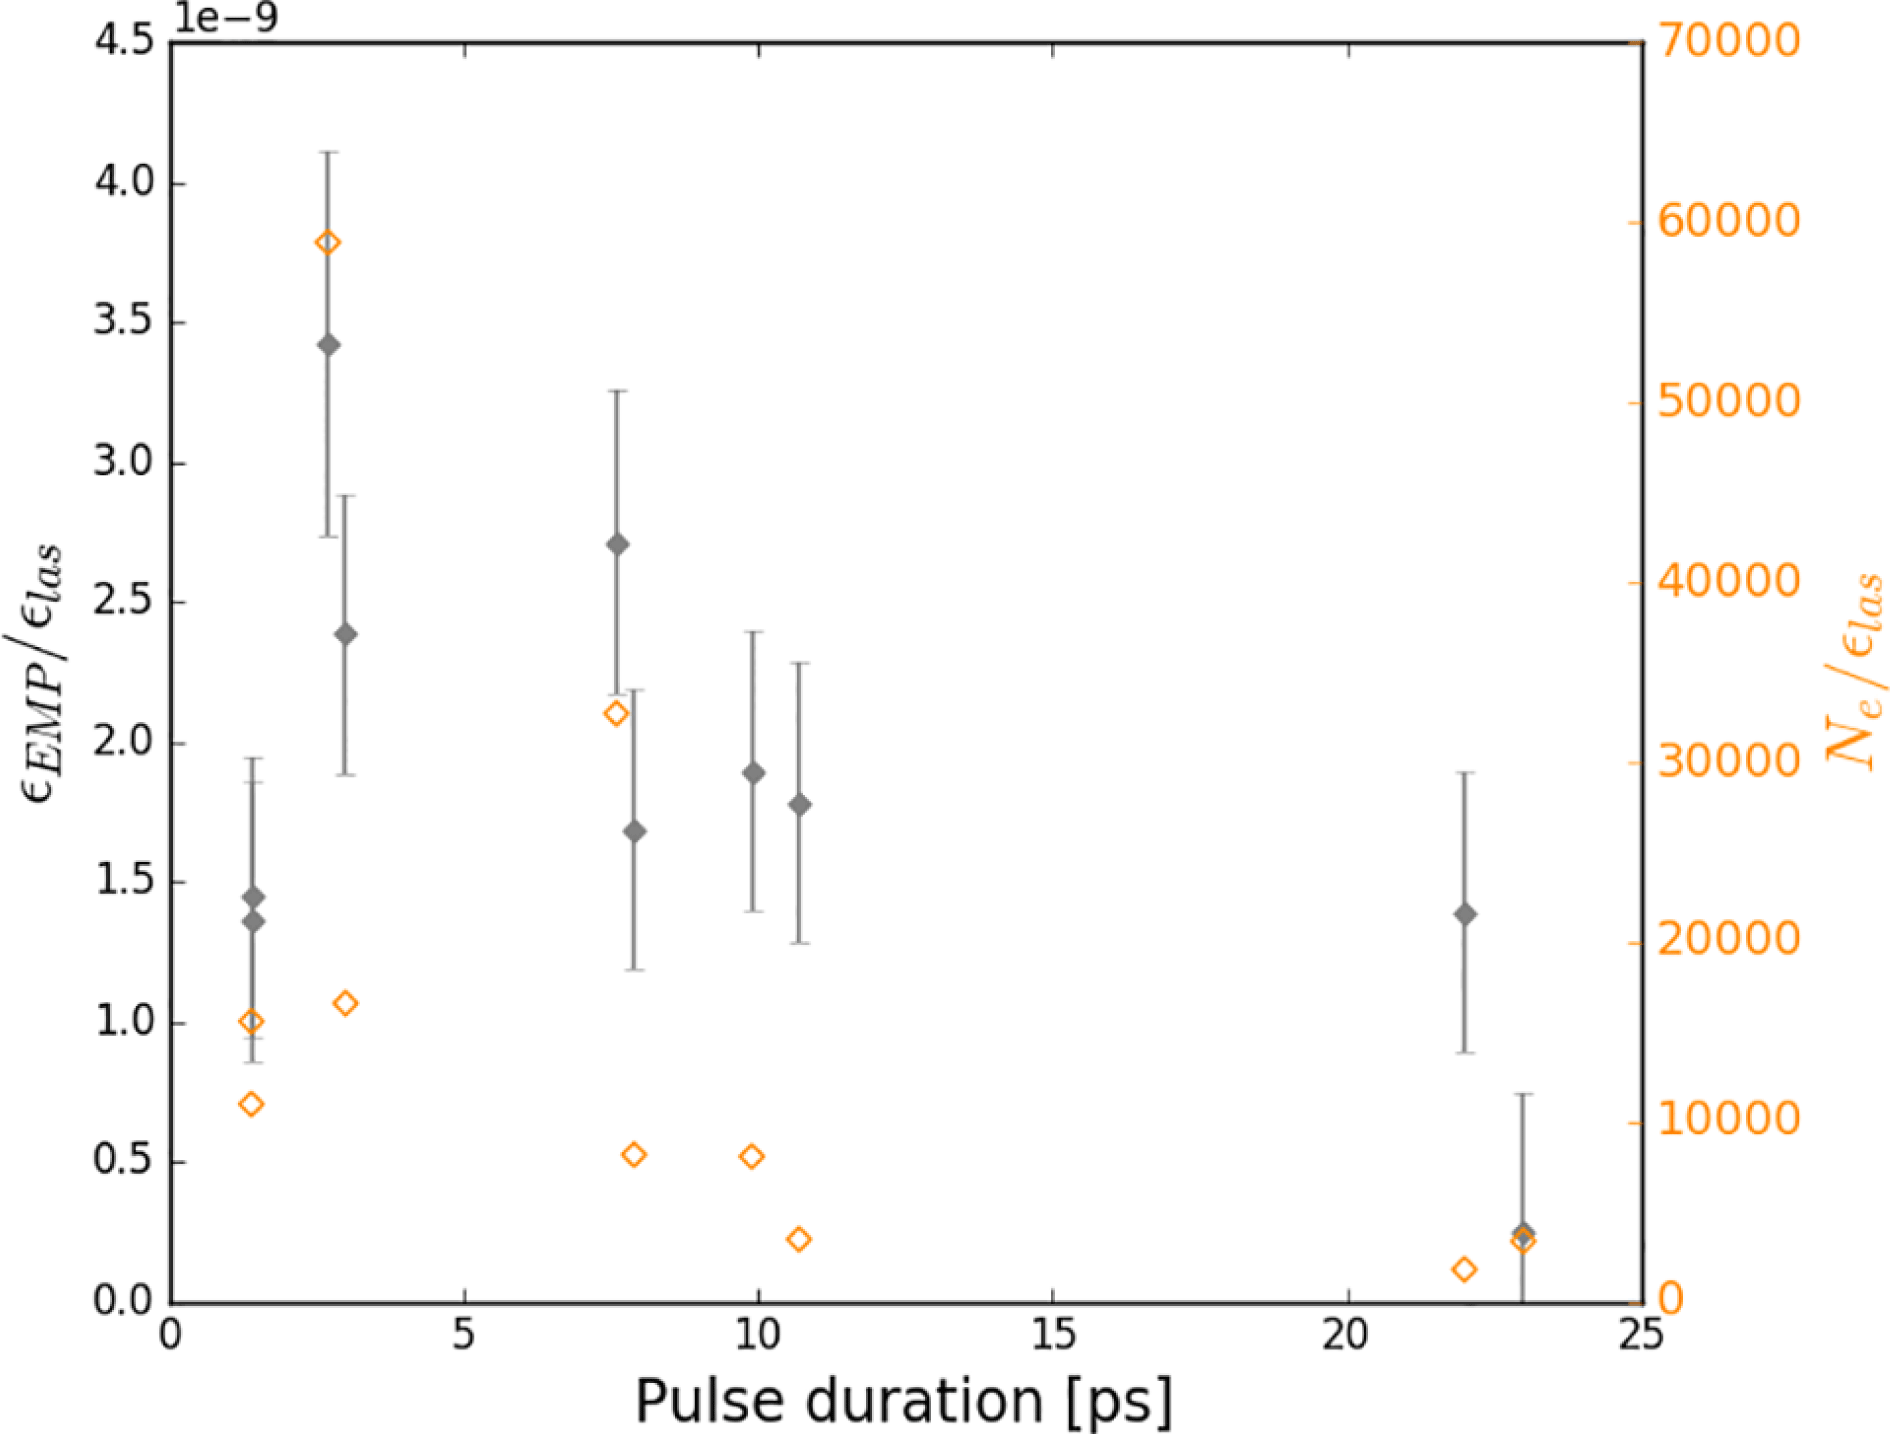
3.2 Pulse duration
The dependence of EMP on laser pulse duration was probed using standard Cu100 foils on cylindrical stalks. The pulse duration of the laser was increased gradually to a maximum of 23 ps and EMP measurements were compared with supplementary data from an electron spectrometer. Results indicate that both EMP energy and the total number of emitted electrons drop away for pulse lengths above 10 ps (see Figure 3). Furthermore, a peak in electron and EMP emission was observed at approximately 2.5 ps. Laser focal intensity ranged from $8.7\times 10^{17}~\text{W}\cdot \text{cm}^{-2}$
to
$8.7\times 10^{17}~\text{W}\cdot \text{cm}^{-2}$
to $2.4\times 10^{18}~\text{W}\cdot \text{cm}^{-2}$
.
$2.4\times 10^{18}~\text{W}\cdot \text{cm}^{-2}$
.
Plot of EMP energy and total number of escaping electrons versus laser pulse duration. The grey diamonds represent the ratio of EMP energy to on-target laser energy, while the orange diamonds represent the ratio of total electron number ( $N_{e}$
) to on-target laser energy. EMP data was taken from the B-dot West probe.
$N_{e}$
) to on-target laser energy. EMP data was taken from the B-dot West probe.
3.3 Pre-pulse delay
The variation of EMP energy with pre-pulse delay is presented in Figure 4. Since the pre-pulse and main drive were both delivered via the same beamline, we attribute the change in EMP to the formation of a frontal pre-plasma[Reference McKenna, Lindau, Lundh, Neely, Persson and Wahlstrom14]. The received pre-pulse energy was consistent at ${\sim}$
0.6 J, while the main beam energy fluctuated between
${\sim}$
0.6 J, while the main beam energy fluctuated between $55$
and 67 J. Standard Cu100 foils with CH stalks were used as targets and laser focal intensity was maintained at
$55$
and 67 J. Standard Cu100 foils with CH stalks were used as targets and laser focal intensity was maintained at $I\,\sim \,5\,\times \,10^{18}~\text{W}\,\cdot \,\text{cm}^{-2}$
. Figure 4 suggests that the greater the delay between the pre-pulse and main drive, the greater the EMP energy. This is consistent with current theoretical models of laser absorption and EMP generation. Scott et al. have shown that laser absorption is a strong function of plasma density and scale length[Reference Scott, Bagnoud, Brabetz, Clarke, Green, Heathcote, Powell, Zielbauer, Arber, McKenna and Neely15], which are both dependent on the pre-pulse delay. The longer the delay between the pre-pulse and main drive, the greater the pre-plasma expansion and the greater the transfer of laser energy to hot electrons.
$I\,\sim \,5\,\times \,10^{18}~\text{W}\,\cdot \,\text{cm}^{-2}$
. Figure 4 suggests that the greater the delay between the pre-pulse and main drive, the greater the EMP energy. This is consistent with current theoretical models of laser absorption and EMP generation. Scott et al. have shown that laser absorption is a strong function of plasma density and scale length[Reference Scott, Bagnoud, Brabetz, Clarke, Green, Heathcote, Powell, Zielbauer, Arber, McKenna and Neely15], which are both dependent on the pre-pulse delay. The longer the delay between the pre-pulse and main drive, the greater the pre-plasma expansion and the greater the transfer of laser energy to hot electrons.
EMP energy as a function of pre-pulse delay, measured by the D-dot probe.

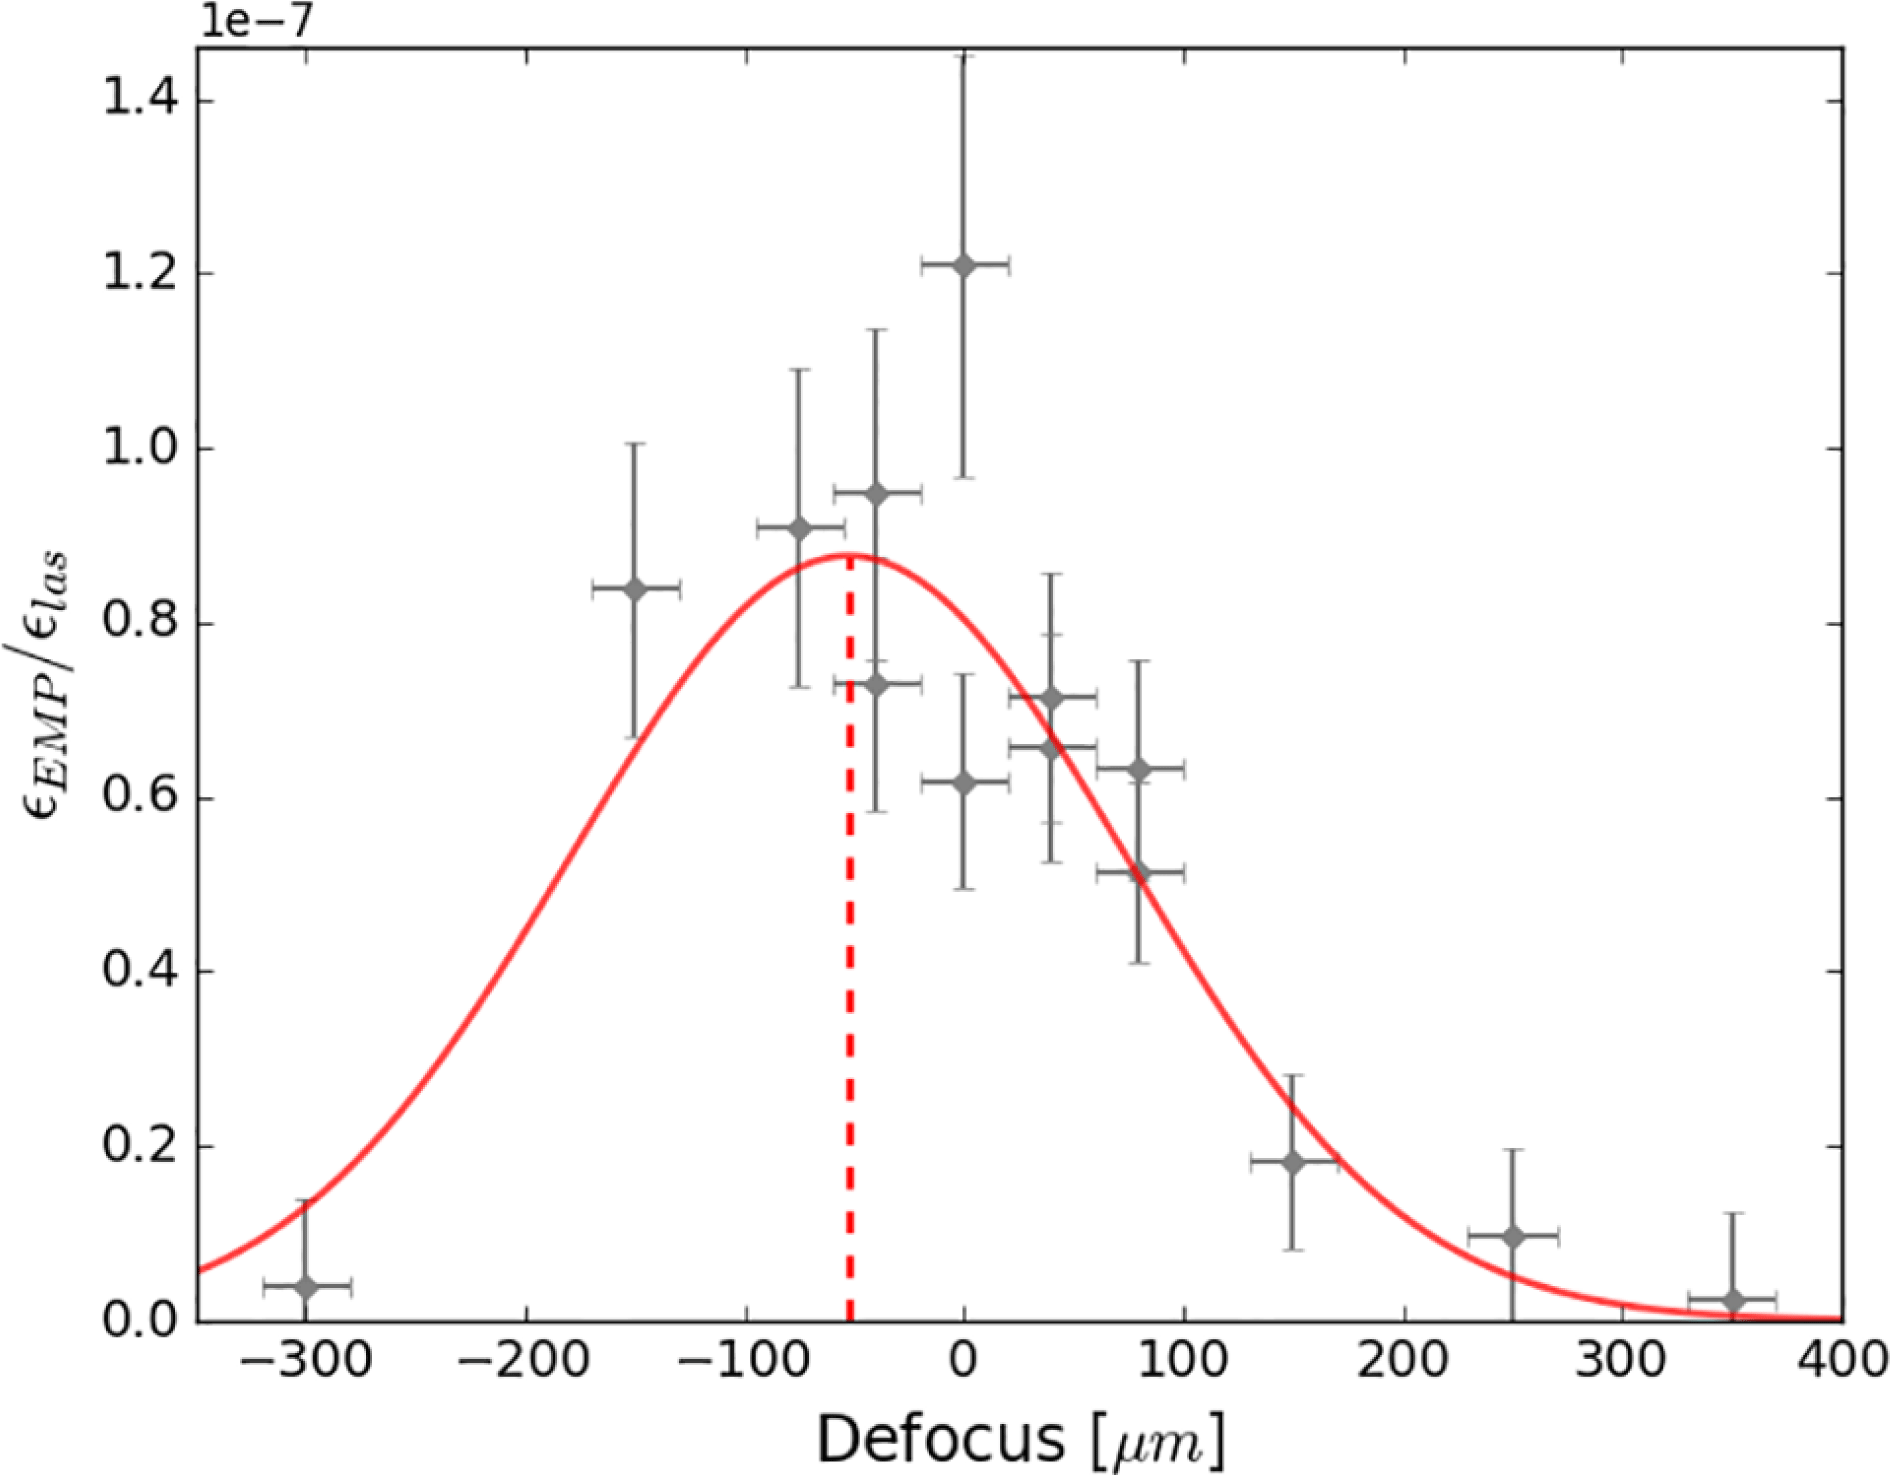
3.4 Defocus
The effect of laser focus on EMP energy can be seen in Figure 5. On-target laser energy spanned a $54$
–64 J range and the beam was focussed onto Cu100 foils mounted on cylindrical CH stalks. Using a Gaussian fit to guide the eye, peak emission appears to fall at a modest defocus, dropping away towards zero at a distance of approximately
$54$
–64 J range and the beam was focussed onto Cu100 foils mounted on cylindrical CH stalks. Using a Gaussian fit to guide the eye, peak emission appears to fall at a modest defocus, dropping away towards zero at a distance of approximately $\pm 300~\unicode[STIX]{x03BC}\text{m}$
from the focal position.
$\pm 300~\unicode[STIX]{x03BC}\text{m}$
from the focal position.
The ratio of EMP energy to laser energy plotted against defocus (as measured by the D-dot East probe). The Gaussian fit is meant as a visual aid, with a laser focal intensity of approximately $1\times 10^{18}~\text{W}\cdot \text{cm}^{-2}$
at the Gaussian peak.
$1\times 10^{18}~\text{W}\cdot \text{cm}^{-2}$
at the Gaussian peak.
4 Target design parameters
4.1 Foil geometry
It has been reported in a number of publications that foil surface area has a significant impact on charge separation and GHz emission from the target[Reference Poyé, Dubois, Lubrano-Lavaderci, D’Humières, Bardon, Hulin, Bailly-Grandvaux, Ribolzi, Raffestin, Santos, Nicolaï and Tikhonchuk8, Reference Dubois, Lubrano-Lavaderci, Raffestin, Ribolzi, Gazave, Compant La Fontaine, D’Humières, Hulin, Nicolaï, Poyé and Tikhonchuk10, Reference Chen, Li, Yu, Wang, Li, Peng and Zhu16]. Our experiment used three different foil designs, each made from copper and mounted on CH stalks. The standard foils were $100~\unicode[STIX]{x03BC}\text{m}$
-thick with a
$100~\unicode[STIX]{x03BC}\text{m}$
-thick with a $3~\text{mm}\times 8~\text{mm}$
rectangular surface. We also used smaller ‘flag’ targets (
$3~\text{mm}\times 8~\text{mm}$
rectangular surface. We also used smaller ‘flag’ targets ( $1~\text{mm}\times 1~\text{mm}$
and
$1~\text{mm}\times 1~\text{mm}$
and $0.5~\text{mm}\times 0.5~\text{mm}$
), as well as wire targets with 25, 50 and
$0.5~\text{mm}\times 0.5~\text{mm}$
), as well as wire targets with 25, 50 and $100~\unicode[STIX]{x03BC}\text{m}$
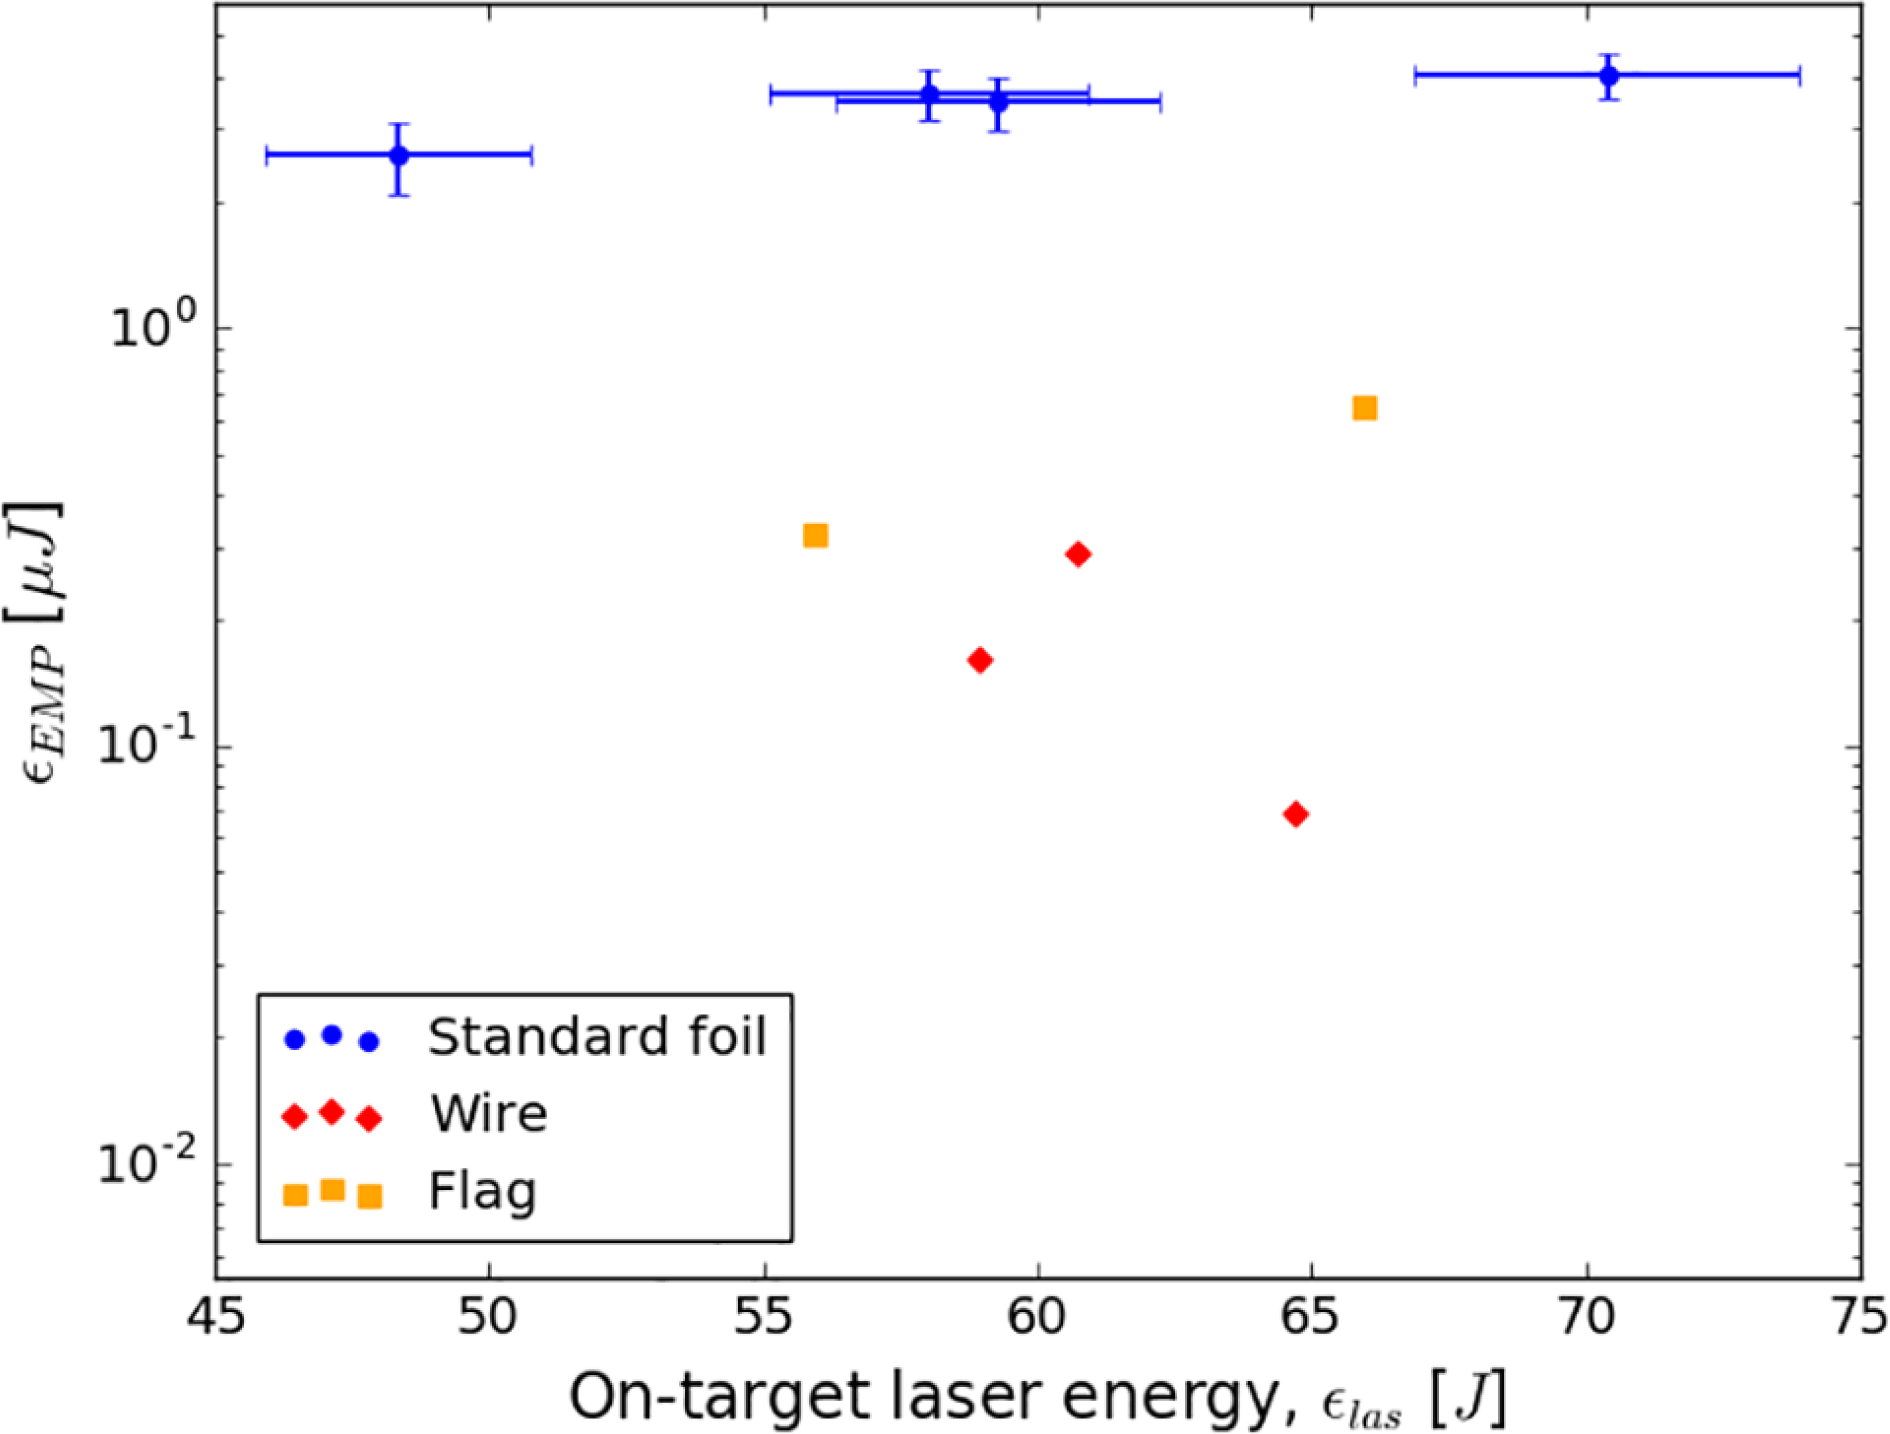
diameters. A marked reduction in EMP was seen on shots involving the flag and wire targets, with over an order of magnitude drop in EMP energy observed for the wire shots (Figure 6). This is qualitatively consistent with existing theoretical and experimental work, which indicates that EMP is strongest for targets with a large transverse area[Reference Poyé, Dubois, Lubrano-Lavaderci, D’Humières, Bardon, Hulin, Bailly-Grandvaux, Ribolzi, Raffestin, Santos, Nicolaï and Tikhonchuk8, Reference Chen, Li, Yu, Wang, Li, Peng and Zhu16–Reference Eder, Throop, Brown, Kimbrough, Stowell, White, Song, Back, Macphee, Chen, Dehope, Ping, Maddox, Lister, Pratt, Ma, Tsui, Perkins, O’Brien and Patel18]. Larger targets tend to build up lower positive potentials because the potential difference caused by the ejection of hot electrons is spread out over a wide area. As a result, more electrons are able to escape and a bigger neutralization current is generated[Reference Chen, Li, Yu, Wang, Li, Peng and Zhu16, Reference Raven, Rumsby, Stamper, Willi, Illingworth and Thareja17].
$100~\unicode[STIX]{x03BC}\text{m}$
diameters. A marked reduction in EMP was seen on shots involving the flag and wire targets, with over an order of magnitude drop in EMP energy observed for the wire shots (Figure 6). This is qualitatively consistent with existing theoretical and experimental work, which indicates that EMP is strongest for targets with a large transverse area[Reference Poyé, Dubois, Lubrano-Lavaderci, D’Humières, Bardon, Hulin, Bailly-Grandvaux, Ribolzi, Raffestin, Santos, Nicolaï and Tikhonchuk8, Reference Chen, Li, Yu, Wang, Li, Peng and Zhu16–Reference Eder, Throop, Brown, Kimbrough, Stowell, White, Song, Back, Macphee, Chen, Dehope, Ping, Maddox, Lister, Pratt, Ma, Tsui, Perkins, O’Brien and Patel18]. Larger targets tend to build up lower positive potentials because the potential difference caused by the ejection of hot electrons is spread out over a wide area. As a result, more electrons are able to escape and a bigger neutralization current is generated[Reference Chen, Li, Yu, Wang, Li, Peng and Zhu16, Reference Raven, Rumsby, Stamper, Willi, Illingworth and Thareja17].
EMP energy as a function of on-target laser energy for wire, flag and standard foil designs (B-dot probe East). Laser focal intensity ranges from $8\times 10^{17}~\text{W}\cdot \text{cm}^{-2}$
to
$8\times 10^{17}~\text{W}\cdot \text{cm}^{-2}$
to $2\times 10^{19}~\text{W}\cdot \text{cm}^{-2}$
on these shots and we have chosen a logarithmic
$2\times 10^{19}~\text{W}\cdot \text{cm}^{-2}$
on these shots and we have chosen a logarithmic $y$
-axis to emphasize the drop in EMP. Notice how changing the wire diameter has led to a deviation from the linear relationship between EMP and on-target laser energy.
$y$
-axis to emphasize the drop in EMP. Notice how changing the wire diameter has led to a deviation from the linear relationship between EMP and on-target laser energy.
EMP energy versus on-target laser energy for a variety of different stalk designs (B-dot probe East). Laser focal intensity is between $8\times 10^{17}~\text{W}\cdot \text{cm}^{-2}$
and
$8\times 10^{17}~\text{W}\cdot \text{cm}^{-2}$
and $2\times 10^{19}~\text{W}\cdot \text{cm}^{-2}$
for these shots. Also included is a linear fit to the standard CH cylindrical stalk data, as detailed in Figure 2.
$2\times 10^{19}~\text{W}\cdot \text{cm}^{-2}$
for these shots. Also included is a linear fit to the standard CH cylindrical stalk data, as detailed in Figure 2.
The three different stalk designs: (a) standard cylindrical geometry with a geodesic path length of 20 mm; (b) a sinusoidally modulated stalk with the same maximum cross-section as the standard cylinder and a path length of 30 mm; (c) spiral stalk design with an identical diameter to (a), but a geodesic path length of 115 mm.

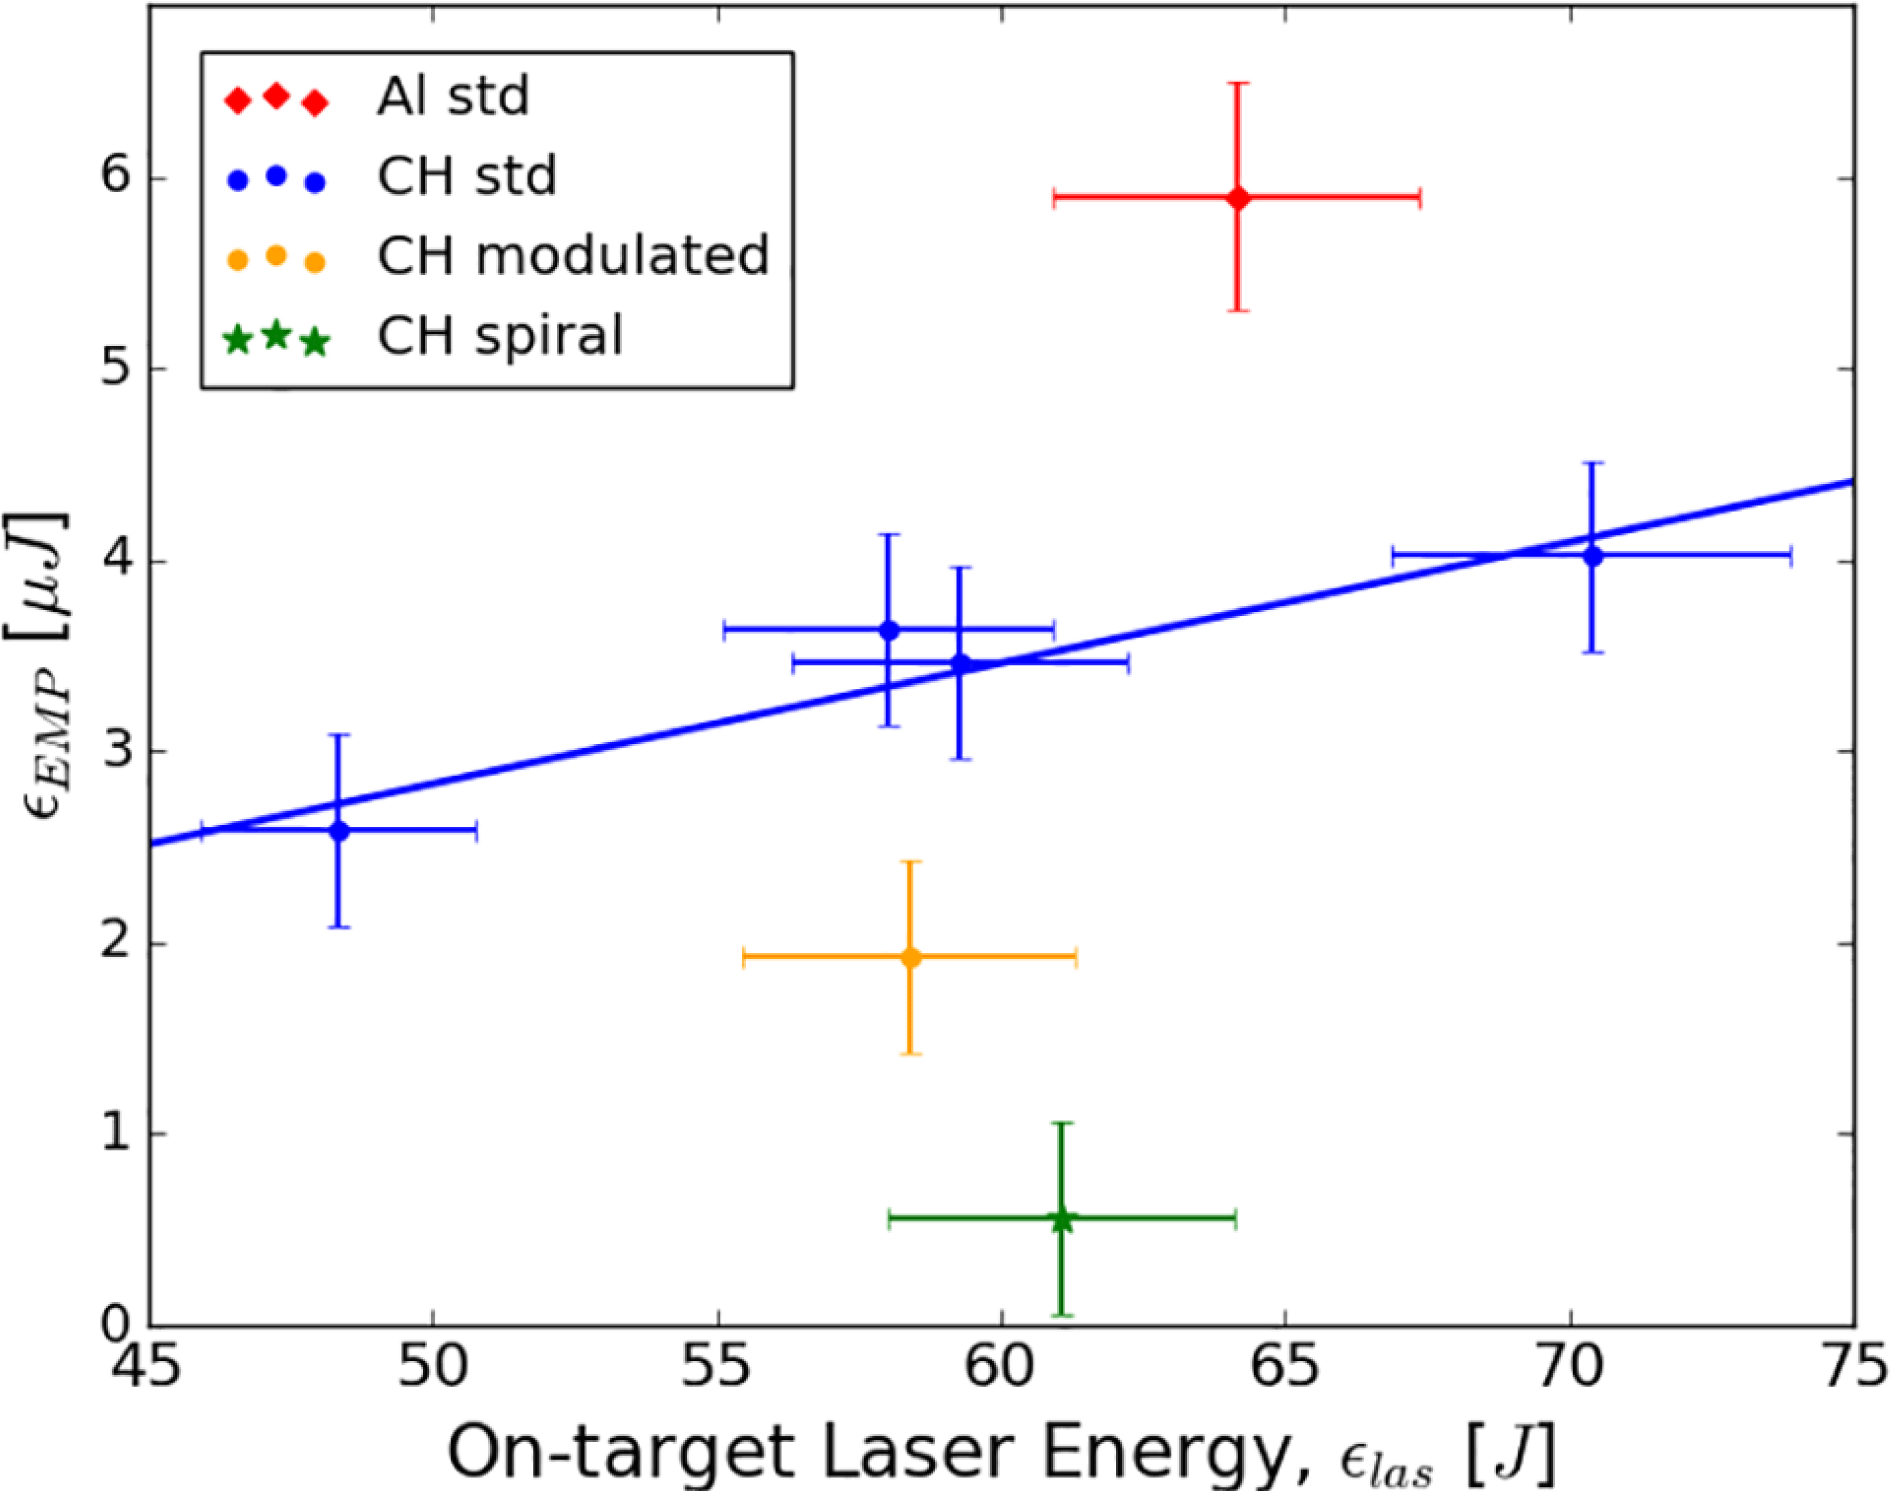
4.2 Stalk design and material composition
To explore how the stalk’s material composition might affect the measured EMP, we compared Al and CH plastic stalks with a fixed cylindrical geometry ( $r=2.9~\text{mm}$
, height is 30 mm). We found that the EMP energy dropped by more than
$r=2.9~\text{mm}$
, height is 30 mm). We found that the EMP energy dropped by more than $1/3$
when Al stalks were substituted for plastic (see Figure 7).
$1/3$
when Al stalks were substituted for plastic (see Figure 7).
To probe the effect of stalk shape on EMP, Cu100 foils were suspended on a variety of 3D-printed CH stalk designs. The geometry and geodesic path length of each design are detailed in Figure 8. We use the term geodesic path to denote the shortest route from the base of the stalk to the bottom of the foil travelling along the stalk surface. It is introduced as a rough measure of stalk impedance and resistance to electrical breakdown.
If the reader refers again to Figure 7, they will observe that EMP was significantly reduced on shots involving the modulated and spiral stalks. The modulated design reduced the received signal by ${\sim}1/3$
on average, but the most profound effects were seen when using the spiral target. Follow-up shots with a 20 ps extended pulse confirmed that the spiral stalk reduces EMP by a factor of
${\sim}1/3$
on average, but the most profound effects were seen when using the spiral target. Follow-up shots with a 20 ps extended pulse confirmed that the spiral stalk reduces EMP by a factor of ${\sim}7$
with respect to the CH cylinders and over an order of magnitude with respect to the Al.
${\sim}7$
with respect to the CH cylinders and over an order of magnitude with respect to the Al.
Now that we have confirmed that the modified stalks offer a clear advantage over conventional designs, it is important to understand why. If the reduction in EMP was caused by impaired charge separation in the target one would expect to see a change in the electron distribution. We find, however, that the number and energy of ejected electrons do not change significantly for shots involving the spiral and modulated stalks. Data from the electron spectrometer (see Figures 9 and 10) shows that the energy, temperature and number of emitted electrons scale strongly with laser energy, but have no correlation with stalk geometry. We can therefore be confident that the drop in EMP is caused by a corresponding reduction in the return current through the stalk.
The magnitude and temporal profile of this return current were not captured by our experiment. For a foil mounted on top of a dielectric stalk, a polarization current can pass through the stalk body or electrical breakdown can lead to the generation of a surface current[Reference Zener19]. By increasing the geodesic path length while keeping the stalk height constant, it is possible to increase both the impedance and inductance of the target stalk. The benefits of this approach are most clearly seen in the spiral signal; however, since the cylindrical and modulated stalks have similar electromagnetic characteristics, differences between the two may be a combination of several factors. In the next section, we explore other potential explanations for the observed reduction in EMP. The sinusoidal and spiral stalks not only have a greater base geodesic length — their shape introduces a shadowing effect that could make them more resistant to photoionization, charge implantation and electrical breakdown.
Total number of electrons recorded by the electron spectrometer as a function of on-target laser energy. Uncertainties in on-target laser energy are ${\sim}10\%$
.
${\sim}10\%$
.

Number of electrons with energies above 5 MeV versus on-target laser energy. Uncertainties in on-target laser energy are ${\sim}10\%$
.
${\sim}10\%$
.

5 Particle-In-Cell (PIC) and electromagnetic simulations
5.1 Setup
To better understand the effects of stalk geometry on EMP emission, self-consistent 3D PIC simulations were performed alongside full-wave time-domain EM simulations[Reference Consoli, De Angelis, Duvillaret, Andreoli, Cipriani, Cristofari, Di Giorgio, Ingenito and Verona20]. Simulated foil dimensions were fixed at $8~\text{mm}\times 4.5~\text{mm}\times 0.75~\text{mm}$
and targets were placed at the centre of a perfectly conducting box with
$8~\text{mm}\times 4.5~\text{mm}\times 0.75~\text{mm}$
and targets were placed at the centre of a perfectly conducting box with $X_{\text{box}}=800~\text{mm}$
,
$X_{\text{box}}=800~\text{mm}$
, $Z_{\text{box}}=600~\text{mm}$
and height
$Z_{\text{box}}=600~\text{mm}$
and height $Y_{\text{box}}=440~\text{mm}$
. Descriptions of the various stalk designs can be found in Figure 11.
$Y_{\text{box}}=440~\text{mm}$
. Descriptions of the various stalk designs can be found in Figure 11.
Side elevation of stalk designs used in 3D PIC simulations. Transparent grey sections represent a perfect electrical conductor (PEC), while the grey-green regions represent Teflon plastic. (a) Standard cylindrical stalk configuration: pure Teflon and PEC models were used. (b) Sinusoidally modulated Teflon stalk. (c) Teflon spiral stalk. (d) Half-length Teflon and PEC stalk.

Simulated particles were emitted from a circle of 1 mm radius, centred on the foil surface. Conical electron emission was radially uniform within an angle of $40^{\circ }$
with respect to the target normal and particle energies were uniformly distributed between 50 and 150 keV. The total emitted charge was restricted to 5 nC in order to maintain cone structure and minimize space-charge effects. The electron current was set to a maximum at the first computational step before undergoing a Gaussian decay with an inflection time of 0.5 ns. Since we are only interested in the GHz component of the EMP, these assumptions are suitable for picosecond-scale laser interactions with a nanosecond-order response time.
$40^{\circ }$
with respect to the target normal and particle energies were uniformly distributed between 50 and 150 keV. The total emitted charge was restricted to 5 nC in order to maintain cone structure and minimize space-charge effects. The electron current was set to a maximum at the first computational step before undergoing a Gaussian decay with an inflection time of 0.5 ns. Since we are only interested in the GHz component of the EMP, these assumptions are suitable for picosecond-scale laser interactions with a nanosecond-order response time.
The ejected electron current is the source of all EM fields inside the box. Eigenmode field solutions are excited as these electrons travel across the box interior and over the target stalk. All electrons ejected from the target will have reached the walls after 6 ns, at which point they can contribute towards the current flowing across the stalk. In a closed, perfectly conducting chamber, modal fields excited by electron currents will have no opportunity to decay. Simulations were therefore stopped after 25 ns, when oscillations had achieved a steady state.
For each of the five stalk designs, the energy associated with the electric ( $\unicode[STIX]{x1D716}_{\text{electric}}=\int _{0}^{t_{f}}|\text{}\text{E}|^{2}\,\text{d}t$
) and magnetic (
$\unicode[STIX]{x1D716}_{\text{electric}}=\int _{0}^{t_{f}}|\text{}\text{E}|^{2}\,\text{d}t$
) and magnetic ( $\unicode[STIX]{x1D716}_{\text{magnetic}}=\int _{0}^{t_{f}}|\text{}\text{H}|^{2}\,\text{d}t$
) fields was calculated. These calculations were performed at two locations:
$\unicode[STIX]{x1D716}_{\text{magnetic}}=\int _{0}^{t_{f}}|\text{}\text{H}|^{2}\,\text{d}t$
) fields was calculated. These calculations were performed at two locations: $P_{1}(-X_{\text{box}}/4,-Y_{\text{box}}/4,Z_{\text{box}}/4)$
and
$P_{1}(-X_{\text{box}}/4,-Y_{\text{box}}/4,Z_{\text{box}}/4)$
and $P_{2}(X_{\text{box}}/4,Y_{\text{box}}/4,Z_{\text{box}}/4)$
.
$P_{2}(X_{\text{box}}/4,Y_{\text{box}}/4,Z_{\text{box}}/4)$
.
5.2 Results and analysis
Simulation results for the magnetic energy at the two locations are contained in Figure 12. In switching from the PEC mount to the Teflon stalk, $\unicode[STIX]{x1D716}_{\text{magnetic}}$
was reduced by a factor of
$\unicode[STIX]{x1D716}_{\text{magnetic}}$
was reduced by a factor of $27$
at
$27$
at $P_{1}$
and a factor of
$P_{1}$
and a factor of $16$
at
$16$
at $P_{2}$
. No advantage was found for using the sinusoidal stalk over the dielectric cylinder and only a modest additional reduction was found for the spiral stalk (
$P_{2}$
. No advantage was found for using the sinusoidal stalk over the dielectric cylinder and only a modest additional reduction was found for the spiral stalk ( $26\%$
at
$26\%$
at $P_{1}$
and
$P_{1}$
and $12\%$
at
$12\%$
at $P_{2}$
). Although these results show striking EMP attenuation when switching from conducting to insulating stalks, they do not explain the lower attenuation of the cylindrical dielectric stalk compared with the sinusoidal and spiral designs. One possible explanation involves a superficial charged layer caused by X-ray/UV photoionization and electron/ion bombardment of the rod surface, effectively transforming the dielectric stalk into a conductor and reducing the low-conductance path length. Stalks with a large low-conductance path length, such as the spiral stalk, will be more resistant to electrical breakdown and EMP.
$P_{2}$
). Although these results show striking EMP attenuation when switching from conducting to insulating stalks, they do not explain the lower attenuation of the cylindrical dielectric stalk compared with the sinusoidal and spiral designs. One possible explanation involves a superficial charged layer caused by X-ray/UV photoionization and electron/ion bombardment of the rod surface, effectively transforming the dielectric stalk into a conductor and reducing the low-conductance path length. Stalks with a large low-conductance path length, such as the spiral stalk, will be more resistant to electrical breakdown and EMP.
Two tables containing values of the magnetic component of the EMP energy ( $\unicode[STIX]{x1D716}_{\text{magnetic}}$
) at positions
$\unicode[STIX]{x1D716}_{\text{magnetic}}$
) at positions $P_{1}$
and
$P_{1}$
and $P_{2}$
in the simulation box.
$P_{2}$
in the simulation box.

To model the generation of this hypothetical charged layer, simulations were performed using a dielectric stalk of half-length (see Figure 11). The shorter stalk produced a much stronger EMP than the full-size cylinder, demonstrating that an effective decrease in geodesic path length (through photoionization and/or charge implantation) may be responsible for the relatively low EMP attenuation observed for CH cylinders in our experiment. It also provides us with an explanation for the performance of the modified stalks. Both the sinusoidal and spiral stalks have surface regions out of direct sight of the target, protecting them from the harsh laser plasma interaction and increasing their low-conductance path length. Although these results are promising, it should be remembered that our simulations do not account for photoionization or charge implantation physics. Further experimental work is needed before we can definitively identify the cause of reduced EMP emission from modified stalks.
6 Conclusion
Control and characterization of EMP emission at the VULCAN TAW facility has been achieved through the alteration of laser, target foil and stalk/mount characteristics. EMP energy was found to scale linearly with applied laser energy, but it is also sensitive to laser pre-pulse delay, pulse duration, defocus, stalk material and target transverse area. We have successfully reduced the measured EMP energy by increasing the geodesic path length of the target stalk and we have shown that a dielectric spiral design is an effective and unobtrusive means of limiting GHz emission from the target. 3D PIC simulations suggest that this reduction may be due to a shadowing effect that limits photoionization and charge implantation along the length of the stalk. A full theoretical description of the current discharge mechanism in these modified stalks is left to future work.
Acknowledgements
The authors would like to thank the staff of the Central Laser Facility, whose support and expertise were invaluable in the production of this paper. They also gratefully acknowledge funding from EPSRC grants EP/L01663X/1 and EP/L000644/1, the Newton UK grant, the National Natural Science Foundation of China NSFC/11520101003, and the LLNL Academic Partnership in ICF.
Appendix A. Target foil thickness
Rectangular Cu foils suspended on CH cylindrical stalks were used to gauge the impact of foil thickness on EMP emission. A variety of thicknesses were tested between $1$
and 100
$1$
and 100 $\unicode[STIX]{x03BC}\text{m}$
, but we discovered no substantial correlation with integrated EMP energy.
$\unicode[STIX]{x03BC}\text{m}$
, but we discovered no substantial correlation with integrated EMP energy.
The ratio of EMP energy to laser energy versus thickness of PE backing on $1~\unicode[STIX]{x03BC}\text{m}$
Cu targets as measured by the B-dot West probe.
$1~\unicode[STIX]{x03BC}\text{m}$
Cu targets as measured by the B-dot West probe.

We also varied the thickness of polyethylene (PE) applied to the back of Cu–PE targets, as shown in Figure 13. Fixing the Cu thickness at $1~\unicode[STIX]{x03BC}\text{m}$
and the stalks as CH cylinders, we increased the PE backing up to
$1~\unicode[STIX]{x03BC}\text{m}$
and the stalks as CH cylinders, we increased the PE backing up to $5000~\unicode[STIX]{x03BC}\text{m}$
. Again, no clear trend was observed.
$5000~\unicode[STIX]{x03BC}\text{m}$
. Again, no clear trend was observed.
For target thicknesses smaller than the hot electron range, one would expect increased target charging from electrons exiting the target rear surface[Reference Poyé, Hulin, Bailly-Grandvaux, Ribolzi, Raffestin, Bardon, Lubrano-Lavaderci, Santos, Nicolaï and Tikhonchuk2, Reference Ra̧czka, Dubois, Hulin, Tikhonchuk, Rosiński, Zaraś-Szydłowska and Badziak21]. Given that our results display no such trend, it is likely the targets were too thick to resolve this effect.


 Open access