

Energy restriction (ER) prolongs lifespan in a wide variety of organisms, and has been shown to delay the onset or decrease the incidence of many ageing-related diseases, including type 2 diabetes and cancer(Reference Jolly1, Reference Bordone and Guarente2). These beneficial effects of ER are likely mediated dynamically through the regulation of a variety of genes(Reference Spindler3–Reference Cao, Dhahbi and Mote5), as has been shown using DNA microarray analyses. Although the gene expression profiles under a dietary-restricted condition have so far been attracting attention as valuable tools for investigating the molecular basis of the ageing process, they can also be highly informative for gaining a broad understanding of the effects of dietary manipulation on animals.
In recent years, DNA microarray technology has been applied to studies on the effects of dietary factors, and has already been successfully utilised in many situations(Reference Kato, Saito and Kimura6, Reference Roy and Sen7). In typical studies aimed at elucidating the effect of specific dietary factors, the target component is mix-fed to animals, or the amount or composition of the nutrient under consideration is modified. Such manipulations often result in the change (i.e. decrease in most cases) in the amount of food consumed by the animals or alteration of the diurnal pattern of food intake. These changes might affect the gene expression pattern and hinder appropriate interpretation of gene expression data. In this respect, gene expression profiles under conditions of restriction of food intake will help effectively utilise transcriptomics data in food science when they are used as reference data.
Gene array technology has also offered an approach for screening the ER mimetics, promising preventive agents for ageing-related diseases(Reference Ingram, Anson and de Cabo8, Reference Spindler9). Recently, the commonality of the gene expression pattern between ER and treatment with some anti-diabetic or lipid-lowering agents was reported, suggesting their potency to mimic the ER effect to be manifested at the levels of gene expression(Reference Dhahbi, Mote and Fahy10, Reference Corton, Apte and Anderson11). In this regard, the pattern of gene expression under ER can be used as reference data, which could prove to be a highly potential tool for searching and investigating ER mimetics. Such a strategy can also be applied to nutritional studies, given the growing demands for dietary manipulations leading to ER-like health effects, including the retardation of ageing and the reduction of weight. It has already been established that some dietary components act to reduce the body weight and fat mass of animals without a notable change in food intake(Reference Tachibana, Matsumoto and Fukui12, Reference Matsui, Ito and Nishimura13), which resembles one of the major ER-like physiological effects.
The effect of ER on global gene expression has so far been examined in relatively long-term and severe conditions, since the main focus of many ER studies has been its effect on longevity(Reference Dhahbi, Kim and Mote4, Reference Cao, Dhahbi and Mote5, Reference Weindruch, Kayo and Lee14). To our knowledge, there has been no comprehensive examination of the gene expression change by subtle dietary restriction such as 10 % ER for a relatively short period, a condition that is similar to that found in the studies of food functionality. Given this fact, the expression data obtained under mild-to-moderate and relatively short-term ER should be helpful for the effective interpretation of nutrition-related transcriptomics data.
Thus, the present study was conducted to obtain the gene expression profiles of the liver of young growing rodents, one of the most frequently used models in nutritional studies(Reference Matsui, Ito and Nishimura13, Reference Yokohira, Yamakawa and Saoo15–Reference Sun, Sadighi Akha and Miller17), after mild restriction of food intake (5–30 % restriction) for 1 week or 1 month.
Materials and methods
Animal experiment
Male Wistar rats purchased from Japan SLC (Tokyo, Japan) at 5 weeks of age were housed individually in an air-conditioned room at a controlled temperature of 23 ± 1°C under a 12 h light–12 h dark cycle. After a pre-feeding period with an American Institute of Nutrition-93G pellet diet for 3 d and then with an American Institute of Nutrition-93G powdered diet for 1 week, the rats were divided into ten groups of five each by body weight-balanced randomisation. Two groups and the control groups were given an American Institute of Nutrition-93G powdered diet ad libitum for either 1 week or 1 month. The daily intakes of the control groups were recorded, and 95, 90, 80 and 70 % of the amount consumed by the control groups were given to other groups on the next day; they were designated as 5, 10, 20 and 30 % ER, respectively. Tap water was freely available throughout the experiment. All animal experiments were performed in accordance with the guidelines of the Animal Usage Committee of the Faculty of Agriculture, the University of Tokyo, and were verified by the committee (permission number 1818T0011). Body weight was measured every morning. On the last day of the experiment, after overnight deprivation of food (16 h), the rats were deeply anaesthetised with diethyl ether and killed by exsanguination of the aorta abdominalis. The liver was then extracted, weighed and stored immediately in RNAlater (Ambion, Tokyo, Japan) solution to stabilise and protect the cellular RNA in intact unfrozen samples. Adipose tissues were also removed and weighed.
Microarray experiments
Total RNA was isolated from the liver tissues using an RNeasy mini kit with DNase treatment (Qiagen, Valencia, CA, USA) and a QIAshredder (Qiagen) according to the manufacturer's protocol, and was eluted in RNase-free water at a concentration of 1 μg/μl. An equal amount of RNA from five animals in the same treatment group was pooled and reverse transcribed to the first-strand complementary DNA using SuperScript II RT. Second-strand complementary DNA synthesis was then carried out using a DNA polymerase. Biotinylated complementary RNA was generated from these complementary DNA using a BioArray HighYield RNA transcript labeling kit (Enzo Life Sciences, Farmingdale, NY, USA) according to the standard Affymetrix protocols. It was then purified with RNeasy spin columns (Qiagen), and fragmented before hybridisation. A pool of complementary RNA was divided in half and used separately for the hybridisation to two GeneChips. Hybridisation mixtures were boiled at 99°C, loaded on an Affymetrix GeneChip Rat Expression Set 230 Array and hybridised at 45°C for 16 h. Washes were performed on a Fluidics Station 450 using the manufacturer's (Affymetrix, Santa Clara, CA, USA) recommended wash solutions, and the chips were stained with a streptavidin–phycoerythrin conjugate for fluorescence detection. After staining, the chips were scanned with an Affymetrix GeneArray Scanner 3000.
Analysis of microarray data
Image analysis was performed using the Affymetrix GeneChip Operating Software (GCOS version 1.3), which uses the MAS5 (Microarray Suite version 5) algorithm to analyse the scanned images, to obtain a detection call. MAS5 is the official algorithm supplied by Affymetrix, and is used for converting intensities to a numerical format. The detection call indicated whether a transcript was reliably detected (designated as PRESENT) or not detected (designated as ABSENT). A detection P value which is calculated using the one-sided Wilcoxon signed rank test reflects the confidence of the detection call.
The pairwise comparisons were done using GeneChip Operating Software for expression profiles between the ER and control groups, which were designated as baseline arrays. During comparison analysis, each probe set on the experimental array was compared to its counterpart on the baseline array. As a result, the change in P value for 15 923 probe sets corresponding to the change call (‘increase’, ‘marginal increase’, ‘decrease’, ‘marginal decrease’ and ‘no change’) was obtained. In the present study, we used the default criteria of the GeneChip Operating Software/MAS5's ‘detection P value’ and ‘change P value’ which are defined as follows: PRESENT, P < 0·04; MARGINAL, 0·04 ≤ P < 0·06; ABSENT, P ≥ 0·06; increase, P ≤ 0·0025; marginal increase, 0·0025 < P ≤ 0·003; decrease, P ≥ 0·998; marginal decrease, 0·997 ≤ P < 0·998, and no change, 0·003 < P < 0·997. These flags with the above-mentioned criteria are generally used for the determination of differentially expressed genes(Reference Bardag-Gorce, Dedes and French18–Reference McClintick and Edenberg21) in the Affymetrix GeneChip experiments. Another algorithm was used to calculate a quantitative estimate of the gene expression change in the form of the signal log ratio. In order to figure out dynamic expression changes induced by the mild-to-moderate ER, we did not apply a fold-change cut-off. A further description of the statistical algorithms used here is available at the Affymetrix official site http://www.affymetrix.com/
To reduce false positives as much as possible, we used a conservative approach in the analysis with a combination of stringent filtering methods. Initially, we excluded the probe sets that were ‘ABSENT’ in at least one of each hybridisation pair. Then, comparisons with a ‘no change’ and a ‘marginal increase’ and a ‘marginal decrease’ call were removed. We used duplicate GeneChips on each group sample, and the expression change was taken as informative if the change call of both chips was either ‘increase’ or ‘decrease’, and was in the same direction. For the gene ontology analysis, all the probe sets with the informative changes were used. Of these genes, the probe sets exhibiting alterations across all the levels of ER in the same direction were considered to be ER responsive. The data filtering and identification of overlapped probe sets were carried out using Microsoft Excel. All informative gene expression data were registered to our original microarray database(Reference Saito, Arai and Kato22) accessible at http://nutrigenomics.jp. The raw data set can be accessed at the GEO site http://www.ncbi.nlm.nih.gov/geo/ (accession number GSE18297).
Quantitative PCR
To validate the expression data of the DNA microarray, quantitative PCR (qPCR) was conducted using the RNA samples obtained from individual rats. Values for each gene were normalised by the values of the corresponding glyceraldehyde-3-phosphate dehydrogenase gene, and the ratios of each ER/control were calculated. We used glyceraldehyde-3-phosphate dehydrogenase gene as an internal standard control because its mRNA level, quantified by qPCR, was not significantly different in all the experimental groups (data not shown). Primers were designed with a web application (PRIMER3), and their sequences are given in Supplementary Table S1, available online only at http://journals.cambridge.org. SYBR Green EX (Takara Bio, Madison, WI, USA) was used on the real-time PCR detection system (Takara Bio) using thin-wall eight-tube strips. The relative amounts of mRNA were normalised to glyceraldehyde-3-phosphate dehydrogenase, and expressed as the fold-change value of the control.
Functional annotation analysis
Annotation analysis was performed using the functional annotation tool of the Database for Annotation, Visualization and Integrated Discovery 2.1 program(Reference Dennis, Sherman and Hosack23, Reference Huang da, Sherman and Lempicki24). This tool is a web-accessible application that can be used to pick up enrichment in gene groups corresponding to particular biological functions or categories. All informative genes are used for the analysis in response to each ER level. For the measurements of comparison between each ER treatment and control, Gene Ontology:Biological Process categories that were significantly over-represented, as determined by Fisher's exact test, were identified.
Statistical analysis
Data are presented as the means with their standard errors. Statistical significance was assessed using one-way ANOVA followed by Dunnett's post hoc test for multiple comparisons.
Results
Body and organ weights
Throughout the experiment, the body weight of the rats of all groups gradually increased. The weight gain was significantly lower in proportion to the ER level in all the ER groups except in the 1-week 5 % ER group (Table 1). Both the liver weight and adipose tissue weight changed similar to the body weight. No significant differences were observed in the weights of the epididymal, perirenal and mesenteric WAT of the 5 and 10 % ER groups compared with the control group. It was noted that the liver weight was significantly reduced in all the ER groups, including the 1-week 5 % ER group.
(Mean values with their standard errors, n 5)

WAT, white adipose tissue.
Mean values were significantly different between ad libitum group and ER group: *P < 0·05, **P < 0·01 (by ANOVA followed by Dunnett's post hoc test).
The number of altered genes
The number of genes whose expression levels were judged to be altered according to the criteria described in Materials and methods is given in Table 2. In the 1-week groups, the number increased in parallel to the increase in ER levels up to 20 %, while no further increase was observed in the 30 % ER group. In contrast, the number of genes was not markedly changed in the 1-month ER groups, although the differences in body weight among the groups were more striking than those in body weight among the 1-week feeding groups. Thus, the ER-dependent increase in the altered genes was not observed in this longer feeding condition. A similar tendency was observed when the threshold value of the signal log2 ratio was set to 0·5 or 1·0 (data not shown).
The number of gene probes affected by mild-to-moderate energy restriction (ER)
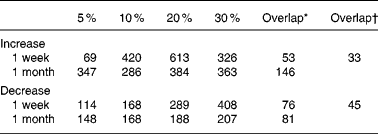
* The number of gene probes exhibiting overlapped changes across all the ER levels within the same period.
† The number of gene probes overlapped throughout all the ER groups. The values were determined according to the criteria described in Materials and methods.
The number of informative gene probe sets overlapping among all the ER groups of 1-week feeding was fifty-three for an increase and seventy-six for a decrease. Meanwhile, 146 gene probes for an increase and 81 gene probes for a decrease were overlapped among the groups in the 1-month feeding. Of all, nearly half of the detected probe sets that were altered by 5 % ER in 1-week feeding were also changed in 1-month feeding (Table 2). Ninety gene probes, including functionally obscure genes, altered the expression across all the ER groups. Finally, as given in Tables 5 and 6, seventy-two well-characterised genes from seventy-eight gene probes (thirty-three gene probes for an increase and forty-eight gene probes for a decrease, respectively) were screened out, and defined as ER-responsive genes.
The characterisation of energy restriction-responsive genes
To characterise the global effect of short-term and mild-to-moderate ER, we searched for enriched biological categories of genes in each level of ER group using the functional annotation tool of National Institutes of Health-Database for Annotation, Visualization and Integrated Discovery. Groups of genes related to alcohol metabolism, cholesterol biosynthesis, sterol synthesis and lipid synthesis were categorised as significantly decreased genes using Fisher's exact test in all the ER groups (Table 3). On the other hand, fatty acid β-oxidation, carboxylic acid metabolism, organic acid metabolism and cellular lipid metabolism classes were categorised as significantly increased classes (Table 4). The category of amino acid catabolism and nitrogen catabolism was detected as significant in the higher ER levels. Functional annotation analysis proved that significant functional classes were mostly the same across all the ER groups.
Gene categories determined to be significantly over-represented as down-regulated groups by mild-to-moderate energy restriction

The arrows indicate significant over-representation with P < 0·0001 (Fisher's exact test).
Gene categories determined to be significantly over-represented as up-regulated groups by mild-to-moderate energy restriction

The arrows indicate significant over-representation with P < 0·0001 (Fisher's exact test).
We next conducted individual analysis of the genes responding to ER. The genes up-regulated or down-regulated across all the ER groups were defined as ER-responsive genes considering that their expressions were markedly altered by a broad range (5–30 %, 1 week and 1 month) of ER. Moreover, the changes in them were observed even in the 1-week ER treatment, where no body weight change was observed. For these reasons, we focused on characterising these seventy-two genes, which are listed in Tables 5 and 6.
The genes up-regulated across all the energy restriction groups

Genes given Affymetrix's ‘PRESENT’ (the detection call indicated whether a transcript was reliably detected) call and ‘increase’ call compared to control group in all the restriction groups were sorted out. Values are the means of two independent hybridisations derived from the same complementary DNA (fold-change). Gene identifier indicates Affymetrix ID, and detailed information is available at http://www.affymetrix.com
The genes down-regulated across all the energy restriction groups

CKLF, chemokine-like factor; MARVEL, MAL and related proteins for vesicle trafficking and membrane link; COMM, copper metabolism gene MURR1; YEATS, YNK7, ENL, AF-9, TFIIF small subunit.
Genes given Affymetrix's ‘PRESENT’ (the detection call indicated whether a transcript was reliably detected) call and ‘decrease’ call compared to control group in all restriction groups were sorted out. Values are the means of two independent hybridisations derived from the same complementary DNA (fold-change). Gene identifier indicates Affymetrix ID, and detailed information is available at http://www.affymetrix.com
In line with the results obtained through the Database for Annotation, Visualization and Integrated Discovery analysis, many key factors for the regulation of lipid metabolism were found to be highly regulated by screening using our criteria. Most notable gene among them was that related to the down-regulation of sterol regulatory element-binding protein 1, a master regulator of lipid synthesis in the liver of mammals. In concert with this change, lipogenic enzymes such as farnesyl diphosphate synthase, fatty acid synthase, malic enzyme, ATP citrate lyase and acyl-CoA synthetase short-chain family member 2 were down-regulated. On the other hand, genes involved in fatty acid oxidation in the liver such as carnitine palmitoyltransferase-1, which esterifies the long-chain fatty acids to carnitine, and carnitine palmitoyltransferase-2, which releases the fatty acids from carnitine at the inner mitochondrial membrane, were up-regulated in response to ER. Also of note is the elevated expression of the genes for Cyp4A14, a key cytochrome P450 enzyme catalysing the oxidation of fatty acids.
In the cholesterol-metabolising pathway, many genes were regulated towards reduction of cholesterol abundance. CYP51, a cytochrome P450 enzyme involved in the post-squalene phases of cholesterol biosynthesis, was down-regulated. 7-Dehydrocholesterol reductase, the enzyme responsible for the final step in the production of cholesterol, was also highly down-regulated. Cyp7a1, the rate-limiting enzyme in the catabolism of cholesterol into bile acids, was up-regulated.
Genes encoding the key enzymes of glycolysis such as pyruvate kinase and glucokinase were down-regulated. The up-regulation of the serine dehydratase gene, which encodes a key enzyme for the catabolism of serine, a glucogenic amino acid, was also detected.
Regarding detoxification, ER induced the gene expression of metallothionein-I and -II, which are involved in the detoxification of heavy metals and protection against various cellular stresses. Aldehyde dehydrogenase family 1, member A1, a member of the alcohol degradation enzymes, was also up-regulated.
Genes for several structural proteins such as tubulin α1, tubulin α4, tubulin β2 and actin γ were shown to be down-regulated by ER.
Quantitative PCR validation for microarray data
qPCR was carried out on eight selected genes (of seventy-two ER-responsive genes) to validate the data of the DNA microarray. The genes included those encoding the major metabolic enzymes such as carnitine palmitoyltransferase 1a, farnesyl diphosphate synthase, malic enzyme 1, ATP citrate lyase, fatty acid synthase and glucokinase, whose functions were described earlier and whose changes were thought to be important for the metabolic alterations accompanying mild-to-moderate ER. In addition, nuclear receptor subfamily 1, group I, member 3, also known as constitutive androstane receptor and shown to be strongly up-regulated in the liver of starved mice(Reference Bauer, Hamm and Bonaus25), was also proven to be highly up-regulated in the present study. The results of the qPCR measurement correlated well with the microarray data, with the correlation coefficient r 2 values being 0·879 and 0·817 for the 1-week and 1-month treatments, respectively (Supplementary Fig. S1, available online only at http://journals.cambridge.org). Comparison of fold-changes in response to the ER of these eight genes obtained by qPCR and microarray revealed high consistency in all the cases (Fig. 1). In several genes, the peak response was seen around 10 or 20 % ER in both 1-week and 1-month experiments.
Validation of microarray data by quantitative PCR (qPCR). Grey lines indicate the values obtained from microarray analysis. Black lines indicate the values obtained from qPCR. Results of qPCR are presented as means with their standard errors of five rats. Mean values were significantly different between ad libitum control (CNT) group and energy restriction (ER) groups: *P < 0·05, **P < 0·01. (a and b) Integral membrane transport protein UST4r (UST4r); (c and d) farnesyl diphosphate synthase (Fdps); (e and f) fatty acid synthase (Fasn); (g and h) glucokinase (Gck); (i and j) malic enzyme 1, NADP(+)-dependent, cytosolic (Me1); (k and l) ATP citrate lyase (Acly); (m and n) carnitine palmitoyltransferase 1a, liver (Cpt1a), (o and p) nuclear receptor subfamily 1, group I, member 3 (Nr1i3). a, c, e, g, i, k, m, o: 1 week. b, d, f, h, j, l, n, p: 1 month.

Discussion
While a number of studies have addressed the effect of ER through the analyses of gene expression profiles in rodents(Reference Dhahbi, Kim and Mote4, Reference Cao, Dhahbi and Mote5, Reference Weindruch, Kayo and Lee14), available information on global gene expression is limited when it comes to low-level and short-term ER treatments. Since the changes in gene expression observed in response to mild ER are likely to reflect sensitive and early events related to the health-promoting and anti-ageing effects of ER, identification of responsive genes by exhaustive analyses should provide a basis for effective utilisation of data, especially those obtained in nutrigenomics research. Specific examples include cases where administration of a food factor affects the amount or temporal pattern of food consumption and/or body weight, which leads to changes in the expression of a group of genes; the responses obtained from experiments of this sort are hard to interpret because they can be attributed to either a direct effect of the food component of interest or indirect effects resulting from alterations of metabolic status. Thus, careful examination of genes that are affected by subtle changes in food consumption should help create an analytical infrastructure for nutritional transcriptomics studies. Therefore, the present study was undertaken to characterise genes that were highly responsive to the mild-to-moderate ER by feeding rats with a slightly reduced amount (5, 10, 20 and 30 %) of food for relatively short periods (1 week and 1 month).
A considerable number of genes were shown to be up- or down-regulated even in the 1-week 5 % ER group whose body weight gain (and body fat mass) was not significantly different from that of the control group, indicating that the substantial reduction of body weight and fat phenotype is not necessary for the induction of ER-like effects on gene expressions. Among the ER groups, including the 1-week 5 % ER group, a significant loss of liver weight was observed. This reduction may, in part, be involved in the down-regulation of several structural proteins given in Table 6.
Interestingly, the number of responding genes was dependent on the intensity of ER in the 1-week treatment, but not in the 1-month treatment. These differences between the two experimental periods may be derived from a metabolic adaptation in response to the duration of ER. In the course of assessing the reproducibility of microarray data by qPCR, we found that the peak of the gene expression change is located between 10 and 20 % ER in both 1-week and 1-month experiments (Fig. 1). This may account for the fact that the number of genes altered by 30 % ER was smaller than that of genes altered by 20 % ER in the 1-week experiment.
Two types of data analyses, the examination of individual genes and the production of a list of over-represented gene groups by web tool-based annotation analysis, indicated that many genes for lipid biosynthesis were found to be down-regulated by ER treatment, while many genes related to fatty acid β-oxidation were up-regulated. These observations suggest a metabolic shift with ER treatment towards the use of energy, as has been well characterised in previous studies in more severe ER conditions(Reference Cao, Dhahbi and Mote5). It is also supported by the finding that the representation of the functional annotation category of amino acid catabolism, serving as an important energy source during the fasting state, was significant at a higher level of ER (Table 4). We also observed up-regulation of serine dehydratase, which converts serine to pyruvate. It has been reported that the serine dehydratase pathway is activated in the energy-restricted and starved mouse liver(Reference Hagopian, Ramsey and Weindruch26, Reference Snell27), indicating the promotion of gluconeogenesis for energy generation. Meanwhile, the repression of glycolysis-related genes such as pyruvate kinase and glucokinase was observed. Moreover, genes related to cholesterol biosynthesis were down-regulated, as was manifested by the annotation analysis also. These results are consistent with the previous reports of the ER effect on the glycolytic and gluconeogenic systems, serum cholesterol and lipid levels(Reference Dhahbi, Mote and Wingo28–Reference Mahoney, Denny and Seyfried32).
On comparing the results obtained in the present study with those obtained in other long-term ER studies(Reference Cao, Dhahbi and Mote5, Reference Tsuchiya, Dhahbi and Cui33, Reference Fu, Hickey and Morrison34), several genes such as metallothionein, carnitine palmitoyltransferase 1, Cyp4A14 and fatty acid synthase were found to be altered to the same direction in at least one of the previous microarray studies examining the effect of ER. Among these genes, Cyp4A14 gene was commonly reported to be altered in the other three studies. By analysing multiple microarray data, Swindell(Reference Swindell35) also identified Cyp4A14 as one of the genes up-regulated by ER in mouse liver. Cyp4A14 is a downstream target gene of PPAR-α, and is involved in the oxidation of fatty acids(Reference Ip, Farrell and Robertson36, Reference Reddy and Hashimoto37). Intriguingly, ER mimetics have also been reported to induce the expression of Cyp4A14 in a PPAR-dependent manner(Reference Corton, Apte and Anderson11). The fact that Cyp4A14 responded to even very mild conditions such as the 1-week treatment with 5 % ER suggests that this gene could be a candidate marker gene for the PPAR-α activation and ER-like effects. The mild ER-dependent up-regulation of the Cyp4A14 and PPAR-α genes was confirmed by qPCR (data not shown). Combined use of these genes might provide a sensitive probe for the analysis of metabolic status or the screening of ER-mimetic activity.
In conclusion, while most microarray studies on the effect of ER have been undertaken in severe as well as long-term conditions, the present study, conducted to elucidate the gene expression responses to a very subtle level of ER, has revealed that considerable and consistent expression changes are observed in the liver of young rats. The gene expression profile obtained should be highly useful as a reference resource for data mining not only in nutrigenomics studies, but also in pharmaco- and toxicogenomics studies.
Acknowledgements
We would like to thank Dr Ichiro Matsumoto (ILSI Japan-Endowed Chair of Functional Food Science and Nutrigenomics, The University of Tokyo) and Keiko Abe (Graduate School of Agricultural and Life Sciences, The University of Tokyo) for their support in conducting the microarray experiments. We also thank Dr Sue-Joan Chang (College of Bioscience and Biotechnology, National Cheng Kung University) for critical reading of the manuscript. This work was supported by the Japan Society for the Promotion of Science (KAKENHI, 18380077). K. S. was the main contributor of the present study in designing the experiments, performing data analysis and preparing the manuscript. Y. O. carried out the data collection. M. S. and T. K. contributed to the interpretation of the data and drafting the report. H. K. coordinated the whole project. There are no conflicts of interest.


