





CVD remains the leading contributor to the global burden of disease, accounting for more than 500 million cases and 20 million deaths in 2021(Reference Roth, Mensah and Johnson1,2) . An above-normal serum total cholesterol concentration, and especially a high LDL-cholesterol concentration, is a major risk factor for CVD(Reference Ingelsson, Schaefer and Contois3,4) . Elevated concentration of LDL-cholesterol contributed to approximately 3·8 million CVD deaths in 2021(2), and circulating concentrations of LDL-cholesterol and total cholesterol are positively associated with body fat percentage(Reference Sun, Zhang and Liu5).
A healthy lifestyle, including a healthy diet, is an important strategy for maintaining a low cholesterol concentration or lowering an elevated cholesterol concentration, thereby reducing CVD risk(6). Fish intake is recommended as part of a healthy diet and has been associated with a lower CVD risk in several studies(Reference Zheng, Huang and Yu7–Reference He, Song and Daviglus9). Traditionally, the beneficial health effects of fish consumption have been ascribed to the long-chain n-3 PUFAs EPA (C20:5n-3) and DHA (C22:6n-3)(Reference Mozaffarian and Wu10). However, fish oils and concentrates with high EPA and DHA contents have no cholesterol-lowering effect in people(Reference Eslick, Howe and Smith11–Reference Innes and Calder14) or in rodents(Reference Harris15) unless taken in very high doses. Fat from fish muscles and from residuals from the filleting industry contains a wide range of fatty acids in addition to the well-known n-3 PUFAs, and the fatty acid composition depends on the type of fish, the diet of the fish, and varies between different tissues and lipid classes in the fish. Recently, increasing attention has been directed towards long-chain MUFA such as cetoleic acid (CA, C22:1n-11). Vertebrates have limited capacity to biosynthesise CA, but CA is found in certain fish species including herring, which feeds on zooplanktons such as copepods that are rich in wax esters with n-11 MUFA(Reference Graeve, Albers and Kattner16).
A recent systematic review with meta-analysis concluded that the total cholesterol concentration was lower in rodents fed diets containing fish oils or fish oil concentrates with high CA content, but the review could not conclude about the mechanism(s) behind this effect(Reference Mjåtveit, Oldernes and Gudbrandsen17). Also, lower LDL-cholesterol concentration was reported in rodents fed diets containing fish oils or fish oil concentrates containing CA(Reference Dolphin, Amy and Koeslag18–Reference Yang, Bando and Sakurai22). We recently presented evidence that the lower total cholesterol concentration in Zucker Diabetic Sprague Dawley rats fed herring oil was a result of upregulated faecal excretion of bile acids, without affecting the cholesterol production in the liver, the hepatic de novo lipogenesis, the secretion of VLDL, or the liver’s capacity to take up cholesterol from the circulation(Reference Rimmen, Mjos and Softeland23). When testing a CA concentrate in non-diabetic obese Zucker fa/fa rats, we found lower serum concentrations of both total cholesterol and LDL-cholesterol, and we proposed that this was a result of down-regulation of VLDL secretion in response to lower lipogenesis(Reference Oldernes, Hansen and Mjos24). In rats, the main cholesterol transporter is HDL, whereas LDL is the main cholesterol transporter in humans; therefore, an LDL-cholesterol-lowering effect mediated by CA through down-regulation of lipogenesis and VLDL secretion may have an even more pronounced effect in humans than in rats.
Low-grade inflammation is another important factor in the development of obesity-related co-morbidities including insulin resistance and CVD(Reference Festa, D’Agostino and Williams25–Reference Willerson and Ridker27). During inflammation, leucocytes release pro-inflammatory mediators such as cytokines and PGE2 to further activate the immune system. Ideally, the inflammatory process ends when the infection or injury is healed, but it may become a chronic condition if the inflammatory process continues or occurs at sites with no damage. Dietary and endogenously synthesised fatty acids can be incorporated into the leucocyte membrane, thereby altering its membrane properties such as fluidity, which subsequently affects cell signalling pathways, gene expressions and phagocytosis capacity, and may also affect the production of cytokines and pro- and anti-inflammatory eicosanoids, which are involved in the regulation of immune responses(Reference Calder28). An inverse relationship between lower concentrations of circulating inflammatory markers and consumption of fish or fish oils has been indicated in several studies(Reference Zampelas, Panagiotakos and Pitsavos29–Reference Lopez-Garcia, Schulze and Manson33). The n-3 PUFAs EPA and DHA are precursors for anti-inflammatory compounds such as PGs, leukotrienes and resolvins, and these n-3 PUFAs may replace arachidonic acid, which is a precursor for pro-inflammatory eicosanoids, in membranes(Reference Flock, Rogers and Prabhu34). The anti-inflammatory effect of fish intake is often ascribed to the marine n-3 PUFAs; however, we recently presented evidence that a CA concentrate resulted in lower concentrations of the inflammatory markers TNFα, matrix metalloproteinase-3, IL6 and monocyte chemotactic protein 1 in white adipose tissue when fed to obese Zucker fa/fa rats(Reference Hansen, Mjos and Softeland35). In the same study, we showed that CA was incorporated in blood cells(Reference Hansen, Mjos and Softeland35).
The main objective of the present study was to investigate the effect of a CA concentrate (CECO) supplementation on LDL-cholesterol concentration in non-diabetic adults with overweight or obesity. The secondary objectives were to investigate any effects of CECO supplementation on serum concentrations of total cholesterol and HDL-cholesterol, circulating PGs, body weight and body fat percentage, and to examine whether CA and other fatty acids such as EPA and DHA present in the supplements were incorporated in the leucocyte membrane and influenced the fatty acid composition. Our hypothesis was that daily supplementation with CECO would result in a decrease in the serum LDL-cholesterol concentration in non-diabetic adults with overweight or obesity. To investigate this, participants were given capsules containing either CECO or soyabean oil mixed with an n-3 PUFA concentrate without CA, with a comparable EPA content in both capsule types.
Methods
Participants, study setting and ethics
The study population consisted of adults with overweight or obesity. Participants were recruited through posters in grocery stores and university faculties in Bergen, Norway, and through digital advertising on social media using Facebook and Instagram, in the period from May to September 2024. Interested participants signed up on a registration online form and were contacted by phone by one of the staff members for detailed information of the study, and a brief interview was conducted to gather information regarding health, use of medication and nutrition supplements and general fish intake. For participants included in the study, information about the study visits and procedures was provided, and the date for the baseline visit was scheduled.
Inclusion criteria were age 20–65 years, BMI ≥ 25 kg/m2, having a stable body weight (< 3 kg weight difference over the previous 3 months), fasting blood glucose ≤ 7·0 mmol/l and being willing to not consume fish or seafood during the study period. Exclusion criteria were living outside Bergen, having allergies against fish, eggs, milk or gluten, regular consumption of fish/seafood or use of n-3 PUFA supplements, daily use of cigarettes, being pregnant or breast-feeding, having a disease affecting the heart, insulin secretion, intestinal function or kidney function, having undergone bariatric surgery or other recently or planned surgical procedures, use of medications affecting lipid, glucose or cholesterol metabolism or using medications for weight loss.
The study was designed as an 8-week double-blind, randomised controlled trial with a parallel group design, comprising one intervention group (the CECO group) and one control group (soyabean oil mixed with an n-3 PUFA concentrate; the SOYO3 group). A total of eighty participants were enrolled in the study: forty-three females and thirty-seven males. The participants were stratified by sex at the baseline visit, before they drew paper lots from a jar to be randomly assigned to the intervention group (n 40) or to the control group (n 40). The participants were given random numbers that could not be linked to the experimental groups or to the participants’ identity, and only the principal investigator had access to the allocation key. The study visits were conducted at Haukeland University Hospital, Bergen, Norway.
The study was conducted according to the guidelines laid down in the Declaration of Helsinki, and all procedures were approved by the Regional Committee for Medical and Health Research Ethics of Western Norway (REC no. 697716). This trial was registered at clinicaltrials.gov as NCT06364163.
Written informed consent was obtained from all participants. Health professionals performing blood sampling and measuring body composition and height, and personnel conducting the laboratory analyses, were all blinded to the participants’ identity and group allocation. All data were analysed anonymously.
To enhance compliance, the participants were contacted by phone 1 week after the baseline visit. In this conversation, the participants were asked if they had experienced any challenges in following the protocol and they were invited to ask any questions related to the study. One week before the last visit, an email was sent to the participants to remind them of the upcoming visit, and the registration form for food intake for the last 5 d of the intervention was enclosed. A text message was sent 1–3 d before the endpoint visit, as a reminder of how to prepare for the upcoming visit, including being in a fasting state and not taking any test capsules in the morning before the visit. For any inquires during the trial period, the members of the research group could be reached by email or telephone. Participants were encouraged to contact the research group if they experienced any side effects of the fish oil capsules. Compliance was monitored through interviews; at the last visit, the participants were asked how many doses they had not taken since last contact, instead of asking how well they had complied, to lower the bar for reporting missing intake of test capsules. As a reward for completing the study, the participants were offered a dietary consultation with a student dietician at the last visit and the results from the analyses of their blood samples. The participants that completed the study visits received a 1000 NOK gift card to cover transportation costs.
Interventions
The participants ingested 4 g of oil from the study capsules per day. The CECO capsules contained a CA concentrate prepared from oil extracted from herring residuals, sourced from herring caught in the North Sea by Pelagia AS. The production of CECO was conducted by Epax Norway AS and followed a standard industrial process where the fatty acids in the herring oil were transesterified to ethyl esters and distilled to separate the fatty acids, and the ethyl esters were enzymatically re-esterified to triacylglycerols using glycerol. The production process included multiple purification steps to remove unwanted compounds, such as environmental contaminants. To increase the CA content, SFAs were partially removed from the oil. The SOYO3 capsules contained a refined soyabean oil (soyabean oil refined IP 8001-22-7, Mosselman) with an additional 11·5 % n-3 PUFA concentrate derived from anchovy oil (EPAX 6015 TGN) to balance the amount of n-3 PUFAs naturally occurring in the CA concentrate. The two arms had comparable contents of EPA, docosapentaenoic acid (C22:5n-3, DPA) and DHA. Both capsule types contained tocopherol: 2·4 mg/g in the CECO capsules and 2·5 mg/g in the SOYO3 capsules. The CECO and SOYO3 supplements were encapsulated by NextPharma. The CECO and SOYO3 capsules were identical in size, shape and colour and were packed in containers that were identical, airtight and lightproof. The capsule boxes were coded by the manufacturer, and group allocation was blinded for all participants, health personnel and project members, and were labelled with instructions for the participants.
The participants were instructed to take two capsules before lunch and two capsules after dinner, and it was advised to take the capsules together with water. Participants were instructed to avoid all types of fish and fish topping, seafood and supplements of n-3 PUFAs during the study period. Additionally, participants were requested to avoid dietary supplements such as multivitamins on the condition that they did not have a prescription due to any severe deficiencies. Apart from that, participants were told to continue with their normal eating habits.
Protocol for study visits
The total study period was 8 weeks, with study visits at the baseline and after 8 weeks (endpoint) at Haukeland University Hospital, Bergen, Norway. Examinations were conducted in the morning after an overnight fast. The participants were instructed not to eat or drink anything except water and not use substances containing nicotine after 10 PM the previous day and to avoid strenuous physical exercise and alcohol for 24 h before each sampling day. Instructions for the visits, including the schedule and procedures for the upcoming visit, were provided via email 1 week before each visit, and a reminder text message was sent the day before each visit.
The baseline visits were conducted between 19 August 2024 and 3 October 2024. At the first visit, the study personnel provided information about the study and interviewed the participants about their general health including allergies, nicotine use and any use of medications and dietary supplements, and the participants signed the consent form. Blood glucose was measured with the Contour XT blood glucose meter (Bayer) and Contour blood glucose test strips (Bayer) to determine inclusion eligibility (fasting blood glucose ≤ 7·0 mmol/l), before the participants were randomly assigned to one of the groups. The participants received their box of capsules and were instructed to start taking the capsules the same day.
Body height was measured at baseline using a mechanical body length measuring tape (ADEMZ10017). Body weight and body fat percentage were measured in fasting state at baseline and endpoint visits using bioelectrical impedance analysis device (Tanita MC-780MA-N). The manufacturer’s guidelines for use were followed, and participants were weighed barefoot, wearing light clothing, before blood sampling.
Blood samples were collected at the baseline and the endpoint visits in a fasting state. Blood was drawn from an antecubital vein via venepuncture and collected in BD Vacutainer SST II Advance gel tubes (Becton, Dickinson and Company) for isolation of serum and in Vacuette K2E K2EDTA (Greiner Bio-One) for isolation of plasma. Serum and plasma were immediately aliquoted after centrifugation and were stored at −80°C until analyses. Blood was collected in a Vacuette LH Lithium Heparin tube (Greiner Bio-One) for isolation of the blood cell fraction before collection of leucocytes, described in detail below.
Estimation of energy and macronutrient intakes from dietary records
The participants completed dietary records of the five preceding days before the baseline and the five preceding days before the 8-week visit, including at least one weekend day in each period. The intakes of energy, fats, proteins and carbohydrates were calculated from the participants’ dietary records using Kostholdsplanleggeren, an online website containing nutritional information of food available in Norway, developed by the Norwegian Directorate of Health and the Norwegian Food Safety Authority based on food data in Matvaretabellen(36,37) . Dietary records were thoroughly checked for completeness during the baseline and endpoint visits. The total energy and macronutrient contents were entered manually if participants reported food items that were not listed in the database. The contributions of energy and fat from the capsules were included in the calculations for energy and total fat for the five preceding days before the 8-week visit.
Serum analyses
Serum concentrations of total cholesterol, LDL-cholesterol and HDL-cholesterol were measured on the Cobas c111 system (Roche Diagnostics), using the CHOL2 (Cholesterol Gen.2), LDLC3 (LDL-Cholesterol Gen.3) and HDLC4 (HDL-Cholesterol Gen.4) kits from Roche Diagnostics (Roche Diagnostics GmbH).
Leucocyte isolation
Leucocytes were isolated essentially as described in Lehmann et al. (Reference Lehmann, Halstensen and Holst38). Four millilitres of heparinised venous blood were mixed with 36 ml of lysis buffer (8 g NH4Cl/l, 0·8 g NaHCO3/l and 0·88 g EDTA/l), and the tube was inverted three times to ensure thorough mixing of the blood and the lysis buffer. The tube was left to stand at RT for 15 min until erythrocytes were lysed. The tube was centrifuged at 500 g for 5 min, resulting in a clear white leucocyte pellet at the bottom of the tube. The supernatant was removed, and the pellet was washed twice with 0·5 ml of PBS. Before freezing (–80°C), 0·5 ml of PBS was added to the pellet for storage until further analysis.
Analyses of fatty acid composition in capsules and leucocytes
Samples of oils from capsules and leucocytes were added to heneicosanoic acid (C21:0) as an internal standard and were methylated without prior extraction of lipids, as described previously(Reference Meier, Mjos and Joensen39). The methyl ester samples were quantified using an Agilent 7890 gas chromatograph equipped with a flame ionisation detector (Agilent Technologies, Inc.) and a BPX-70 capillary column (SGE Analytical Science) as described in Sciotto & Mjøs(Reference Sciotto and Mjos40) with minor adjustments of the temperature programme to provide baseline resolution between n-9 and n-11 monoenoic isomers. To ensure accurate quantitative amounts, chromatographic areas were adjusted with empirical response factors based on the GLC-793 reference mixture (Nu-Chek Prep). The samples were run in randomised order, and a reference mixture was run as every eighth sample (or more often) in the chromatographic sequences. The compounds were identified by GC-MS using the methodology described in Wasta and Mjøs(Reference Wasta and Mjos41). The level of quantification was at 2 mg/g oil in the capsules and 0·05 g/100 fatty acids in the leucocytes.
Circulating PG
PGE2 was measured in serum using the Human PGE2 Prostaglandin E2 ELISA Kit, cat. no. EKX-YKQ9VD (Nordic Biosite). PGE3 was measured in plasma using the Human Prostaglandin E3 (PGE3) ELISA Kit, cat. no. MBS2612227 (MyBioSource Inc.). Plates were read at Multiscan FC (Thermo Scientific), with both samples from each of the participants on the same plate for each of the ELISA assays, with CV < 5 %.
Outcome measurements
The primary outcome of the present study was to investigate if intake of CA would affect the serum LDL-cholesterol concentration. Secondary outcomes were to investigate any effects of CA intake on serum concentrations of total cholesterol and HDL-cholesterol, the fatty acid composition of leucocyte membrane, circulating PGs, body weight and body fat percentage.
Sample size calculation
This is the first study to test a CA concetrate in humans, but two clinical trials(Reference Yang, Amar and Sorokin42,Reference Tsutsumi, Yamasaki and Takeo43) have investigated the effects of saury oil, which is rich in CA, in healthy humans. However, the designs of these studies were different from the present study. The study by Yang et al. (Reference Yang, Amar and Sorokin42) was a crossover study with thirty participants with a mean age of 34·8 (SD 12·5) years and BMI < 25 kg/m2, taking capsules corresponding to a daily dose of 1·85 g CA per day from saury oil for 8 weeks. In the study by Tsutsumi et al. (Reference Tsutsumi, Yamasaki and Takeo43), fifty participants received capsules with either saury oil or placebo, the age range was 20–23 years, the mean BMI was 21·8 (SD 3·1) kg/m2 and the daily dose of CA was 0·648 g/d from saury oil for 4 weeks. Neither Yang et al. (Reference Yang, Amar and Sorokin42) nor Tsutsumi et al. (Reference Tsutsumi, Yamasaki and Takeo43) reported an LDL-cholesterol-lowering effect of saury oil supplementation. The present study was designed with 1·48 g CA per day for 8 weeks, and participants were adults with BMI ≥ 25 kg/m2, with the main aim to investigate any changes in serum LDL-cholesterol concentration. In a recent study, we demonstrated that when obese rats were fed a diet containing a CA concentrate, this resulted in a lower serum LDL-cholesterol concentration compared with a control group fed a soyabean oil-based diet(Reference Oldernes, Hansen and Mjos24). Since no data on effect size were available for sample size calculation or minimally detectable effect sizes for a population with overweight or obesity, we based our sample size estimate on the clinical trials using saury oil(Reference Yang, Amar and Sorokin42,Reference Tsutsumi, Yamasaki and Takeo43) and our recent rat study using a CA concentrate(Reference Oldernes, Hansen and Mjos24). Based on previous experience(Reference Hagen, Helland and Bratlie44–Reference Hovland, Leikanger and Stokkeland46), the drop-out rate was expected to be below 10 %, and we estimated that the sample size required was eighty participants.
Statistical analyses
Statistical analyses were conducted using SPSS Statistics 29 (SPSS, Inc., IBM Company). Subjects who did not complete the study or were excluded due to non-compliance were not included in the statistical analyses. The data from biochemical analyses, anthropometric data and the estimated energy and macronutrient intake from dietary records were not normally distributed according to the Shapiro–Wilk test, therefore, the non-parametric Mann–Whitney U test was used to compare baseline values between the groups and the Wilcoxon signed-rank test was used to investigate changes within groups. The within-group changes in serum concentrations of LDL-cholesterol, total cholesterol and HDL-cholesterol were compared between groups using ANCOVA, with the change in body fat percent as covariate. Data were tested for between-subjects effects between the dependent variable and the covariate, and data were analysed for homogeneity of variance (Levene’s test). Categorical data were compared using Pearson’s χ2 test. All comparisons were two-sided, and P < 0·05 was considered statistically significant.
Results
Participant characteristics
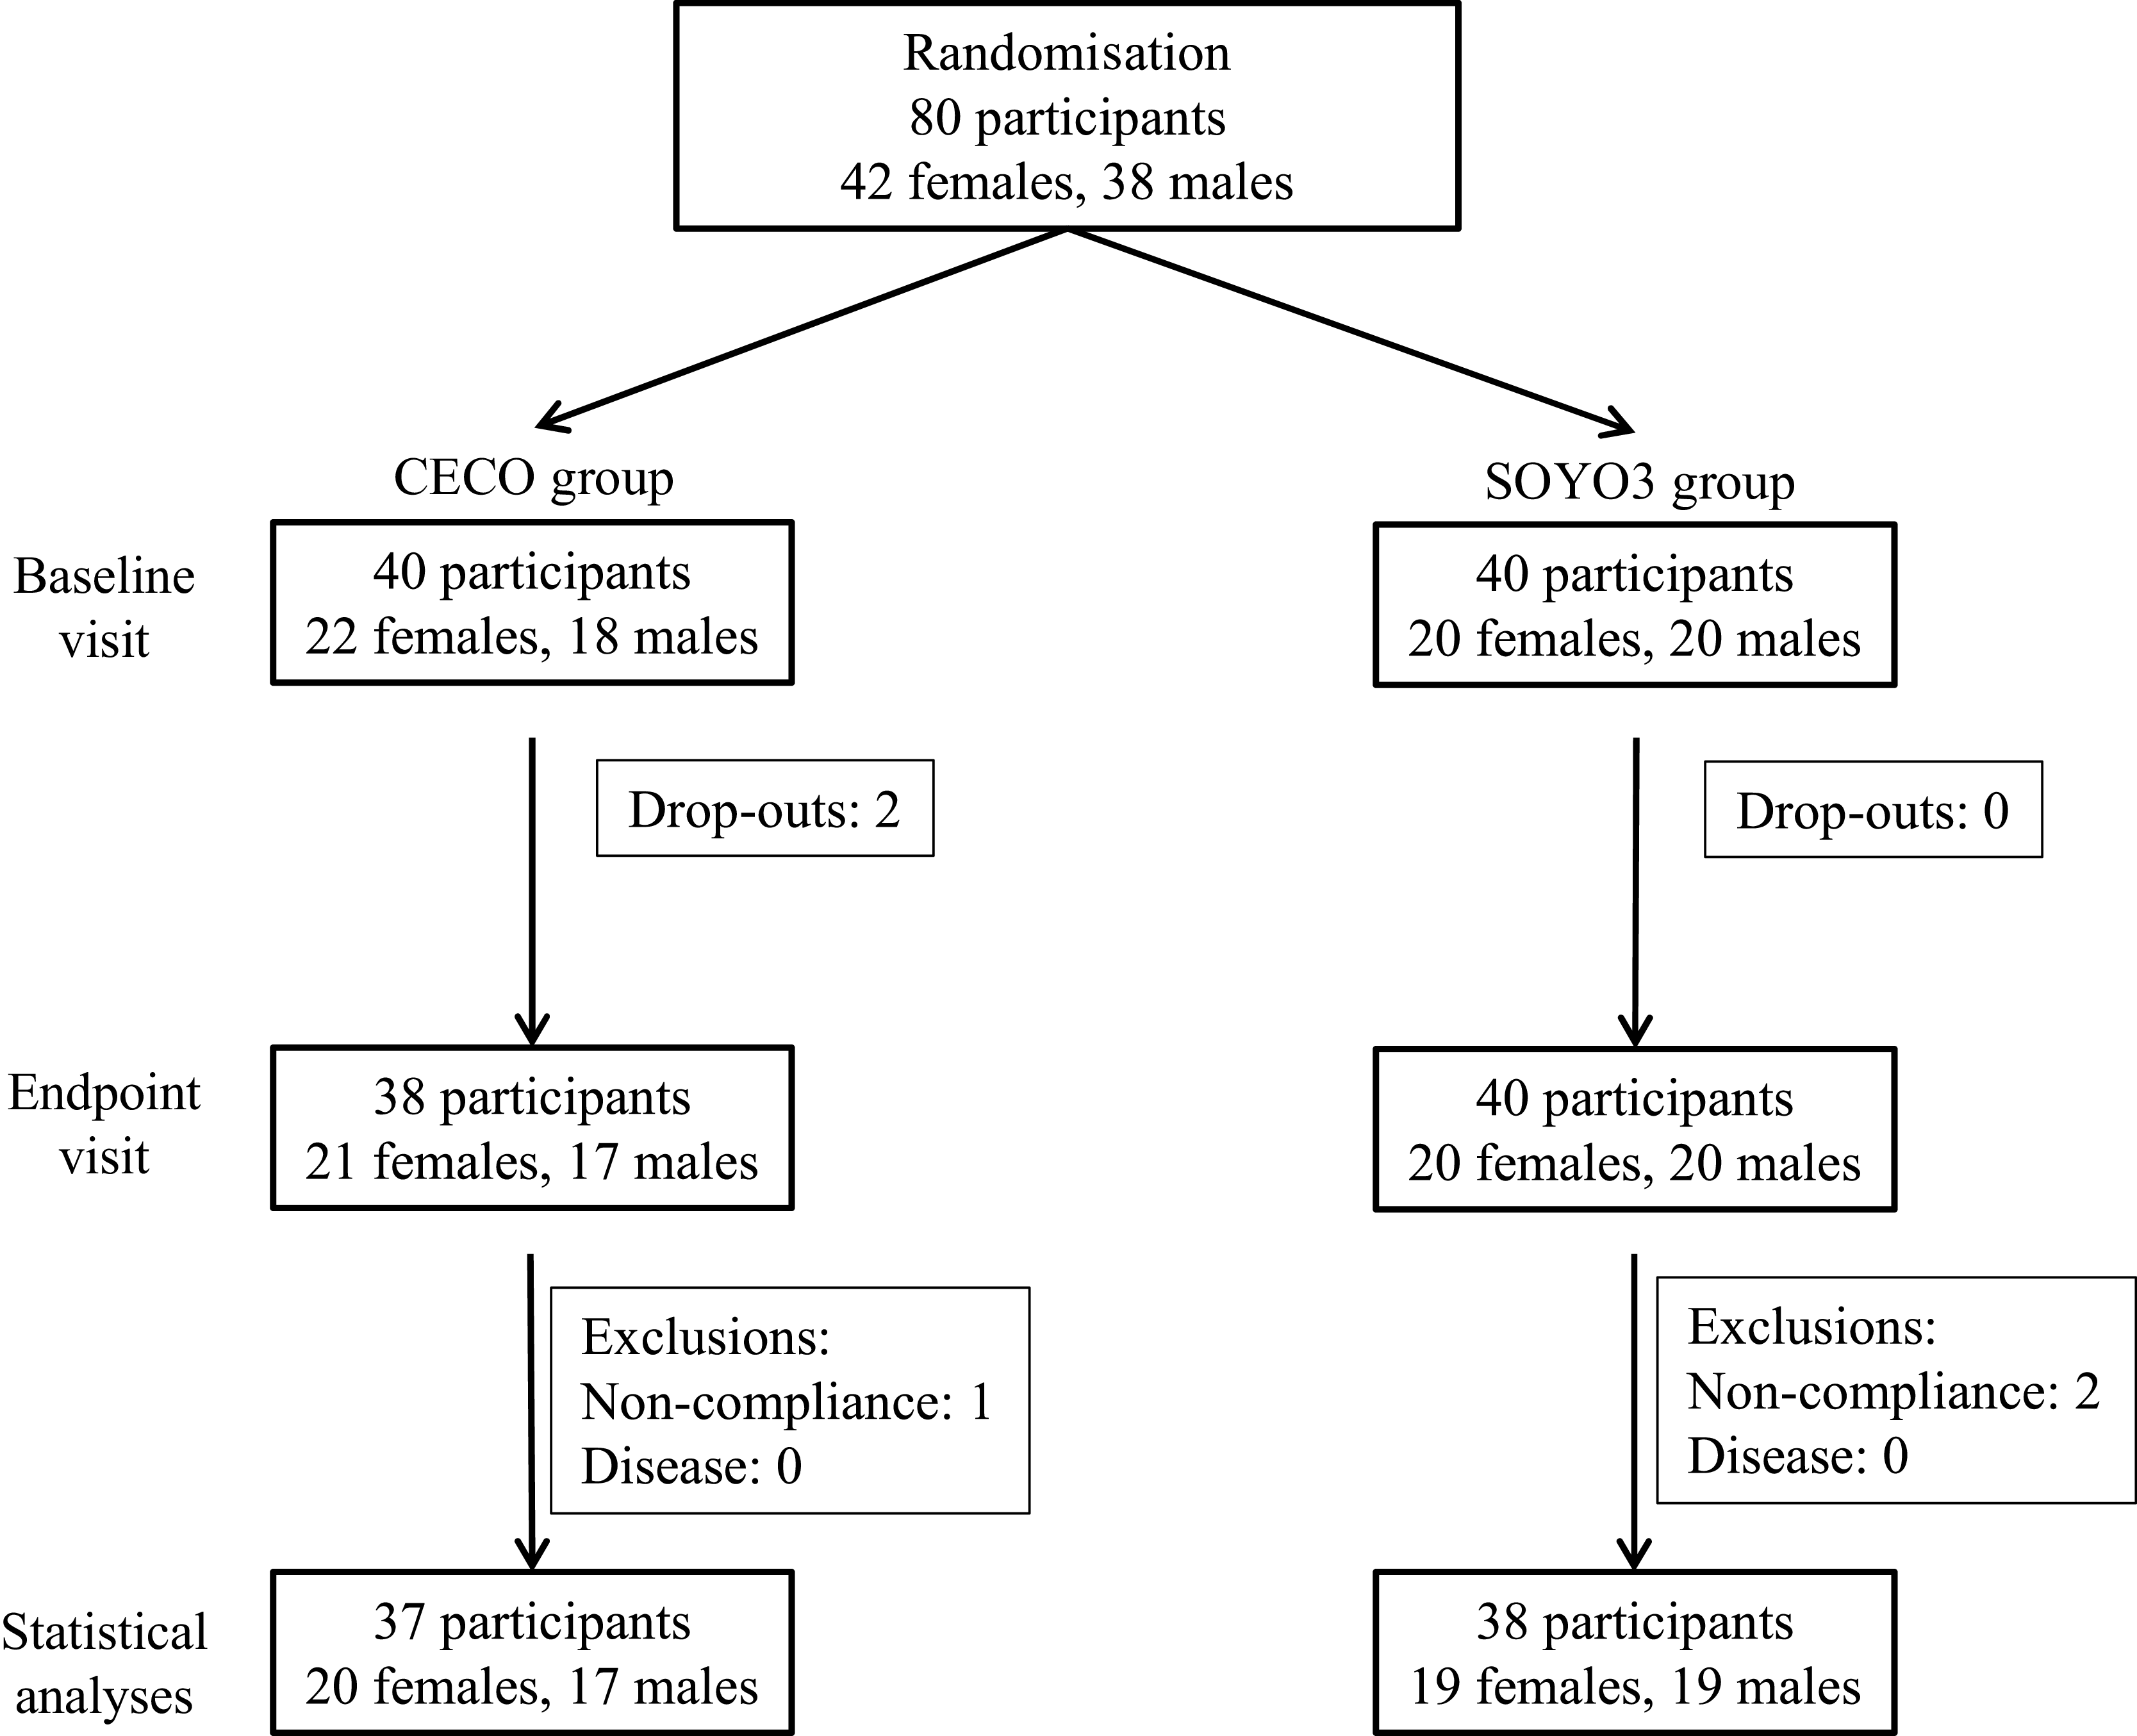
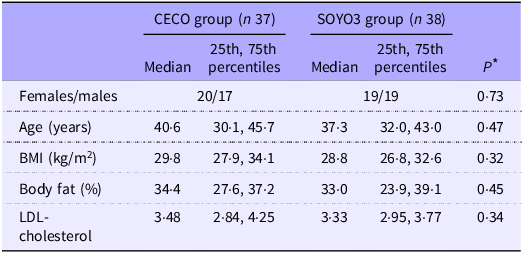
Eighty participants were included in the study and completed the first study visit. Of these, seventy-eight participants completed the trial. Figure 1 shows the flow of participants through the study. Two participants (one female and one male, both in the CECO group) withdrew from the study for personal reasons unrelated to the study protocol. Three participants were excluded from analyses because they did not comply with the protocol: one female in the CECO group did not complete the second 5-d registration of food intake, one male in the SOYO3 group commenced a cholesterol-lowering drug regimen after the first visit and one female in the SOYO3 group disclosed that she had been using medications affecting lipid metabolism before the first visit and during the intervention period. In total, seventy-five participants; thirty-seven in the CECO group and thirty-eight in the SOYO3 group (thirty-nine females and thirty-six males) were included in the statistical analyses. All participants had overweight or obesity (median BMI 29·5 (quartiles 27·5, 33·4) kg/m2), and the median age was 39·2 (quartiles 30·3, 45·3) years. Groups had similar serum LDL-cholesterol concentration at baseline. The baseline characteristics for the groups are presented in Table 1. The CECO and the SOYO3 groups were comparable with regard to sex distribution, age, BMI and percentage of body fat at baseline. After 8 weeks, no differences were seen between the groups for any changes in BMI and percentage body fat (data not presented). A change of more than 1 % body fat was experienced by twenty-seven participants; nine participants (four participants in the CECO group) lost more than 1 % body fat and eighteen participants (ten participants in the CECO group) gained more than 1 % body fat, with no difference between the groups (P = 0·69, Pearson’s χ2 test). No adverse effects were reported in the CECO and the SOYO3 groups.
Study overview of participants. Participants not complying with the protocol were not included in the statistical analyses. Non-compliance was defined as not following the protocol in regard to taking the capsules as instructed and completing two 5-d registrations of food intake, or newly diagnosed diseases and/or use of prescription medicines that are not compatible with the inclusion criteria. CECO, cetoleic acid concentrate; SOYO3, soyabean oil mixed with an n-3 PUFA concentrate.

Figure 1. Long description
The flowchart begins with the randomization of 80 participants, consisting of 42 females and 38 males. These participants are divided into two groups: the CECO group and the SOYO3 group. Each group initially has 40 participants. The CECO group consists of 22 females and 18 males, while the SOYO3 group consists of 20 females and 20 males. After the baseline visit, there are 2 dropouts in the CECO group, leaving 38 participants (21 females and 17 males). The SOYO3 group has no dropouts, maintaining 40 participants (20 females and 20 males). After the endpoint visit, the CECO group has 1 exclusion due to non-compliance, resulting in 37 participants (20 females and 17 males) for statistical analyses. The SOYO3 group has 2 exclusions due to non-compliance, resulting in 38 participants (19 females and 19 males) for statistical analyses. The flowchart visually represents the progression and attrition of participants through the study phases.
Participant characteristics at baseline

Table 1. Long description
The table presents baseline characteristics of participants in the CECO and SOYO3 groups. It includes data on sex distribution, age, body mass index (BMI), body fat percentage, and LDL-cholesterol concentration. The CECO group consists of 37 participants (20 females and 17 males), while the SOYO3 group consists of 38 participants (19 females and 19 males). The median age for the CECO group is 40.6 years, with a range of 30.1 to 45.7 years, and for the SOYO3 group, it is 37.3 years, with 25th, 75th percentiles of 32.0 to 43.0 years. The median BMI for the CECO group is 29.8 kilograms per square meter, with 25th, 75th percentiles 27.9 to 34.1 kilograms per square meter, while the SOYO3 group has a median BMI of 28.8 kilograms per square meter, with 25th, 75th percentiles 26.8 to 32.6 kilograms per square meter. The median body fat percentage for the CECO group is 34.4 percent, with 25th, 75th percentiles 27.6 to 37.2 percent, and for the SOYO3 group, it is 33.0 percent, with 25th, 75th percentiles 23.9 to 39.1 percent. The median LDL-cholesterol level for the CECO group is 3.48 millimoles per liter, with 25th, 75th percentiles 2.84 to 4.25 millimoles per liter, while the SOYO3 group has a median LDL-cholesterol level of 3.33 millimoles per liter, with 25th, 75th percentiles 2.95 to 3.77 millimoles per liter. The table highlights that the groups are comparable in terms of sex distribution, age, BMI, and body fat percentage at baseline.
CECO, cetoleic acid concentrate; SOYO3, soyabean oil mixed with an n-3 PUFA concentrate.
* Groups were compared using Pearson’s χ2 (categorical data) or the Kruskal–Wallis test (continuous data).
Daily intake of fatty acids from the capsules
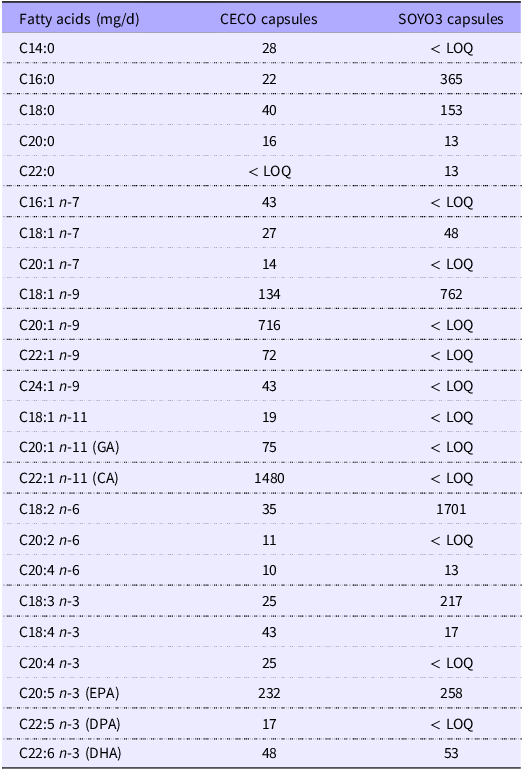
CA and the two shorter n-11 MUFAs gadoleic acid (GA, C20:1n-11) and 7-octadecenoic acid (7OA, C18:1 n-11) were found solely in the CECO capsules, and the daily intake of these fatty acids from the CECO capsules was 1480, 75 and 19 mg, respectively (Table 2). Gondoic acid (C20:1n-9) and erucic acid (C22:1n-9) were also found only in the CECO capsules. EPA and DHA were detected in both capsule types. The daily intake of EPA was 232 mg in the CECO group and 258 mg in the SOYO3 group, and the daily intake of DHA was 48 mg in the CECO group and 53 mg in the SOYO3 group. Two other n-3 PUFAs, that is, C20:4n-3 and DPA, were detected only in the CECO capsules. The higher contents of palmitic acid (C16:0), stearic acid (C18:0), oleic acid (C18:1n-9) and the essential fatty acids C18:2n-6 and C18:3n-3 in the SOYO3 capsules compared with the CECO capsules reflect the fatty acid composition of the soyabean oil in the SOYO3 capsules.
The daily intake of fatty acids from CECO and SOYO3 capsules*
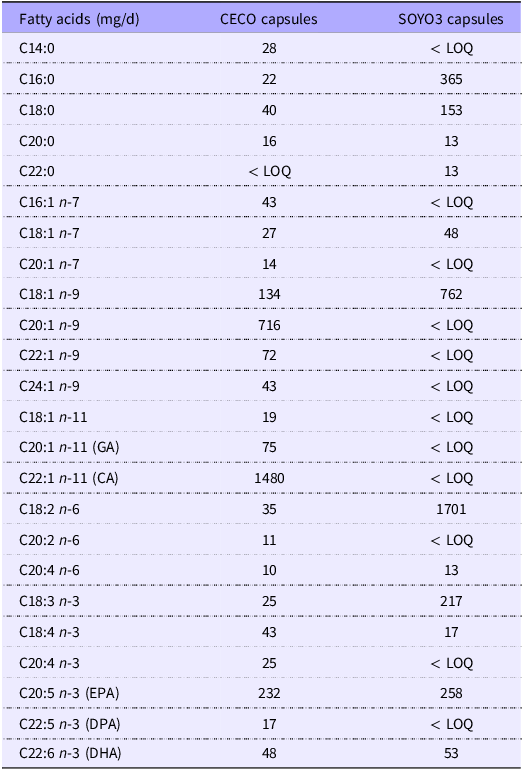
Table 2. Long description
The table presents the daily intake of different fatty acids from CECO and SOYO3 capsules. It includes data for 22 fatty acids, each identified by their chemical notation. The table has 22 rows and 3 columns, with the first column listing the fatty acids and the subsequent columns showing the intake in milligrams per day for CECO capsules and SOYO3 capsules. Notable trends include comparable intakes of EPA and DHA between the groups, and higher intakes of palmitic acid, stearic acid, oleic acid, and essential fatty acids in SOYO3 capsules compared to CECO capsules. Some fatty acids are only present in one type of capsule, such as C20:n-11 and C22:1 n-11 found solely in CECO capsules. The data highlights the differences in fatty acid composition between the two types of capsules.
CECO, cetoleic acid concentrate; SOYO3, soyabean oil mixed with n-3 PUFA concentrate; LOQ, level of quantification; GA, gadoleic acid; CA, cetoleic acid; DPA, docosapentaenoic acid.
The following fatty acids C12:0, C15:0, C17:0, C23:0, C24:0, C14:1 n-5, C16:1 n-5, C18:1 n-5, C17:1 n-7, C22:1 n-7, C17:1 n-8, C16:1 n-9, C18:3 n-6, C20:3 n-6, C22:5 n-6, C22:4 n-6, C16:2 n-4, C18:2 n-4, C16:3 n-4, C20:3 n-3 and C21:5 n-3 were < LOQ in both capsule types and were therefore not included in the table.
* Mean of three measurements, variation < 5 %.
Estimated dietary intake
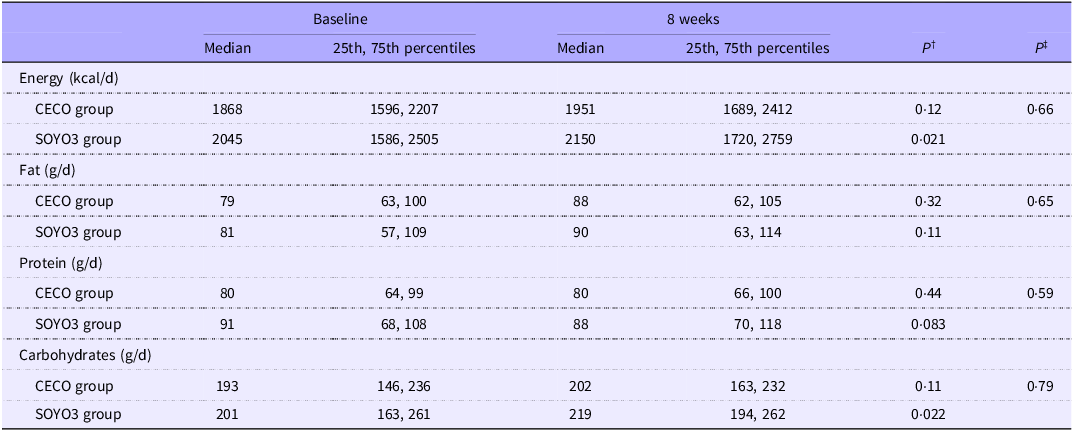
The median intakes of energy and macronutrients were estimated based on food records from the 5 d preceding the baseline visit and the endpoint visit. The estimated average intakes of energy, fats, proteins and carbohydrates were similar between the CECO and SOYO3 groups at baseline (Table 3). The estimated daily intakes of energy and macronutrients were similar at baseline and endpoint for the CECO group. The estimated energy and carbohydrate intakes increased from baseline to endpoint in the SOYO3 group; however, the within-group changes in estimated energy and macronutrient intake were similar between the groups.
Estimated daily dietary intake of energy and macronutrients (as percentage of energy intake) based on 5-d dietary records at baseline and after 8 weeks*

Table 3. Long description
The table presents data on the estimated daily dietary intake of energy and macronutrients for two groups, CECO and SOYO3, at baseline and after 8 weeks. It includes median values and 25th, 75th percentiles for energy intake in kilocalories per day, fat intake in grams per day, protein intake in grams per day, and carbohydrate intake in grams per day. The table includes P values demonstrating no statistical differences between the groups.
CECO, cetoleic acid concentrate; SOYO3, soyabean oil mixed with an n-3 PUFA concentrate.
Results are presented for thirty-seven participants in the CECO group and thirty-eight participants in the SOYO3 group.
* No differences were seen between the groups at the baseline (Mann–Whitney U test).
† Within-group changes are tested using Wilcoxon’s signed-rank test.
‡ Changes within the CECO and SOYO3 groups are compared using the Mann–Whitney U test.
Serum cholesterol
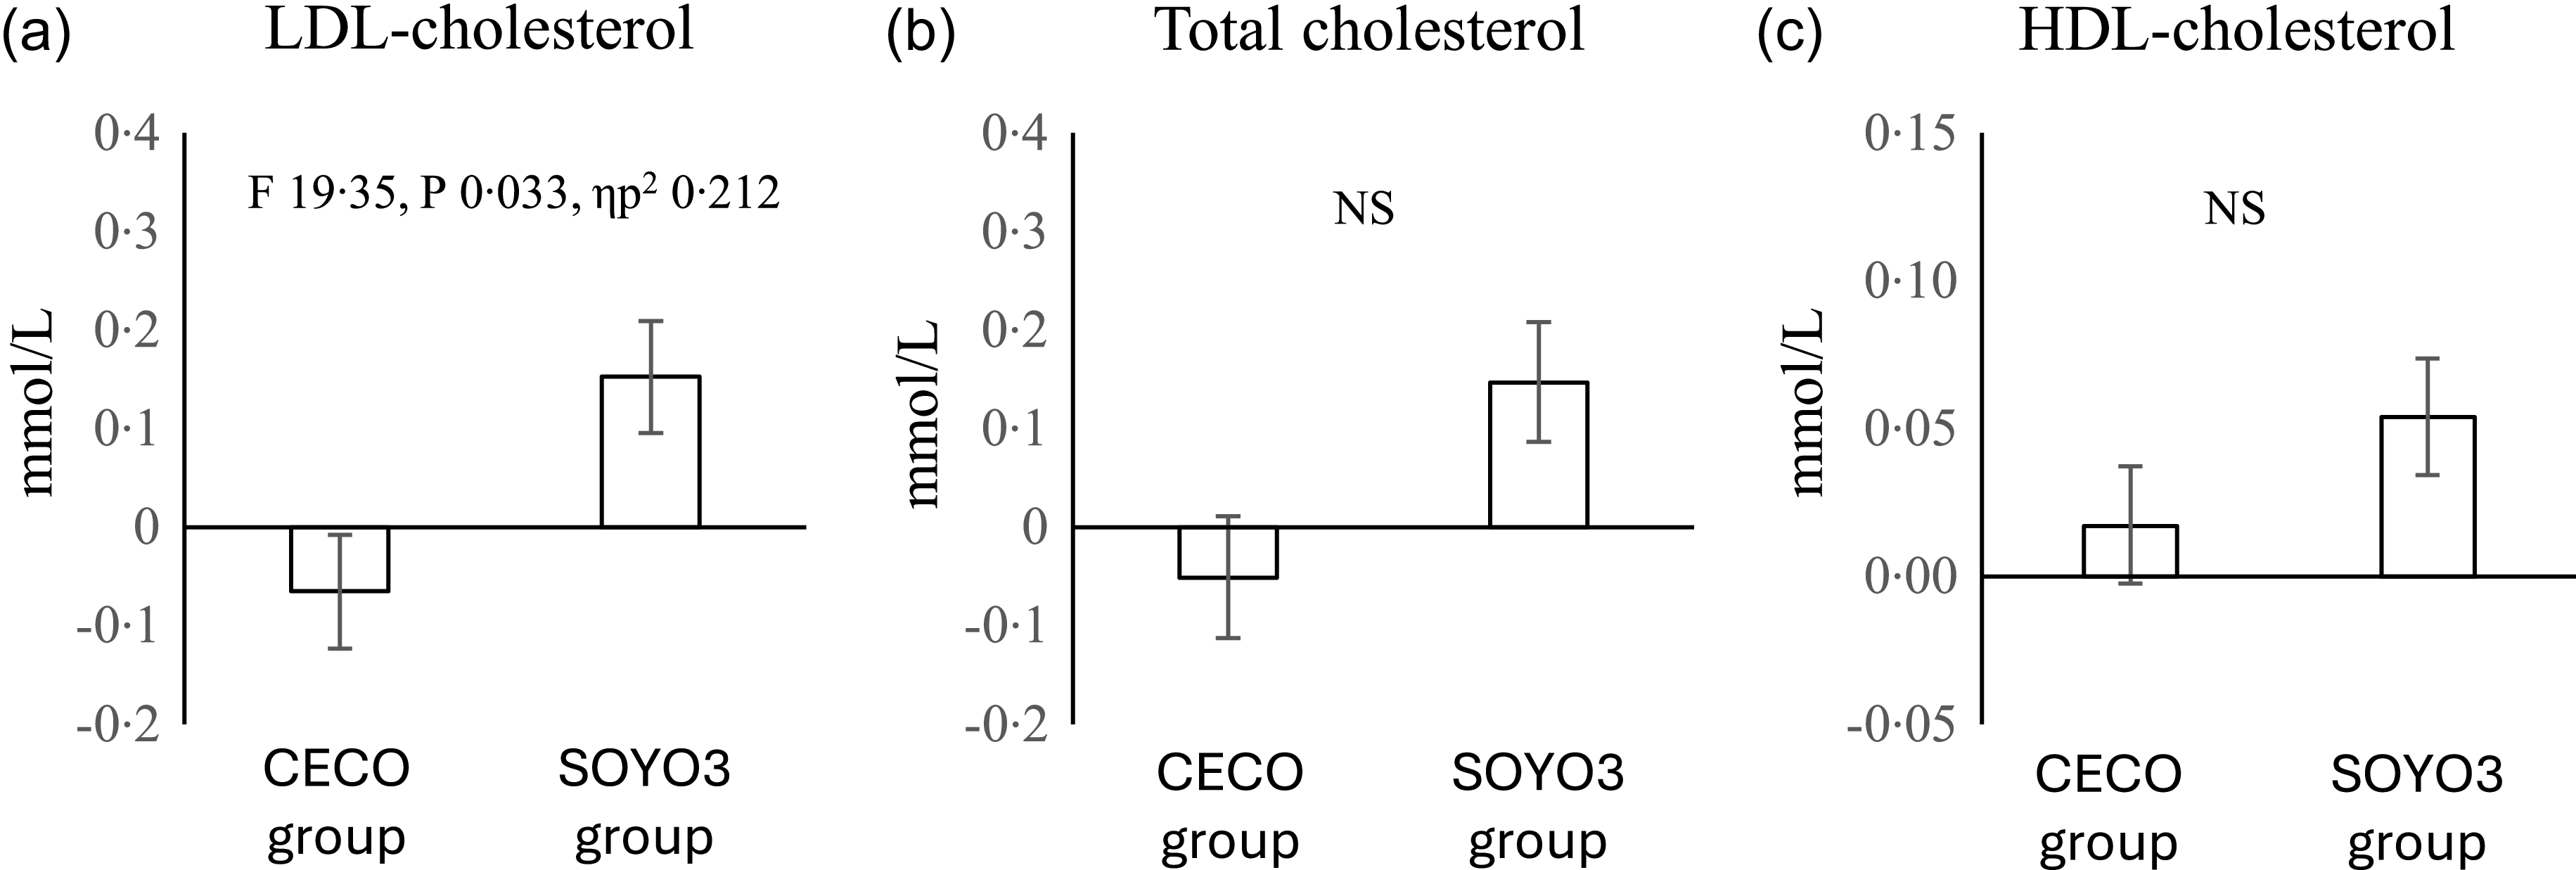
Serum concentrations of LDL-cholesterol and total cholesterol are positively associated with body fat percentage, whereas a negative association is reported for HDL-cholesterol and percentage of body fat(Reference Sun, Zhang and Liu5,Reference Oda47) . Therefore, the one-way ANCOVA analyses of the within-group changes in serum cholesterol concentrations were performed with the change in body fat percentage as covariate. The ANCOVA analysis showed that the LDL-cholesterol concentration was decreased from baseline to 8 weeks (endpoint) in the CECO group in comparison to the SOYO3 group (F 19·35, P 0·033, ηp2 0·212), presented in Figure 2(a), corresponding to a 7% reduction in the CECO group relative to the SOYO3 group. The comparison of within-group changes in the total cholesterol concentration showed a tendency to decrease in the CECO group compared with the SOYO3 group (F 14·67, P 0·069, ηp2 0·169, Figure 2(b)), whereas the HDL-cholesterol concentration was not affected (F 0·017, P 0·30, ηp2 0·0002, Figure 2(c)) after adjustments for body fat percentage as covariate.
Serum concentrations of LDL-cholesterol (a), total cholesterol (b) and HDL-cholesterol (c). Data are presented as medians and 25th and 75th percentiles for thirty-seven participants in the CECO group and thirty-eight participants in the SOYO3 group. Within-group changes are compared using one-way ANCOVA analyses with change in body fat percent as covariate. P < 0·05 was considered statistically significant. CECO, cetoleic acid concentrate; SOYO3, soyabean oil mixed with an n-3 PUFA concentrate.
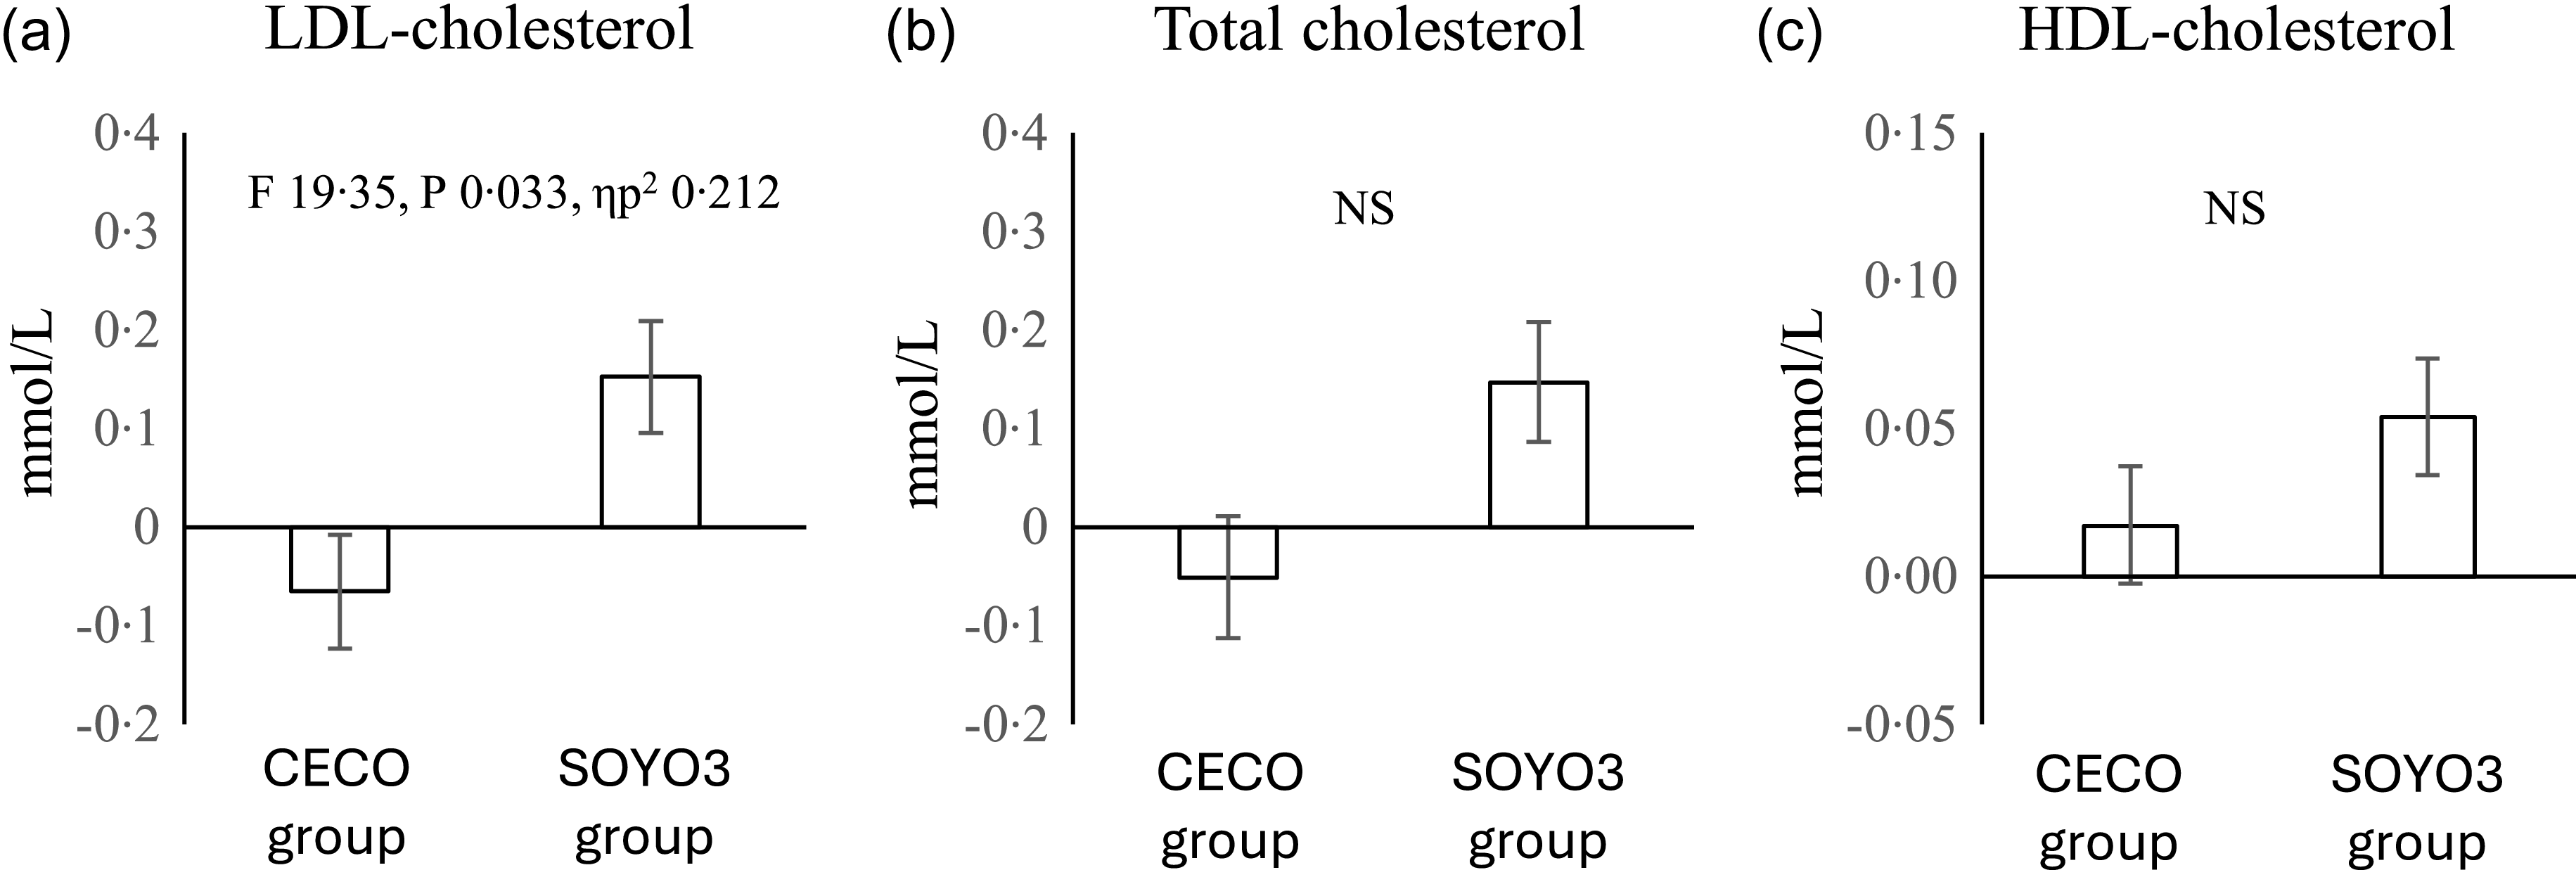
Figure 2. Long description
The image contains three bar graphs comparing serum concentrations of LDL-cholesterol, total cholesterol, and HDL-cholesterol between two groups: CECO and SOYO3. Each graph presents data as medians with 25th and 75th percentiles for thirty-seven participants in the CECO group and thirty-eight participants in the SOYO3 group. The first graph (a) shows LDL-cholesterol concentrations, with the CECO group exhibiting a lower median value compared to the SOYO3 group. The second graph (b) displays total cholesterol concentrations, where both groups show similar median values, indicating no significant difference. The third graph (c) illustrates HDL-cholesterol concentrations, where both groups show similar median values, indicating no significant difference. The graphs use one-way ANCOVA analyses with changes in body fat percent as a covariate, and a P value of less than 0.05 is considered statistically significant. The CECO group is treated with cetoleic acid concentrate, while the SOYO3 group is treated with soyabean oil mixed with an n-3 PUFA concentrate.
Leucocyte fatty acid composition
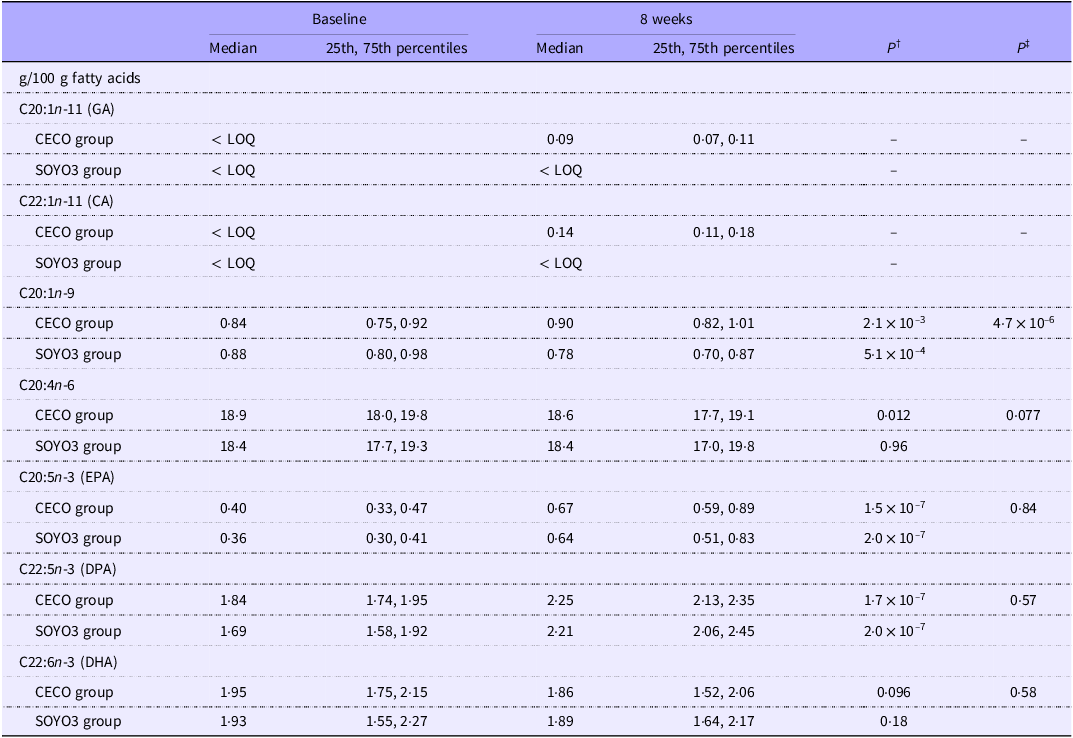
CA from the CECO capsules and the two carbon shorter n-11 MUFA GA were incorporated into leucocytes in the CECO group (Table 4 and online Supplementary Table). Neither CA nor GA was found in leucocytes collected at the baseline visit in any of the groups and were also not found in the endpoint samples from the SOYO3 group. 7OA was not detected in any of the leucocyte samples collected at baseline or endpoint. The relative content (g/100 g FA) of C20:1n-9 increased from the baseline value in the CECO group compared with the SOYO3 group, whereas the leucocyte contents of other measured MUFAs were not affected by the supplements. EPA and DPA contents in leukocytes were increased to a similar degree from baseline to 8 weeks in the CECO group and the SOYO3 group, whereas the amount of DHA was not affected in any of the groups. The linoleic acid (C18:2n-6) content was increased in the SOYO3 group, and this increase was significant when compared with the CECO group. The content of arachidonic acid (C20:4n-6) was reducedafter consuming the CECO capsules, but this decrease was not significant when compared with the SOYO3 group. The leucocyte contents of C22:4n-6 and C22:5n-6 were decreased in both CECO and SOYO3 groups, with no differences between the groups. The content of C16:0 was increased and that of C18:0 was decreased in the CECO group when compared with the SOYO3 group, with no difference between the groups for the other SFAs.
Contents of selected fatty acids in leucocytes at the baseline and after 8 weeks*
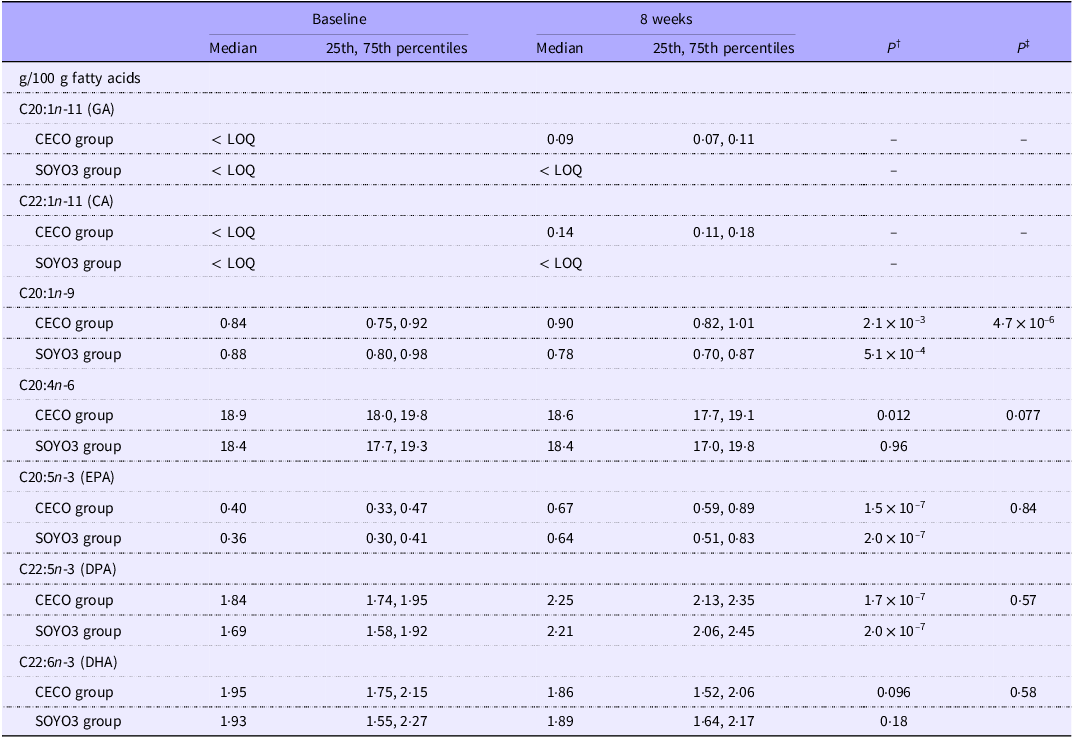
Table 4. Long description
The table presents the contents of selected fatty acids in leucocytes at baseline and after 8 weeks for two groups, CECO and SOYO3. It includes data for various fatty acids such as C20:1n-11 (GA), C22:1n-11 (CA), C20:1n-9, C20:4n-6, C20:5n-3 (EPA), C22:5n-3 (DPA), and C22:6n-3 (DHA). The table has 8 rows and 7 columns, with columns for median and 25th, 75th percentiles at baseline and 8 weeks, and P values for comparisons. Notable trends include similar increases in EPA and DPA in both groups. GA and CA were found only in leucocytes from participants in the CECO-group after 8 weeks. The content of arachidonic acid (C20:4n-6) decreased in the CECO group, though not significantly compared to the SOYO3 group. The contents of C22:4n-6 and C22:5n-6 decreased in both groups with no differences between them. The content of C16:0 increased and C18:0 decreased in the CECO group compared to the SOYO3 group. Units of measurement are grams per 100 grams of fatty acids.
CECO, cetoleic acid concentrate; SOYO3, soyabean oil mixed with an n-3 PUFA concentrate; LOQ, level of quantification; CA, cetoleic acid; GA, gadoleic acid; DPA, docosapentaenoic acid.
Results are presented for thirty-seven participants in the CECO group and thirty-eight participants in the SOYO3 group.
* No differences were seen between the groups at the baseline (Mann–Whitney U test).
† Within-group changes are tested using Wilcoxon’s signed-rank test.
‡ Changes within the CECO and SOYO3 groups are compared using the Mann–Whitney U test.
PG in circulation
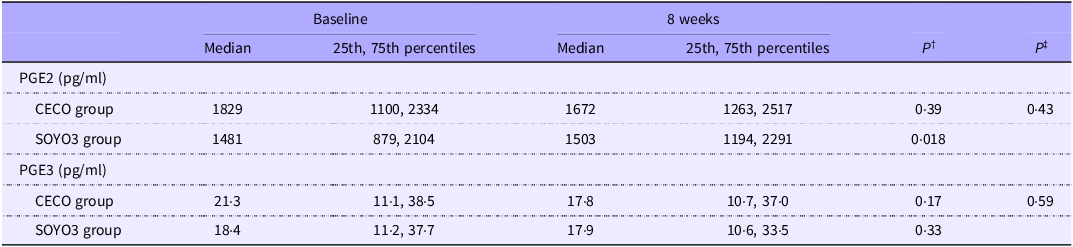
The circulating concentration of PGE2 was not affected in the CECO group (Table 5). The median circulating concentration of PGE2 was increased from baseline to endpoint in the SOYO3 group, but this did not reach statistical significance when compared with the CECO group. The PGE3 concentration was not affected in the CECO group or in the SOYO3 group.
Circulating concentrations of PGE2 and PGE3 at baseline and after 8 weeks*
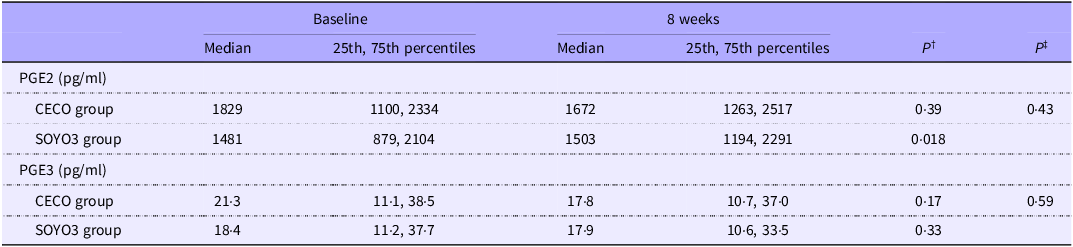
Table 5. Long description
The table presents data on the circulating concentrations of PGE2 and PGE3 at baseline and after 8 weeks for two groups, CECO and SOYO3. It includes median values and 25th and 75th percentiles for each group. For PGE2, the CECO group shows a median of 1829 picograms per milliliter at baseline and 1672 picograms per milliliter after 8 weeks. The SOYO3 group shows a median of 1481 picograms per milliliter at baseline and 1503 picograms per milliliter after 8 weeks. For PGE3, the CECO group shows a median of 21.3 picograms per milliliter at baseline and 17.8 picograms per milliliter after 8 weeks. The SOYO3 group shows a median of 18.4 picograms per milliliter at baseline and 17.9 picograms per milliliter after 8 weeks. The table also includes P values demonstrating no statistical differences between the groups.
CECO, cetoleic acid concentrate; SOYO3, soyabean oil mixed with an n-3 PUFA concentrate.
Results are presented for thirty-seven participants in the CECO group and thirty-eight participants in the SOYO3 group.
* No differences were seen between the groups at the baseline (Mann–Whitney U test).
† Within-group changes are tested using Wilcoxon’s signed-rank test.
‡ Changes within the CECO and SOYO3 groups are compared using the Mann–Whitney U test.
Discussion
Here, we demonstrate for the first time that supplementation with a CA concentrate decreased the LDL-cholesterol concentration in adults with overweight or obesity. The reduction in LDL-cholesterol concentration was not associated with changes in body fat percentage or in energy or macronutrient intake. We also show that CA from the CECO supplement was incorporated in the leucocyte membrane.
The decrease in LDL-cholesterol concentration in the CECO group was numerically small but statistically significant when compared with the SOYO3 group. When calculated relative to the SOYO3 group, the reduction in LDL-cholesterol concentration in the CECO group was 7 %, which is comparable to the 5 % reduction in LDL-cholesterol observed in hypercholesterolemic patients on a low-fat diet (25·8 E%) v. a high-fat diet (41·4 E%) for 9 weeks(Reference Hunninghake, Stein and Dujovne48). A 5–7 % decrease in LDL-cholesterol achieved via dietary modification is estimated to reduce the CHD risk by about 15 %(49), and the use of CECO supplementation may therefore be an enticing strategy to reduce the LDL-cholesterol concentration. In contrast to the present study, supplementation with saury oil, which has a high content of CA, did not affect the LDL-cholesterol concentration in two clinical trials in healthy adults(Reference Yang, Amar and Sorokin42,Reference Tsutsumi, Yamasaki and Takeo43) . The study designs of these clinical studies(Reference Yang, Amar and Sorokin42,Reference Tsutsumi, Yamasaki and Takeo43) differed from our trial as both studies used a young and normal-weight population, whereas our study participants had a median age of 39·2 (quartiles 30·3, 45·3) years and had overweight or obesity. A young normal-weight group of participants, as in the studies by Yang et al. (Reference Yang, Amar and Sorokin42) and Tsutsumi et al. (Reference Tsutsumi, Yamasaki and Takeo43), will likely have a much lower risk for disturbances in the lipid metabolism, whereas those with excess adipose storage, as the study participants in the present trial, have an increased risk for dyslipidaemia, and this may be one explanation for the different outcomes of these studies.
The capacity for CA synthesis is limited in vertebrates(Reference Graeve, Albers and Kattner16), but fish species such as herring and mackerel feeding on zooplanktons are dietary sources of CA for humans. We have recently shown that CA and its two shorter metabolites GA and 7OA are incorporated in blood cells from rats after consuming diets containing herring oil or a CA concentrate(Reference Hansen, Mjos and Softeland35,Reference Rimmen, Mjos and Softeland50) . The EPA content in the blood cells from rats fed herring oil, anchovy oil or a CA concentrate was also higher compared with controls fed a soyabean oil-based diet, reflecting the higher EPA content in the marine oils(Reference Hansen, Mjos and Softeland35,Reference Rimmen, Mjos and Softeland50) . Likewise, the EPA content in leucocytes increased in adults with overweight or obesity after 8 weeks of high intake of fatty fish(Reference Helland, Bratlie and Hagen45), showing that leucocyte membranes are affected by dietary fatty acid intake. In the present study, we show for the first time that CA is incorporated in leucocyte membranes in humans, and we also show that GA, originating either directly from the CECO supplement or resulting from β-oxidation of CA in the participants, is incorporated in human leucocytes. The leucocytes are important players in the innate immune system’s first line of defence against foreign invaders, including the engulfing of pathogens, and changes in the membrane composition of leucocytes may affect the efficiency of these cells. Phagocytosis is membrane-dependent; therefore, alterations in the fatty acid composition of leucocytes may affect membrane fluidity, which in turn may affect phagocytosis activity and capacity. Increasing the content of PUFAs such as EPA in leucocyte membranes may increase fluidity and chemotaxis, thereby upregulating the capacity for phagocytosis. Although neither of these features was measured in the present study, this should be of interest in future clinical studies investigating fish oils either with or without CA.
Macrophages are defined as a type of phagocytic leucocyte and release pro-inflammatory mediators to activate the immune response and infiltrate tissues, thus playing an important role in chronic inflammation. In the present study, we isolated leucocytes, but not pure macrophages. Any changes in the macrophages’ membrane fatty acid composition may impact other characteristics, such as the activity of the cyclo-oxygenase system producing PGs with pro- or anti-inflammatory properties. MUFAs are not substrates for cyclo-oxygenase, and CA itself is not a precursor of eicosanoids as it is a 22-carbon-long fatty acid. Little is known about whether CA incorporated into leucocyte membrane affects the production of eicosanoids from twenty carbon-long PUFAs, but there are indications that CA and other MUFAs may inhibit cyclo-oxygenase activity by binding to an allosteric site on cyclo-oxygenase-1(Reference Smith and Malkowski51). Arachidonic acid is a precursor for pro-inflammatory eicosanoids such as PGE2, whereas EPA is a precursor of anti-inflammatory eicosanoids including PGE3, and increased intake of EPA is associated with lower concentrations of pro-inflammatory eicosanoids(Reference Calder52). Although the leucocyte EPA content was increased in both the CECO and the SOYO3 groups, the circulating PGE3 concentration was not affected in either of the groups. Also, no clear association was seen between the arachidonic acid content in leucocytes and the serum concentration of PGE2. In the present study, we measured only two PGs and the fatty acid composition was measured solely in leucocytes, whereas EPA and arachidonic acid are precursors for a wide range of eicosanoids produced in a variety of organs. Thus, we cannot rule out the possibility that synthesis of other eicosanoids originating from EPA or arachidonic acid may have been increased as a result of the CECO or SOYO3 supplementations.
This study has some strengths and limitations. Strengths include the design of the interventions as CA was found solely in the CECO capsules, whereas the EPA content was comparable in the CECO and SOYO3 capsules. This makes it possible to distinguish any effects of CA from those of EPA in the present study. The chosen CA dose from the capsules is relevant for consumption as a supplement or from more natural dietary sources. The CA content in herring differs through the seasons and is affected by geographical and nutritional conditions and cannot be precisely defined. A dinner portion of 150 g of herring fillet typically contains 3·0–4·7 g CA(53), which is higher than the daily dose of 1·49 g CA in the present study. This study had a high degree of completion; seventy-eight of the eighty included participants completed both study visits, and only three participants were excluded due to not adhering to the study protocol. The compliance appeared to be high in both groups, as CA was detected in the endpoint leucocyte samples from all participants in the CECO group and in none of the samples from the SOYO3 group. Another strength is that the estimated intake of energy and macronutrients was similar at baseline and at the end of the intervention period in both groups. The inclusion of both females and males strengthens the generalisability of the findings. Limitations to the study are the short duration of the intervention and the inclusion of solely healthy adults with overweight or obesity which restricts the generalisability of the present findings. Future research should investigate the effects of CA on the LDL-cholesterol concentration in populations with increased risk for developing metabolic disturbances leading to dyslipidaemia, since these have an increased probability for developing CVD, such as patients with type 2 diabetes(Reference De Rosa, Arcidiacono and Chiefari54–Reference Sarwar and Gao56).
The observed LDL-cholesterol-lowering effect of CECO in the present study is of immense interest and is in line with our recent study where a diet containing a CA concentrate resulted in a lower LDL-cholesterol concentration when fed to obese Zucker fa/fa rats(Reference Oldernes, Hansen and Mjos24). In these obese rats, the LDL-lowering effect was probably a consequence of downregulated lipogenesis in the liver accompanied with lower VLDL lipidation and secretion(Reference Oldernes, Hansen and Mjos24). An LDL-cholesterol-lowering effect through down-regulation of lipogenesis and VLDL secretion may have an even more pronounced effect in humans than in rats, since LDL is the main cholesterol transporter in humans whereas HDL is the main cholesterol transporter in rats. The present clinical trial was not designed to elucidate the mechanism(s) behind the LDL-cholesterol-lowering effect of CA, but based on findings in the rat study, a reduced lipogenesis followed by decreased VLDL secretion may be the mode of action for CECO in the present clinical trial.
The CECO capsules contain a range of MUFAs in addition to the n-11 MUFAs CA and GA. The content of erucic acid (C22:1n-9) in CECO is of special interest, since chronic exposure of erucic acid is associated with myocardial lipidosis(Reference Knutsen and Alexander57). Therefore, we tested a CA concentrate in obese rats before starting this clinical study, using a dose corresponding to 30 mg erucic acid/kg body weight/d for 5 weeks. Neither the lipid content in the heart muscle(Reference Oldernes, Hansen and Mjos24) nor the serum N-terminal Prohormone Brain Natriuretic Peptide concentration(Reference Hansen, Mjos and Softeland35) were affected when compared with obese rats fed an erucic acid-free diet based on soyabean oil. In the present clinical trial, the daily erucic acid intake from CECO capsules was 72 mg, corresponding to a dose of approximately 0·8 mg/kg body weight/d for our participants. This dose is considerably lower than European Food Safety Authority (EFSA’s) proposed provisional tolerable daily intake of 7·5 mg erucic acid/kg body weight/d (about 500 mg erucic acid/d) for the average adult(Reference Knutsen and Alexander57) and did not affect the erucic acid content in leucocytes after CECO capsule intake. From this, we consider that a daily supplementation with 4 g CECO is in accordance with EFSA’s recommendation regarding safe intake of erucic acid in adults.
Conclusion
In this study, we present evidence that dietary supplementation with CA as the main component decreased the LDL-cholesterol concentration in adults with overweight or obesity. This is in line with the study hypothesis. Our findings also demonstrate that CA and EPA from the study supplement were incorporated into the leucocyte membrane, but CECO supplementation did not affect the circulating concentrations of PGE2 and PGE3.
Supplementary material
For supplementary material/s referred to in this article, please visit https://doi.org/10.1017/S0007114526107375
Acknowledgements
The authors thank bioengineer Liv Aasmul for her invaluable contribution to this study.
This research was funded by the Norwegian Seafood Research Fund (FHF, grant number 901769). The funder had no role in the design of the study; in the collection, analyses, or interpretation of data; and in the writing of the manuscript, or in the decision to publish the results.
The study was designed by K. H., M. A. M., L. V. A., S. A. M. and O. A. G. The study was conducted by K. H., M. A. M., L. V. A. and O. A. G. Data analyses and data interpretation were performed by all authors. O. A. G. drafted the paper and had primary responsibility for the final content. All authors have contributed to the writing and approved the final version of the manuscript.
The authors declare no conflict of interest.


 Open access

