

The prevalence of diabetes and obesity is increasing worldwide with about 200 million diabetic and more than a billion overweight individuals in the world(Reference Kahn, Hull and Utzschneider1, Reference Yach, Stuckler and Brownell2). Oxidative stress is often considered to play an important role in the development of insulin resistance and complications of diabetes(Reference Evans, Goldfine and Maddux3, Reference Maritim, Sanders and Watkins4). Antioxidants have been for long proposed as potentially useful compounds in the management of diabetes, since they may reduce the level of advanced glycation end products known to cause microvascular alterations (neuropathy, retinopathy and renal dysfunction)(Reference Grattagliano, Vendemiale and Boscia5, Reference Fardoun6). Increased content of fatty acids and their metabolites is also suggested to reduce insulin sensitivity in different tissues: muscle; liver; adipose tissue. This lipotoxicity could induce oxidative and inflammatory stress and consequently impair insulin signalling(Reference Evans, Goldfine and Maddux3, Reference Schrauwen7). At a cellular level, oxidative stress consists of increased production of reactive oxygen species (ROS) through the intervention of enzymatic, non-enzymatic (hyperglycaemia, glucose oxidation) and/or mitochondrial pathways (mitochondrial respiratory chain, xanthine oxidase, cyclo-oxygenase, lipoxygenase, NADPH oxidase…)(Reference Fardoun6, Reference Poli, Leonarduzzi and Biasi8). NADPH oxidase appears as a key ROS-producing enzyme in the background of the metabolic syndrome(Reference Roberts, Barnard and Sindhu9, Reference Grattagliano, Palmieri and Portincasa10). ROS interact with PUFA, producing reactive lipid by-products (lipoperoxide radicals, lipid peroxides and degradation products such as aldehydes), prone to interact with macromolecules such as proteins and DNA and leading to cellular dysfunction. ROS production modulates intracellular kinase activities (Jun N-terminal kinase, NF-κB…), leading to increased phosphorylation of Ser/Thr IR and insulin receptor substrate, and to a decreased Tyr phosphorylation of insulin receptor substrate, both resulting in impaired insulin action and glucose transport(Reference Evans, Goldfine and Maddux3, Reference Evans11). This link could serve as a rationale to assess the interest of antioxidant in the management of early phases of diabetes development (insulin resistance). Increased intake of vitamin E – which counteracts peroxyl radical reactivity– have been largely proposed in this context(Reference Fardoun6, Reference Traber and Atkinson12). Insulin resistance associated with obesity has been often studied in animal models receiving a high-fat (HF) diet(Reference Burcelin, Crivelli and Dacosta13–Reference Cani, Amar and Iglesias15). It has been suggested that fat mass accretion promotes oxidative stress in the adipose tissue upon diet induced obesity in mice(Reference Furukawa, Fujita and Shimabukuro16). The present study aimed at assessing the potential relationship between lipid peroxidation, vitamin E status and glucose/insulin response in obese and diabetic mice fed a HF diet.
Experimental methods
Animals and diets
Ten-week-old male C57BL/6J mice (Charles River) were housed in groups of four mice per cage (eight per group) at 22°C with sequential light/dark cycle (lights off 18.00 hours; lights on at 06.00 hours) and were given free access to diet and water. They were either fed a control (CT; AO4, SAFE, Villemoison-sur-Orge, France) or a HF (SAFE) diet for 28 d. The CT diet contained the following (g/100 g dry diet): protein 19·3; total carbohydrate 70·4 (including starch 38, saccharose 3, cellulose 5 and non-digestible carbohydrates 8); lipid 3; vitamin 1·3; mineral mixture 6. The HF diet contained, in percentage of energy content, 72 % lipids (with proportion of 2·4:1 lard: maize oil), 28 % protein, and < 1 % carbohydrates as described(Reference Cani, Neyrinck and Fava17, Reference Cani, Bibiloni and Knauf18). Food intake, taking into account spillage, was recorded weekly for a month. The mean value for the weekly assessment was calculated. At the end of experiment, retro-orbital vein blood samples were collected in EDTA tubes and plasma was stored at − 80°C. Mice were killed by cervical dislocation after a 6 h period of fasting; fasting started at 07.30 hours and mice were killed from 13.30 hours. All mice experiments were approved by the local committee and the housing conditions were as specified by the Belgian Law of 14 November 1993 on the protection of laboratory animals (agreement no. LA 1230314).
Oral glucose tolerance test
An oral glucose tolerance test was performed 3 weeks after the beginning of the feeding period(Reference Cani, Knauf and Iglesias14, Reference Cani, Amar and Iglesias15, Reference Knauf, Cani and Perrin19). Six-hour-fasted mice received an oral load of glucose of 3 g/kg body weight with a 660 g/l glucose solution; fasting started at 07.30 hours and glucose administration at 13.30 hours. Different parameters related to glucose homeostasis have been measured. Blood glucose was determined with a glucose meter (Roche Diagnostics Belgium, Vilvoorde, Belgium) on 3·5 μl of blood collected from the tip of the tail vein, 30 min before and 0, 15, 30, 60, 90 and 120 min following oral glucose administration. Plasma insulin was measured on 5 μl of plasma collected from tail blood at 0 and 15 min using an ELISA kit (Mercodia, Upssala, Sweden). The insulin resistance index was obtained by the multiplication of the area under the curve (AUC) of glucose between 0 and 15 min after glucose administration and the AUC of insulin between 0 and 15 min after glucose administration; its unit is mm pm min2(Reference Cani, Bibiloni and Knauf18, Reference Lin, Yu and Wang20, Reference Guerre-Millo, Rouault and Poulain21). The AUC was calculated from basal glycaemia (30 min before glucose administration) up to 120 min after the glucose administration, with no correction of the area by the basal value.
Blood samples
TNF-α, IL-6, IL-1α, IL-1β, monocyte chemoattractant protein-1 and macrophage inflammatory protein-1α were determined in 25 μl of plasma using a Multiplex kit (Bio-Rad, Nazareth, Belgium) and measured by using Luminex technology (Bio-Plex System™, Bio-Rad) according to the manufacturer's instructions.
Tissue samples
Fat pads (visceral, epididymal and subcutaneous) and liver were removed and immersed in liquid N2 and stored at − 80°C for further mRNA and/or lipid analysis. Full and empty caecum, liver, spleen and fat tissues were weighed. The caecal contents were collected and maintained at − 80°C. Liver was excised: most of it was immediately clamped in liquid N2 and kept at − 80°C for lipids and mRNA analysis. Total fat mass stands for the sum of epididymal, visceral and subcutaneous adipose tissues.
Tissues analyses
TAG, phospholipids and cholesterol were measured in the liver tissue after an extraction with chloroform–methanol according to Folch et al. (Reference Folch, Lees and Sloane Stanley22). Tissue lysate was prepared in phosphate buffer by using Ultra-Turrax (IKA, T10 basic, Boutersem, Belgique), until complete tissue lysis. Lipids were extracted by mixing 125 μl lysates with 1 ml of chloroform–methanol (2:1). The chloroform phase was evaporated under nitrogen flux, and the dried residue was solubilised in 100 μl of isopropanol. Liver phospholipids (Wako, Brussels, Belgium), TAG and cholesterol (Elitech diagnostics, Brussels, Belgium) concentrations were measured using kits coupling enzymatic reaction and spectrophotometric detection of reaction end products.
Lipid peroxidation was evaluated by measuring thiobarbituric acid-reactive substances (TBARS). Tissue lysate was prepared in saline by using Ultra-Turrax (IKA), until complete tissue lysis. Aldehydes contained in tissue lysate reacted with thiobarbituric acid forming an aldehyde–thiobarbituric acid complex, which can be spectrophotometrically detected(Reference Esterbauer and Cheeseman23).
To analyse the fatty acid pattern of epididymal adipose tissue and diets, lipids were first extracted from epididymal adipose tissue and diets by the method of Folch et al. (Reference Folch, Lees and Sloane Stanley22). The concentration of individual fatty acids was then analysed by GLC(Reference Lepage and Roy24, Reference Dahlan, Richelle and Kulapongse25). The internal standard used for fatty acids concentrations in total lipid extract was 15 : 0 at 100 mg/l solved in chloroform–methanol (2:1).
In order to measure liver glutathione, tissue proteins were aggregated using TCA and supernatant was then recuperated. ortho-Phthalaldehyde was added to supernatant and formed adducts with the glutathione contained in the supernatant. Those can then be detected by fluorimetry(Reference Hissin and Hilf26).
Vitamin E was extracted from tissues or diet with hexane. The concentration of vitamin E was then analysed by HPLC coupled with a Gilson fluorescent detector(Reference Hatam and Kayden27, Reference Traber and Kayden28).
Liver phosphorylated form of p-IGF-1R (Y1135/Y1136), p-Akt (S473), p-GSK-3β (S9) and p-p70S6K (T421/S424) were measured using Luminex technology. Liver tissue were homogenised in lysis buffer (50 mm-2-amino-2-hydroxymethyl-propane-1,3-diol, 1 % NP40, 5 mm-EDTA, 250 mm-NaCl, 50 mm-NaF, 1 mm-Na3VO4, proteases inhibitors cocktail (Roche Diagnostics Belgium)). After 15 min on ice and centrifugation (13 000 g, 10 min, 4°C), supernatants were snap frozen and aliquots were stored at − 80°C. Protein content of supernatants was determined using the Bradford method. The assay was performed by using a Multiplex kit (Akt pathway phospho7plex, BioSource, Nivelles, Belgium) through Luminex technology (Bio-Plex, Bio-Rad) according to the manufacturer's instructions.
Real-time quantitative PCR
Total RNA was isolated from subcutaneous adipose tissue and liver using TriPure isolation reagent kit (Roche Diagnostics Belgium). cDNA was prepared by reverse transcription of 1 μg total RNA using the Kit Reverse transcription System (Promega, Leiden, The Netherlands). Real-time PCR were performed with the StepOnePlus real-time PCR system and software (Applied Biosystems, Den Ijssel, The Netherlands) using SYBR Green for detection. RPL19 RNA was chosen as a housekeeping gene. Primers and gene detailed are summarised in Table 1. All tissues were run in duplicate in a single 96-well reaction plate and data were analysed according to the 2− ΔCT method(Reference Cani, Amar and Iglesias15). The identity and purity of the amplified product were checked through the analysis of the melting curve carried out at the end of amplification.
Primers sequences used for real-time quantitative PCR

iNOS, inducible NO synthase.
Statistical analysis
Results are presented as means with their standard errors. Statistical significance of differences was analysed using Student's t test. Correlations between parameters were assessed by Pearson's correlation test (GraphPad Software, San Diego, CA, USA; www.graphpad.com). P < 0·05 was considered as statistically significant.
Results
Effect of high-fat diet on obesity and metabolic alterations
Weekly energy intake was monitored during the 4 weeks of experience. CT and HF mice had the same food intake in g (total food intake during the 4 weeks of experiment – mean for four mice: 262 and 281 g for CT and HF groups, respectively) but HF-fed mice had an increased energy intake (total energy intake during the 4 weeks of experiment – mean for four mice: 208 and 397 kJ for CT and HF groups, respectively). Total body weight gain was significantly increased in HF mice (Table 2). Liver weight relative to the body weight was significantly decreased in HF mice, whereas spleen weight relative to the body weight was increased. Relative total body fat mass was significantly increased in HF mice (total fat mass – means with their standard errors in g: CT 3·5 (se 0·1); HF 4·8 (se 0·4); P < 0·05), with a significant effect shown for the epididymal tissue. Both caecal tissue and caecal content weights relative to the body weight were significantly reduced in HF animals.
(Mean values with their standard errors)
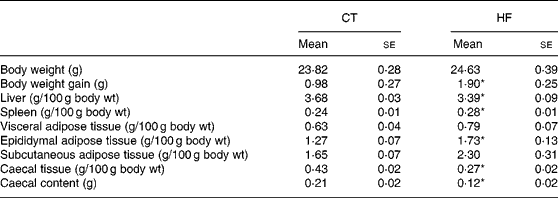
CT, control; HF, high fat.
Statistically significant differences between groups were determined by Student's t test (CT n 7, HF n 8): *P < 0·05.
HF mice exhibited a higher fasting glycaemia (Fig. 1(A)) when compared with CT, whereas fasting insulinaemia tend to be higher but such a difference failed to achieve significance (Fig. 1(B)). Fifteen minutes after oral glucose loading, insulinaemic response was strongly increased in HF mice (insulinaemia at 15 min – mean in pm: CT 279·4 (se 13·22), HF 345·8 (se 21·37); P < 0·05) and their glucose tolerance was significantly impaired (see AUC of glycaemia, Fig. 1(D)). The insulin resistance index, AUC glucose 0–15 min × AUC insulin 0–15 min mm pm min2 – was significantly increased in HF mice (Fig. 1(C)). From those observations, we can confirm that HF diet increases body weight gain, energy intake and adiposity, and promotes glucose intolerance.
Glucose homeostasis at the fasting state (before the glucose load) and upon oral glucose tolerance test (OGTT). (A) Fasting plasma glycaemia (mm); (B) fasting plasma insulinaemia (pm); (C) insulin resistance index (mm pm min2); (D) evolution of glycaemia after glucose loading (mm, ♦ control (CT); ○ high fat (HF)) and area under the curve (AUC) of glycaemia (inserts). Data are means with their standard errors (CT n 7, HF n 8). *P < 0·05.

Modulations of tissue fatty acids and vitamin E content by high-fat diet
Liver lipid content (TAG, cholesterol and phospholipids) was not significantly modified by the dietary treatment (data not shown). The fatty acid pattern has been measured both in the diet and in the epididymal adipose tissue. Total fatty acid was approximately 20 times higher in HF diet compared with the CT one, all types of fatty acid (saturated, monounsaturated and polyunsaturated) being increased (Table 3). The HF diet was also characterised by a higher 18 : 0:16 : 0 ratio (Table 3). In the epididymal adipose tissue, total fatty acid concentration was not significantly modified by the diet. HF feeding significantly increased MUFA, and tended to decrease PUFA. Concerning specific modifications of tissue fatty acids, we observed a significant increase in both stearic (18 : 0) and oleic (18 : 1n-9) acids, whereas no modifications of palmitic acid (16 : 0) occurred (Table 3).
(Mean values with their standard errors)

Statistically significant differences between groups were determined by Student's t test: *P < 0·05.
Vitamin E was strongly (more than 10-fold) increased in the HF v. CT diet. This dietary difference strongly modulated tissues' vitamin E concentrations, mostly in liver tissues of HF-fed animals (more than 5-fold the CT value) and to a lesser extent in the epididymal adipose tissue ( × 1·5; Table 4).
(Mean values with their standard errors)

CT, control; HF, high fat.
Statistically significant differences between groups were determined by Student's t test: *P < 0·05.
Effect of high-fat diet on tissue markers of inflammatory and oxidative stress
HF-fed mice showed a significant increase in plasma IL-1α levels, without significant modifications in IL-1β and TNF-α plasma concentrations (Table 5). Others peptides associated with inflammation and the metabolic syndrome, and namely secreted by the adipose tissue (monocyte chemoattractant protein-1, macrophage inflammatory protein-1α and IL-6), reached similar serum concentrations in both groups (data not shown). mRNA levels of TNF-α, IL-1α and also iNOS were measured in the liver and subcutaneous adipose tissue and showed no difference between groups (Table 5). CD68 mRNA levels were also measured as a marker of macrophages fixed in the liver and in subcutaneous adipose tissue, but no differences was detected between groups (Table 5). Phosphorylated proteins implicated in the insulin signalling were quantified in the liver tissue. As insulin signalling and NFκB pathways interact, IGF-1R, Akt, GSK-3β and p70S6K can be seen as markers of inflammation. All were slightly – but not significantly – decreased in HF-fed mice (Table 5). HF diet thus increases plasma IL1-α levels, without modifying the other inflammatory parameters analysed.
(Mean values with their standard errors)

CT, control; HF, high fat.
Statistically significant differences between groups were determined by Student's t test (CT n 7, HF n 8): *P < 0·05.
Concerning the oxidative stress, HF diet significantly increases liver NADPH oxidase expression as compared with CT (Fig. 2), measured by the expression of Nox2 mRNA. Subcutaneous adipose tissue NADPH oxidase mRNA level was not affected by the treatment (data not shown). Glutathione was measured in the liver (glutathione– means with their standard errors in nmol/mg prot: CT 7·0 (se 0·4), HF 7·7 (se 0·4)) but no significant modification was observed. Strikingly, mice fed a HF diet exhibited a significant decrease in TBARS contents in the liver, the epididymal and subcutaneous adipose tissues (Fig. 3). TBARS closely and inversely correlates with vitamin E content in the liver and epididymal adipose tissue (Fig. 4).
Liver NADPH oxidase mRNA levels measured at the end of dietary treatments. Data are means with their standard errors (control (CT) n 7, high fat (HF) n 8). *P < 0·05.

Thiobarbituric acid-reactive substance (TBARS) levels in different tissues – (A) liver, (B) epididymal, (C) visceral and (D) subcutaneous adipose tissues – in mice at the end of dietary treatments. Data are means with their standard errors (control (CT) n 7, high fat (HF) n 8). *P < 0·05.

Correlations between tissue vitamin E and thiobarbituric acid-reactive substances (TBARS): (A) in the liver and (B) in the epididymal adipose tissue. Vitamin E and TBARS levels are expressed as log10 (liver n 15, adipose tissue n 13). (A) r − 0·58 24, P = 0·0227; (B) r − 0·8805, P < 0·0001.

Insulin resistance is often related to different markers of both inflammatory and oxidative stress. In the present study, insulin resistance index positively correlates with hepatic NADPH oxidase mRNA level and negatively correlates with hepatic TBARS (Fig. 5).
Correlations between insulin resistance index and: (A) liver NADPH oxidase mRNA, (B) liver thiobarbituric acid-reactive substances (TBARS). Insulin resistance index, NADPH oxidase and TBARS levels are expressed as log10 (A) n 10, (B) n 13. (A) r 0·7912, P = 0·0064; (B) r − 0·5616, P = 0·0458.

Discussion
Mice fed a diet consisting of HF (70 % in energy) and protein exhibit strong alterations of insulin sensitivity(Reference Cani, Knauf and Iglesias14). In the present study, we clearly see that the HF diet disturbs glucose homeostasis, by increasing glycaemic response upon an oral glucose load, and by increasing fasting glycaemia. Could it be related to fatty acid composition of the diet? The profile of fatty acids seems important when taking into account the effect of a HF diet on metabolic disorders(Reference Riserus29–Reference Summers, Barnes and Fielding32). In the present study, the HF diet given to mice was characterised by an increase in all types of fatty acids (SFA, MUFA and PUFA), 18 : 0 becoming important as a source of saturated fat. In the adipose tissue, we observe a huge increase in 18 : 0 and 18 : 1n-9 fatty acids, with minor modifications of other types of major fatty acids. The increase in 18 : 1n-9 could be related to an increase in dietary intake or due to the desaturation of 18 : 0, namely through stearyl-CoA desaturase-1 activity. In fact, an increase in stearyl-CoA desaturase-1 activity is associated with insulin resistance(Reference Riserus29).On the other hand, an increase in MUFA improves the insulin sensitivity in the postprandial state(Reference Lopez, Bermudez and Pacheco31). Therefore, it is rather difficult to clearly state that the modifications of fatty acid profile explain per se the metabolic alterations upon a HF diet.
Several data suggest that oxidative and inflammatory stresses are implicated in the alterations of insulin response, and therefore promote diabetes associated with obesity(Reference Evans, Goldfine and Maddux3, Reference Wellen and Hotamisligil33, Reference Shoelson, Lee and Goldfine34). This phenomenon is related to endotoxaemia, which promotes fat mass development, insulin resistance by a CD14/TLR-dependent mechanism(Reference Cani, Amar and Iglesias15). Here, we show that there is only a small increase in specific proinflammatory cytokines – namely IL-1α – in the serum of HF-fed mice, and there is no modification of all other inflammatory markers measured either in the serum, the adipose tissue or in the liver. The role of IL1-α, which increases upon metabolic endotoxaemia(Reference Cani, Neyrinck and Fava17) in the pathogenesis of diabetes, remains poorly studied up to now, but it would merit attention, since it is also correlated with the modulation of the gut microflora, a new target associated with obesity in the HF-fed mice models(Reference Cani, Neyrinck and Fava17). Anyway, we show here that HF diet does not necessarily lead to a significant inflammation process, despite it is able to disturb glucose homeostasis.
Besides inflammatory burst clearly associated with the disruption of insulin signalling(Reference Wellen and Hotamisligil33, Reference Shoelson, Lee and Goldfine34), ROS production also appears as an important phenomenon in glucose homeostasis alterations associated with fat mass development. This relation has been largely studied in the adipose tissue, where a key role for NADPH oxidase in oxidative burst has been proposed(Reference Furukawa, Fujita and Shimabukuro16).
Here, we show that NADPH oxidase mRNA is also increased in the liver tissue of HF-fed diabetic animals, a phenomenon correlated with insulin resistance index, and which is not related to lipid accumulation in the liver tissue. The relevance of the increased NADPH oxidase expression in the production of active ROS such as superoxide anion remains to be proven, as well as the mechanism involved in the increase in NADPH oxidase expression in the liver and adipose tissue upon HF feeding. However, the increase in NADPH oxidase expression could not be directly linked to the amount of lipid peroxides in the liver and adipose tissue of HF-fed mice. Strikingly, in the present model, some features of oxidative stress are decreased upon HF feeding since lower liver peroxidation (TBARS) was observed both in the liver and in the adipose tissues. Furthermore, there is no modification of GSH content or endogenous peroxidase activity – assessed by histochemical analysis – data not shown – in the liver tissue upon dietary treatment. Only a slight decrease in adipose tissue PUFA is observed in HF-fed animals, as compared with the huge decrease in lipid peroxides. Even if we may not exclude the fact that it participates to the decrease in lipid peroxidation, we can reasonably assume that the decrease in PUFA may not constitute the sole explanation. Arsov et al. (Reference Arsov, Larter and Nolan35) have also demonstrated that TBARS are lower in a model of HF diet-induced steatosis. Here, we propose that this ‘protection’ against lipid peroxidation is merely due to the high content of vitamin E in the HF diet, leading to a huge increase in vitamin E content in the liver tissue, and in a less extent, in the adipose tissue. It is important to note that vitamin E is the most potent peroxyl radical scavenger among nutrients(Reference Traber and Atkinson12).
We may thus conclude that lipid peroxides are not implicated in the metabolic alterations causing insulin resistance and diabetes in this dietary model, but could contribute to the occurrence of other features associated with obesity, namely low tone inflammation. Interestingly, other authors had shown that another marker of lipid peroxidation – namely isoprostanes measured in the urines – is not involved in the development of glucose intolerance in human beings(Reference Boyne, Sargeant and Bennett36). The lack of association between lipid peroxidation and metabolic disturbances must be taken into consideration in the nutritional advices devoted to counteract or to prevent diabetes. In fact, the clinical trials conducted to date failed to provide adequate support for the use of vitamin E in diabetes(Reference Fardoun6).
The production of reactive species remains, namely through NADPH oxidase, important in the perturbation of insulin signalling in different tissues, including the liver(Reference Evans, Goldfine and Maddux3, Reference Milagro, Campion and Martinez37, Reference Cave, Deaciuc and Mendez38). In that context, in addition to the NADPH oxidase, mitochondrial and endoplasmic reticulum stresses may be considered as important targets to take into account when assessing the effect of interesting nutrients or nutritional approach to counteract diabetes associated with obesity(Reference Hotamisligil39, Reference Rolo and Palmeira40). The present study also supports the fact that the content of vitamin E – or other antioxidants? – in experimental diets could be taken into account when assessing some specific features associated with obesity and metabolic disorders (inflammation and oxidative stress).
Acknowledgements
The present work was supported by Kaneka Inc. and by the Région Wallonne (WalNut 20 Project). P. D. C. is a postdoctoral researcher from the FRS-FNRS (Fonds la Recherche Scientifique), Belgium. We thank A. Chwalik and A. Dufour for their technical assistance. The authors' responsibilities were as follow – F. M. S.: performed most of the experimental studies in mice and analyses; A. M. N. and E. M. D.: participated to the in vivo follow-up of animal study and sampling at the end of the experiment; L. B.: performed cytokines analyses; L. P., W. J. M. and Y. A. C.: performed the analyses of FA and vitamin E as well as interpretation of the data; P. D. C.: helped in sampling at killing, in cytokines measurement and in global interpretation of data; N. M. D.: responsible for the whole experiment plan and for the writing and reading of the manuscript. None of the authors had any conflict of interest.


