




Consumers in the US have embraced organic milk products, with their retail purchases totaling more than $6 billion in 2020, five times the 2002 level (OTA, 2021). The availability of organic milk in the supermarket is guided by standards that specify organic production and marketing practices which start from the production of the milk cows and continue to the bottling and distributing organic milk. The framework for this process is the Organic Foods Production Act (OFPA) of 1990, which sets out the regulatory system as a public–private partnership (OFPA, 1990). The central figure, the United States Department of Agriculture (USDA), develops and enforces the national organic standard, based on OFPA. Certification of farms, ranches and handlers is performed by third-party accredited agencies, commonly referred to as ‘certifiers’. An advisory board with volunteer members appointed by the Secretary of Agriculture, The National Organic Standards Board (NOSB), makes recommendations to USDA about the regulation (OFPA, 1990).
While USDA is the final authority on the practice of organic in the US, the organic industry, the public and the NOSB have important roles in shaping the trajectory of the regulation. The organic industry members include all parties with a financial stake in the sector, such as organic farmers, handlers, certifiers, nonprofits and other businesses. The composition of the NOSB was specified by OFPA: four organic farmers, three environmental/resource conservationists, three consumer/public interest representatives, two organic handlers, one retailer, one scientist (toxicology, ecology or biochemistry) and one USDA accredited certifier (USDA, AMS, 2015). Two times a year, prior to the spring and fall NOSB meeting, all members of the public have an opportunity to comment on the regulation. All proposed rules are similarly available for public comment, typically for 30–90 days (Center for Effective Government, Undated). Together, the industry, public and NOSB include voices representing a wide range of constituents that often have opposing interests and opinions.
In the 30 years since the passage of OFPA, numerous internal debates, heated at time, have raged among the industry, public and NOSB. From the perspective of an outsider, some of these debates result from a wedge between perceptions of organic, which varies across individual consumers and farmers, and how organic is codified in the US regulation. These competing views have consistently caused ideological conflicts among organic industry members and consumers (Carter et al., Reference Carter, Mosier and Adams2019).
Livestock, and dairy in particular, regulations have been a continual source of conflict and disagreement. For dairy, three problematic points are access to outdoors, how to transition dairy cows to organic and the amount of space livestock should have. At the crux of the matter is that, because certifiers have not always applied the regulation uniformly, livestock operations have been certified as organic with different amounts of access to the outdoors or pasture or different procedures for transitioning organic dairy herds (USDA OIG, 2013). The differential interpretations are the result of vague language in OFPA, and in the absence of a clarifying rule by USDA, there is room for interpretation by certifiers making possible compliance with the letter but not the spirit of the law. Such differences in interpretation likely have implications for production costs and economic competitiveness of farms, since some producers face lower production costs—not as a result of superior farm management, but as a consequence of certification differences. According to a recent public comment made by the Organic Farmer Association (2021), inconsistencies in certification rules have negatively impacted smaller-scale dairy producers. Further, organic industry members and the NOSB have repeatedly asked USDA to tighten the regulations.
These longstanding tensions raise the question of how the economic condition of organic dairy operations has evolved over time, particularly of smaller scale operations relative to larger ones. However, understanding the relative changes in the economic condition of organic dairy operations over time is difficult. One crucial aspect is the regional nature of dairy production in the United States. In general, both the conventional and organic dairy sectors are characterized by large operations in the West and relatively smaller operations elsewhere.
Another dimension of the organic dairy sector, which adds complexity to the supply chain, is the oligopolistic nature of organic milk processing (Greene and McBride, Reference Greene and McBride2015). Initially, two organic milk processors supplied the bulk of organic milk: Horizon Organic and Organic Valley. A third processor entered the industry around 2004, Aurora Organic Dairy. At the time of this writing, the three processors dominate the market, each operating under a different business model. Horizon, the largest processor in 2020, contracted with more than 500 organic family farmers for their production (Horizon Organic, 2022). Organic Valley, a farmer-owned cooperative, had nearly 1800 members in 2022 (Organic Valley, 2022). Horizon and Organic Valley traditionally operated with the goal of providing stable milk prices for their producers, which was accomplished by managing the supply of organic milk on the market through quotas (Organic Valley) and contracts (Horizon). The focus on price stability might have been a reaction to price volatility of conventional milk, which since the 1980s has contributed to dairy farm financial stress (Wolf, Reference Wolf2021). Aurora Dairy is vertically integrated in farming and processing, and in 2022, contained two milk processing facilities and eight farms (Aurora Organic Dairy, 2022). Aurora supplies store brand milk to retailers. Horizon sells milk under its brand name, while Organic Valley sells both privately labeled and branded organic milk (Stevenson, Reference Stevenson2013). At the retail level, depending on the store, these products may directly compete for the same consumers.
The organic regulation itself is designed to be scale neutral. That said, organic food is part of a food system that contains economic incentives for farms to become larger. The challenges facing smaller scale producers, along with the disappearance of medium scale operations, have been well documented (Kirschenmann et al., Reference Kirschenmann, Stevenson, Buttel, Lyson, Duffy, Lyson, Stevenson and Welsh2008). The conventional dairy sector transformed over a 30-year period, from a sector where the median number of cows was 80 head or less in 1987, to one where the median farm had 1300 head in 2017 (MacDonald et al., Reference MacDonald, Law and Mosheim2020). Small conventional dairy operations exited the sector this period, as milk production moved west (MacDonald et al., Reference MacDonald, Law and Mosheim2020). Reductions in production costs provided incentives for conventional dairy farms to increase in size, largely because costs progressively declined as farms grew larger (MacDonald et al., Reference MacDonald, Law and Mosheim2020). Thus, it is not surprising that dairy farms in the organic sector face similar incentives to take advantage of scale economies by growing larger.
This paper examines growth in the organic dairy farm sector along with the economic condition of organic dairies over time, by region. To do so, we first trace the evolution of the organic dairy standards from 2000. USDA organic survey data are used to examine changes in the number, size and production of dairy farms by region over time. Next, using USDA cost and returns data, we examine feeding practices, including time spent grazing and amount of pasture available. The cost and returns data allow an inspection of production costs and returns to assets at three points in time, by region. These changes are viewed in the context of changing market conditions, which reflect consumer demand, macroeconomic conditions and production challenges. While this work relies on the best available information, due to data limitations, the analysis is suggestive rather than conclusive.
Evolution of organic dairy standards
The dairy standards have evolved since 2002, although the process has been slow, and at times, contentious. Forces for change stemmed from two directions. The first was a 2002 lawsuit filed by a blueberry farmer, Harvey, against USDA, and became known as the ‘Harvey case’. The second route was through the process outlined in OFPA, where USDA heard public comment, received industry input and guidance from the NOSB, and consequently issued new rules.
The Harvey case argued that, in 2002, the national organic standards were inconsistent with the intent of OFPA (Harvey vs Veneman, No. 04-1379). The one aspect of the legal suit pertaining to dairy was the feed requirement for transitioning dairy cows, which at the time was specified as 80% organic feed for nine months (Harvey vs Veneman, No. 04-1379). The 2005 decision in this case ruled that 80% feed was indeed incompatible with OFPA, and the courts gave USDA one year to change the feed requirements to 100% organic feed during the transition period. Congress amended OFPA after the Harvey ruling, specifying that transitioning livestock were able to graze on land in the third year of the transition to organic (USDA, AMS, 2006). USDA revised the feed requirement in 2006 (USDA, AMS, 2006).
Other efforts to change organic dairy farming standards followed the process specified in OFPA, which included NOSB guidance and public comment. Two aspects that were ultimately resolved are (1) livestock access to the outdoors, including the amount of grazing time (OFPA section §205.240) and (2) the process of transitioning dairy animals to organic production (OFPA section §205.236). A third aspect, animal welfare standards, has been discussed more recently (USDA, AMS, 2017a). At the time of this writing, this third aspect remains unresolved. To date, USDA's proposed rules covering animal welfare have mostly focused on space requirements for certified organic chickens (USDA, AMS, 2017a, 2017b). Because of its focus on chickens, the discussion of animal welfare standards is excluded from this paper. However, similar to the debate over access to the outdoors and transitioning dairy animals, despite strong industry support, reaching a final rule on animal welfare has followed a lengthy process with multiple delays.
Access to outdoors and to pasture
Initially, access to outdoors and grazing was expressed as:
‘The producer must provide access to the outdoors, shade, shelter, exercise areas, fresh air, and direct sunlight suitable to the species, its stage of production, the climate, and the environment. This requirement includes access to pasture for ruminant animals’ (7 CFR Part 205, 2000).
The language, as initially written, lacked specificity regarding the definition of access to the outdoors. Furthermore, natural behavior is subjective; one might argue that confined feed operations are consistent with the natural behavior of dairy cows, because herd animals prefer to be in close proximity to other animals. Even before the standards became law in 2002, the NOSB grappled with the meaning of access to the outdoors. The 2001 NOSB tried to provide a framework for thinking about how to raise organic livestock—and ruminants in particular—in harmony with the animal's nature (NOSB, 2001). These discussions were taking place during a period of tremendous growth in consumer demand for organic milk, when Dean Food's purchase of Horizon Organic made organic milk widely available in mainstream supermarkets (Dimitri and Greene, Reference Dimitri and Greene2002).
In the absence of rulemaking on access to outdoors, the 2005 NOSB recommended more specific language. Instead of using the phrase ‘access to pasture’, the 2005 board recommended ‘grazing ruminant animals during the growing season’. The grazing rule would apply to all ruminants except for those younger than six months and those in the final 120 days of life (NOSB, 2005). Lactation was not a reason for avoiding grazing, requiring dairy cows to graze during the growing season. At this point in time, some large-scale organic dairies were known to be confined feeding operations (McBride and Greene, Reference McBride and Greene2010; Baker et al., Reference Baker, Delate, Turnbull and Cwach2011), which increased pressure to definitively address pasture requirements.
A decade in the making, the Pasture Rule was published in June 2010, requiring compliance within one year (Rinehart and Baier, Reference Rinehart and Baier2011). The Pasture Rule defined a grazing season as being at least 120 days a year. Organic dairy cows were to obtain at least 30% of dry matter (vegetation or hay, e.g.) from pasture. Lastly, a pasture management plan needed to be part of the Organic System Plan (USDA, AMS, 2010).
Transitioning dairy herds to organic: origins of organic livestock
Organic dairies often begin as conventional operations, transitioning to organic management to take advantage of higher and more stable milk prices (McBride and Greene, Reference McBride and Greene2010; O'Hara and Parsons, Reference O'Hara and Parsons2013). On a dairy farm, both grazing land and livestock are managed organically; the transition for grazing land takes three years and the herd transition takes one year. Once transitioned, the entire herd must be continuously managed organically and any cows added to the herd need to be managed organically from the last third of gestation (7 CFR Part 205, 2000). After conversion, to order to expand the herd, a producer has three options: (1) buy organic milk cows, which are ready to produce; (2) purchase replacement organic heifers, which are ready to produce milk at two years of age; or (3) raise replacement heifers on their farm. In 2016, according to the ARMS data, just eight percent of cows added to organic operations were purchased, indicating most operations produce replacement heifers on their farms.
Despite the requirement for organic management from the last third of gestation, some, but not all, certifiers were allowing organic dairy farms to continuously transition conventional cows into organic production (USDA OIG, 2013). The justification of the certifiers who allowed continuous transition was based on a producer defining additional cattle as a new herd (MOSA, 2021). A USDA audit report stated that OFPA does not define what ‘constitutes an entire, distinct herd’, and argued that a herd might be as small as several head of cattle (USDA OIG, 2013). Industry estimates suggest that continuous conversion reduces production costs by $600–$1000 per animal, providing those who adopt this practice a financial advantage (Organic Caucus, 2019). One of the few published analyses suggests that raising of a dairy cow organically from the first day of life costs about $880 more than raising it conventionally, then transitioning (Benson, Reference Benson2020). Furthermore, continuous transitioning of conventional animals into an organic herd makes it possible to increase the herd size (and bring organic milk to the market) in less time.
The NOSB, in 2003 and again in 2006, using different language, recommended that after a herd is transitioned the cows need to be managed organically from the last third of gestation (NOP, 2015). The first proposed rule on the Origin of Organic Livestock was open for comment in 2015. The rule specified who was eligible for transitioning (conventional or new operations), and that the transition plan had to be part of the organic system plan (NOP, 2015). The 2015 proposed rule was never finalized, and vanished from the USDA agenda with no explanation in 2017 (Meyer, Reference Meyer2019). The same proposed rule was reopened for comment in 2019. Congressional pressure via the Appropriations Act of 2020 required a final rule on Origins of Organic Livestock within 60 days of passage (Pingree, Reference Pingree2020), a deadline that USDA did not meet. At the Fall 2020 NOSB meeting, the NOP administrator argued that the failure to finalize the 2019 proposed rule stemmed from concern about enforceability of the specific language of the rule (Tucker, Reference Tucker2020). Other than this mention, the 2019 proposed rule left little trail or public explanation for USDA's failure to finalize the rule.
Finally, in 2021, USDA reopened the new Origins of Organic Livestock proposed rule for comment. In the 2021 proposed rule, the NOP solicited feedback on specific language in addition to asking if organic industry members were comfortable with expanding herds with purchased organic cattle (NOP, 2021). The final rule was released in 2022. The amount of time this rule spent moving through the regulatory channels was remarkably long, given that Origins of Livestock was noncontroversial with wide support.
Data availability and the trajectory of the market and regulatory environment
Currently two sources of publicly available data cover the organic farming sector: (1) the organic component to the Census of Agriculture, referred to as the Organic Survey and (2) the Agricultural Resource Management Survey (ARMS). Previous work on organic dairy using ARMS data compared relative technical efficiency and productivity of organic and conventional operations (Mayen et al., Reference Mayen, Balagtas and Alexander2009, Reference Mayen, Balagtas and Alexander2010; Gillespie et al., Reference Gillespie, Nehring and Sitienei2014; Hadrich and Johnson, Reference Hadrich and Johnson2015; Nehring, et al., Reference Nehring, Gillespie, Greene and Law2021). Others examined farm-level economic efficiency of organic dairies, at the state level (Holly et al., Reference Holly, Gunn, Rotz and Kleinman2019; Walsh et al., Reference Walsh, Parsons, Wang and Conner2020) and the national level (McBride and Greene, Reference McBride and Greene2009a, Reference McBride and Greene2009b; Brock and Barham, Reference Brock and Barham2013).
The two data sources have different strengths and limitations. The Organic Survey provides the best view of structural changes in the organic dairy farm sector, through its regular reporting of number of operations, number (head) of organic milk cows and pounds of milk by state. The Organic Survey began in 2008 and is repeated regularly; at the time of this writing, data covers 2011, 2014, 2015, 2016 and 2019 (USDA NASS 2022). The ARMS data provide insight into the financial condition of organic dairy operations and of farm practices and is a well-regarded source of detailed financial and production cost data. The ARMS Phase 3, dairy version including organic, was conducted by USDA's National Agricultural Statistics Service and Economic Research Service in 2005, 2010 and 2016. A design-based survey, ARMS uses stratified sampling, so weights or expansion factors are included for each observation, allowing for the extension of results to the dairy farm population of the 23 largest dairy states in the US identified in the Appendix. The ARMS data for organic dairy operations consists of three cross-sections. Few very large organic dairies are included in the ARMS data (Nehring et al., Reference Nehring, Gillespie, Greene and Law2021). Together, the available data make it possible to examine growth in the dairy farm sector and the financial condition of dairy farms at three points in time.
The relative strengths of each data set are relied upon in the following sections, with the Organic Survey used to trace farm sector growth and the ARMS used to track changes in economic performance. And because of the different methodologies for data collection, when both are used, we look for consistency in trends in the two sources (see Appendix for discussion of differing methodologies).
Timeline of the market and regulatory environment: 2005–2022
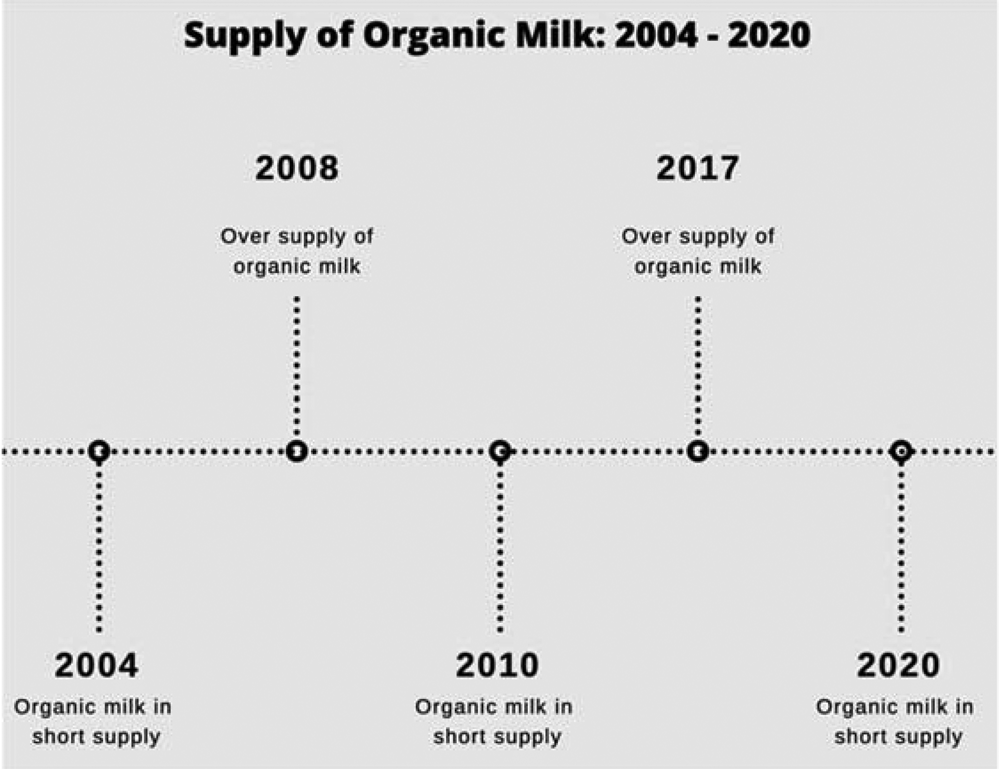
The market and regulatory environment have evolved since 2005, with key moments highlighted in Table 1 and Figure 1. In 2005, the organic dairy sector at the retail and the farm level was expanding, with organic milk in short supply. Store brand organic milk was available in mainstream supermarkets, as Aurora Dairy (located in the West) began supplying retailers such as Target, Costco and Walmart in 2004 (Su et al., Reference Su, Brown and Cook2013). In 2005, private label milk comprised about 20% of retail sales in supercenters, such as Target, Walmart and Costco (Jaenicke and Carlson, Reference Jaenicke and Carlson2015). Organic milk was in short supply during this time (see Fig. 1). On the regulatory front, after the 2005 decision in the ‘Harvey’ case, USDA changed the regulation to require 100% organic feed for transitioning dairy cows.
Marketing and regulatory environment for organic fluid milk, and data availability
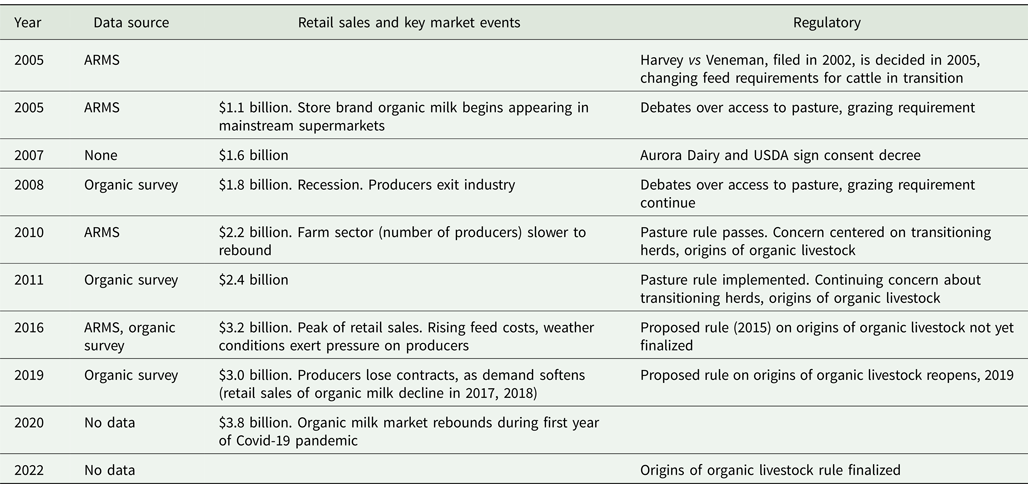
Supply of organic milk: 2004–2020.
Source: Authors' interpretation of events.
By 2008, the US economy was in a recession, which was a challenging time for organic dairy farmers. Processors reduced the number of contracts and quota during the recession, due to the oversupply of organic milk in the market (Su et al., Reference Su, Brown and Cook2013), forcing some organic dairy producers to leave the sector (Greene and McBride, Reference Greene and McBride2015). The share of private label milk in 2008, based on retail sales data, increased to 50% of organic milk sales in supercenters (Jaenicke and Carlson, Reference Jaenicke and Carlson2015). The shift from higher priced branded organic milk to lower priced store brand milk is not surprising, given the financial constraints faced by consumers due to the recession. Legislatively, at this point, access to outdoors and pasture requirements were still under discussion.
In 2010, the US economy had emerged from the recession. Consumer demand for organic milk rebounded in 2010 but the supply side was slower to respond (Greene and McBride, Reference Greene and McBride2015). Organic milk was in short supply, as producers were slow to reenter organic milk production. This slow response might have been the result of the time needed to transition to organic production or to increase the size of an existing organic dairy herd. From regulatory side, the final pasture rule was published in June 2010, which required compliance within one year. Thus, the 2010 farm-level data from the ARMS survey do not reflect a sector operating completely in accordance with the pasture rule.
In 2016, retail sales of organic milk peaked at $3.2 billion (in 2019 dollars) and declined to $3.0 billion (in 2019 dollars) in 2018 (USDA, ERS, 2022). Legislatively, the Pasture Rule was fully implemented. Organic industry discussions shifted to tightening up the standards regarding on the origins of organic livestock and transitioning dairy cows to organic production, as the rule was officially proposed in 2015 (NOP, 2015).
Whitewave, the owner of the Horizon brand of organic milk in 2016, was purchased by Danone in 2016. The merger drew the attention of the antitrust authorities of the Department of Justice (DOJ) (DOJ, 2017). Antitrust investigators have access to proprietary information of the firms involved in proposed mergers. According to the DOJ analysis, Horizon Organic and Organic Valley sold 67 and 16% of branded milk, respectively, accounting for 83% of the total supply of branded organic milk (DOJ, 2017). For fluid organic milk, branded and private label, the two firms had 51% of the market, with Horizon selling 41% and Organic Valley 10% (DOJ, 2017). The remaining 49% of organic fluid milk was provided by small regional dairies and Aurora Dairy (specific market shares unknown). The DOJ required Horizon to divest the Stonyfield organic brand, pointing to the potential negative impact on organic farmers in the Northeast due to reduced post-merger incentives for competition between Organic Valley and Horizon/Danone (DOJ, 2017).
A private grass-fed certification for certified organic dairies, called Certified Grass-fed Organic Livestock, was available starting in 2019 (Scully, Reference Scully2019). In 2019, retail sales of organic milk continued to decline and there was oversupply of organic milk. In 2020, private label milk comprised half of milk sales across all types of retail venues (OTA, 2021). While Aurora contributed a large portion of the private label milk, it is not possible to identify their share as Organic Valley also supplied private label milk (Su and Cook, Reference Su and Cook2015).
Legislatively, the Origin of Organic Livestock rule was finalized in 2022 (USDA, 2022).
National and regional-level changes in organic dairy production
At the market level, retail sales of organic milk rose between 2005 and 2020, even as the farm sector experienced periods of over and short supply of fluid milk. Ex ante, it is expected that growth in demand translates to increased farm-level milk production. The following examination of national farm-level data provides insight into how the farm sector, as a whole, responded to the needs of the market. Regional-level data make it possible to view distributional changes, to examine whether some regions experienced growth while others declined.
At the national level, comparing 2008 and 2019, the number of operations increased approximately 50% and the number of organic dairy cows increased about 65% (Table 2). This finding is consistent with ex ante expectations, given growing consumer demand and rising retail sales of organic milk. The number of cows per farm ranged from 109 to 117, over the four years. On-farm productivity of milk per operation increased from 2008, with the typical farm producing slightly more than 200,000 additional pounds of milk by 2019. Similarly, milk production per cow increased, and was about 1500 pounds higher in 2019 than in 2008. Industry experts suggest that higher productivity, or pounds of milk per cow, is the result of better organic dairy production practices (Whoriskey, Reference Whoriskey2017).
Organic dairy operations and milk production, national level

Notes: Data for 2014 and 2015 are not included in this table but are available from USDA.
Source: Organic Agriculture Surveys, NASS USDA.
Regional patterns reflect continued dominance of western operations
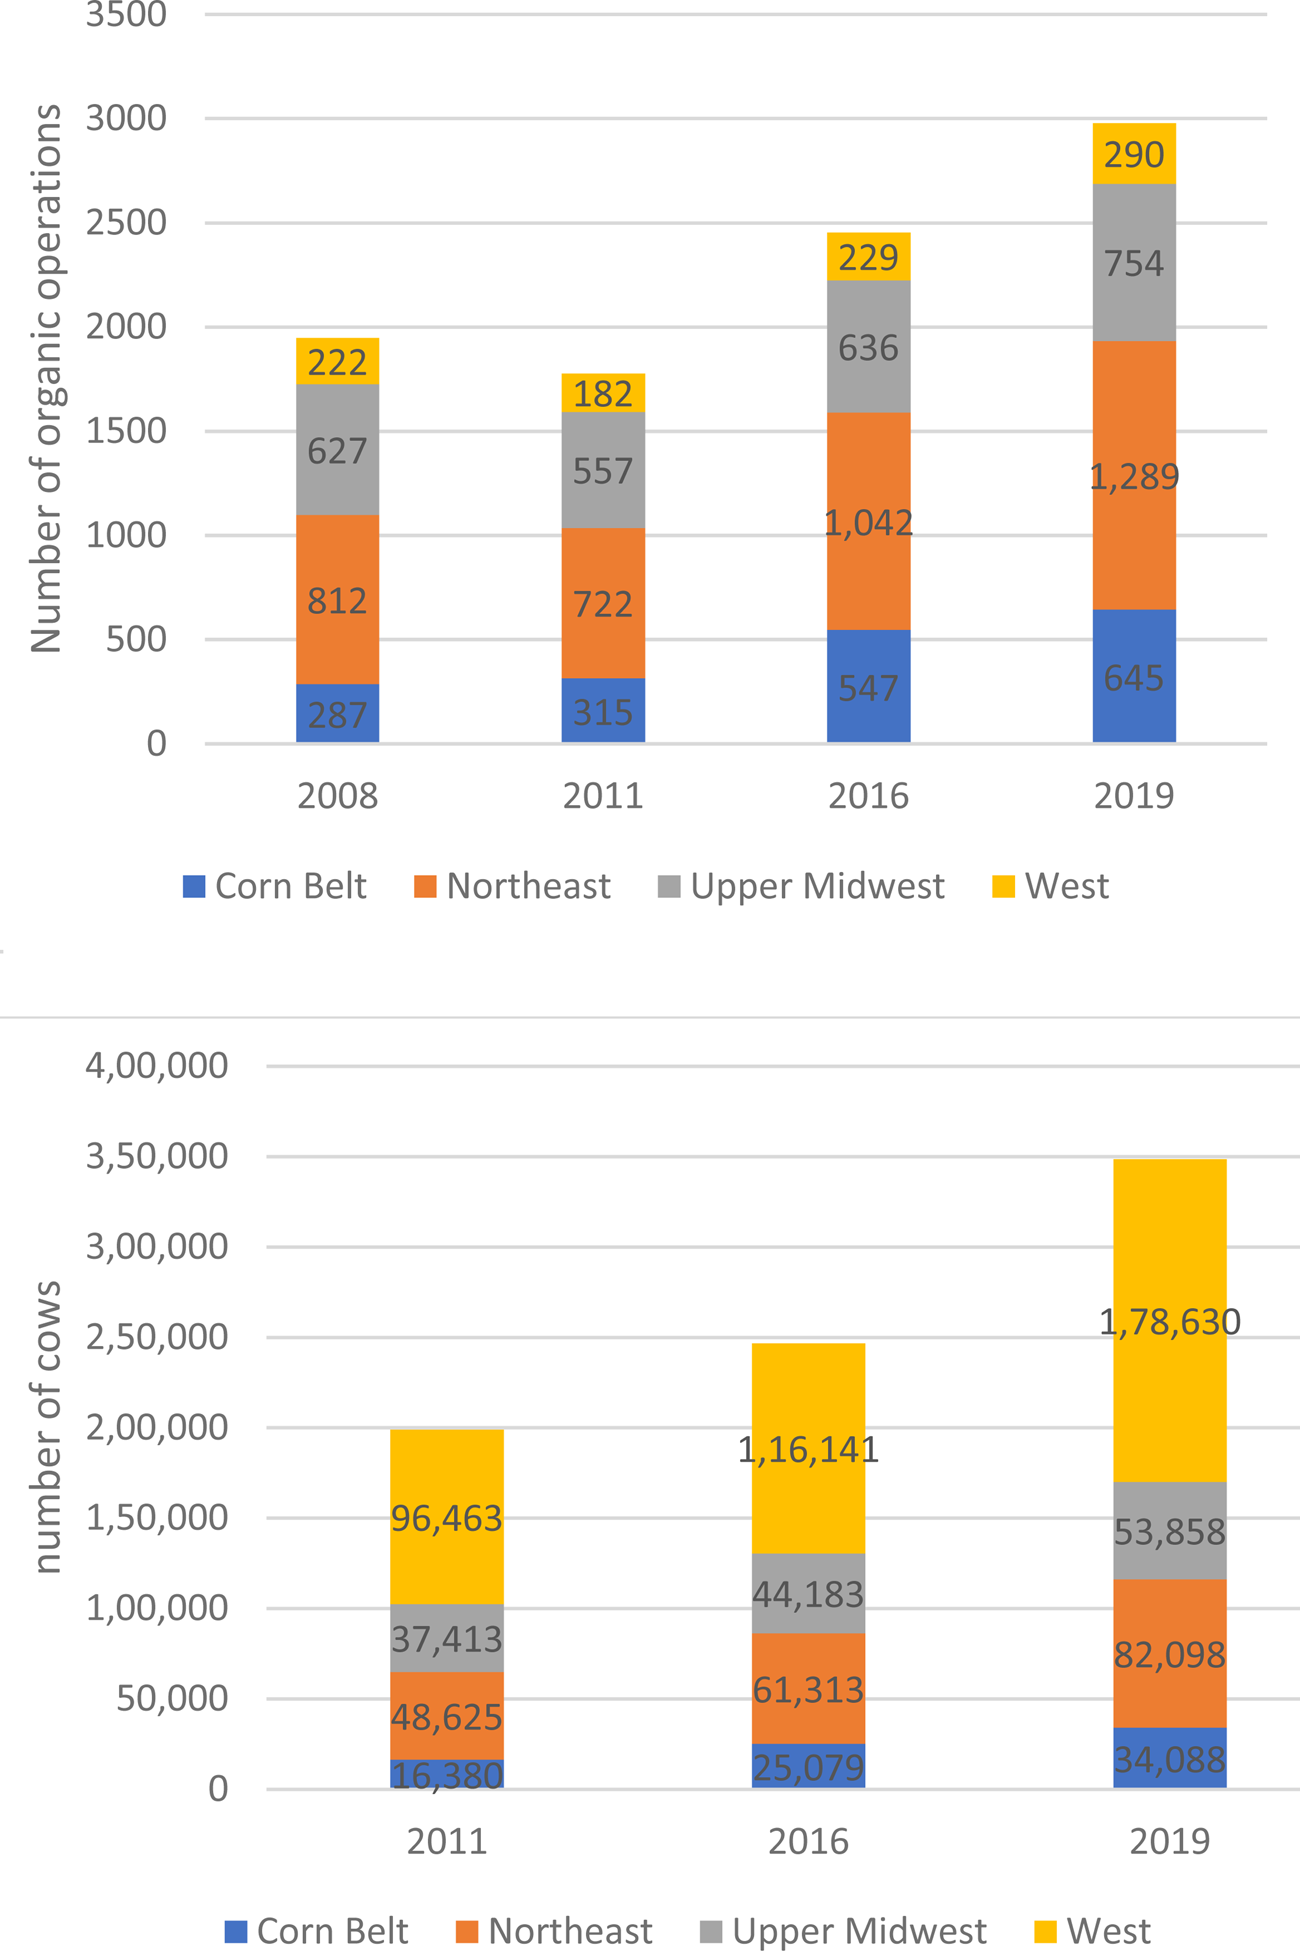
Changes at the regional level are shown in Figure 2. Comparing 2008 and 2019, the increase in the number of operations was largest in the Northeast region and the Corn Belt, with a smaller increase in the other two regions (top chart). For growth in the number of organic dairy cows, when comparing 2011 and 2019, the largest increase occurred in the West, followed by the Northeast (bottom chart).
Regional distribution of organic dairies and organic cows.
Notes: Number of cows by region is not available for 2008. The regions are defined as follows: Northeast includes Maine, Maryland, Massachusetts, New Hampshire, New York, Pennsylvania and Vermont. The Upper Midwest contains Michigan, Minnesota, Montana, Wisconsin, South Dakota and West Virginia. The Corn Belt includes Illinois, Indiana, Iowa, Nebraska, Ohio and Missouri. Finally, the West consists of California, Colorado, Idaho, New Mexico, Oregon, Texas, Washington and Utah. Data for the southern states are not reported.
Source: Organic Agriculture Surveys, NASS USDA. https://www.nass.usda.gov/Surveys/Guide_to_NASS_Surveys/Organic_Production/index.php.
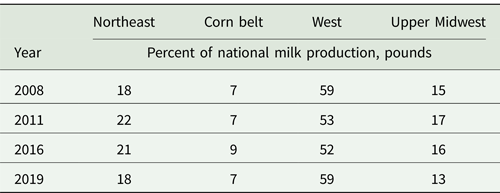
However, despite the growth of milk production and the changes within each region, over time, each region's contribution to the overall milk supply remained relatively consistent (see Table 3) since USDA began collecting organic farm-level data in 2008. The Northeast region provided between 18 and 22% of the national total, the Upper Midwest supplied between 13 and 17% and the Corn Belt contributed 7–9%. The farms in the West consistently produced more than half of the total amount of organic milk.
Production share by region: 2008, 2011, 2016 and 2019
Notes: Data for 2014 and 2015 are not included in this table but are available from USDA. Source: Organic Agriculture Surveys, NASS USDA. https://www.nass.usda.gov/Surveys/Guide_to_NASS_Surveys/Organic_Production/index.php.
Both datasets provide information that is helpful to assess growth in the number of cows and milk per farm, and productivity of organic dairy cows. Directly comparing the two data sources is not possible, so instead we look for similarities in trends, while recognizing that organic dairy farms experience yearly fluctuations in production.
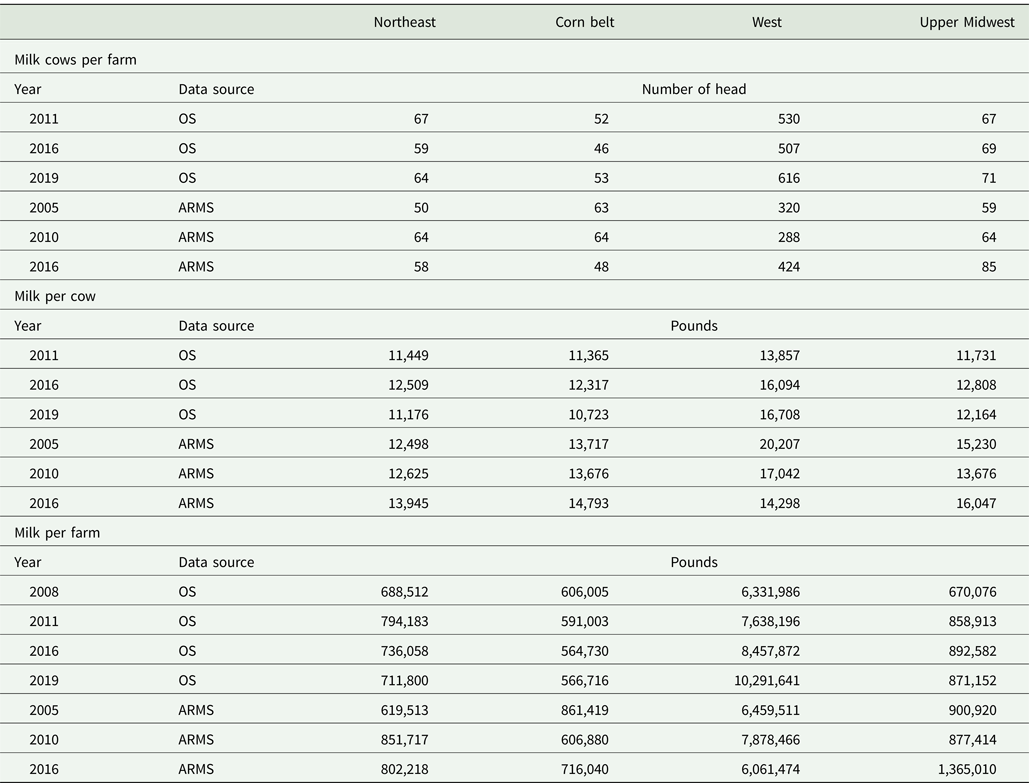
In the Upper Midwest the number of cows per farm ranged from 67 to 71, as reported by the Organic Survey for 2011, 2016 and 2019 (see Table 4). In contrast, the ARMS data find more variation in the number of head per operation, from 59 in 2005 to 85 in 2016. Similarly, the Organic Survey reports pounds of milk per cow in the range of 12,000–13,000 pounds per cow, while the ARMS reports higher productivity, in the range of 14,000–16,000 pounds per cow. Furthermore, ARMS data reflect a sizeable increase in pounds per cow (17%) and pounds per farm (55%) between 2010 and 2016. The growth shown in the 2016 data may be the result of declining relative performance of conventional/organic dairy beginning in 2014, which led some to suggest that conventional dairies convert to organic production (U of Minnesota, Undated).
Select farm-level characteristics as represented in the Organic Survey and ARMS
Notes: OS refers to Organic Survey. Data for 2014 and 2015 are not included in this table, but are available from USDA. Data on the number of cows in 2008 are not reported because of USDA disclosure requirements.
Sources: Organic Agriculture Surveys, NASS USDA. ARMS, 2005, 2010 and 2016.
The number of cows per farm in the Northeast remained small in terms of the number of head, not exceeding 67 head per operation. Milk per cow was stable, based on both sources of data. The typical farm produced fewer pounds of milk per farm after 2010 (according to the ARMS) or 2011 (Organic Survey), possibly the result of adoption of grass-fed production systems, which are concentrated in the Northeast (Niles et al., Reference Niles, Darby, Flack, Ziegler, Brito and Snider2019). In the Corn Belt, production of milk per cow, and per farm, did not substantially change during the years shown.
By all measures, the organic dairies in the West were very large in 2005 and became even larger over the next 15 years. The number of cows on the typical operation ranged from 507 to 616 (the Organic Survey). Drilling deeper, in 2019 in the Western state of Texas, the nine farms each had an average of more than 4700 cows (USDA NASS, 2022). The average number of cows per operation as reported by the ARMS was smaller, ranging between 288 and 424. The lower number of cows per operation, as reported by the ARMS, is likely the result of the sampling methodology. In 2019, compared to 2008, the typical farm produced an additional four million pounds (10.3 million pounds in 2019 vs 6.3 million in 2008). Nearly half of this increase (1.8. million pounds) occurred between 2016 and 2019.
Comparing the Western operations to those in other regions demonstrates the sizeable difference in scale. The typical dairy in the West in 2019 produced more than 14 times the amount of milk than the average dairy in the Northeast and nearly 12 times that of an Upper Midwest dairy. Even within the West, scale of operations varies: each dairy farm in Texas produced an average of 91 million pounds of milk in 2019, nearly triple the average quantity produced on each of the eight organic dairy farms in Colorado (USDA NASS, 2022).
Taken together, the two sources of data point to continued growth in the organic dairy sector in all regions, since data collection began. Most notable is the large size of the Western farms, with more cows, higher levels of milk per farm and continued growth since data collection began. Despite the growth, based on the Organic Survey data, the West's share of national production has been relatively constant.
Feed and grazing over time
An essential component of a certified organic dairy is that the cows spend time outdoors and graze on pasture. The regulation specifies that at least 30% of a cow's dry matter intake is from pasture. Organic grass-fed operations that use an add-on label of ‘grass milk’ or ‘grass fed’ have a higher requirement of 60% pasture (CCOF, Undated). The ARMS data report on the amount of pasture available and the grazing practices. The ARMS data do not differentiate between grass-fed and operations using a mixture of pasture and feed.
Feed costs and feed sources
Operators managing organic dairies balance rations through a mixture of pasture and feed, and the exact balance depends on, among other factors, the climate and the nutritional needs of the animal. Thus, the feeding approaches used by farmers in Minnesota or Vermont, where weather is cold, will differ from those adopted by farmers in Texas, where heat dominates, and those in California, which consistently experiences drought. More generally, feed requirements and milk production are related to the genetics of the dairy cow. Most breeds of dairy cows are well suited to intensive, conventional systems, while currently no breeds are specific to organic management systems (Rodríguez-Bermúdez et al., Reference Rodríguez-Bermúdez, Miranda, Baudracco, Fouz, Pereira and López-Alonso2019). Compared to a conventional farm, organic dairies may be milking older cows (Sorge et al., Reference Sorge, Moon, Wolff, Michels, Schroth, Kelton and Heins2016). Organic producers typically prefer crossbreeds, which on a conventional operation have higher feed efficiency (Heins et al., Reference Heins, Pereira and Hansen2019). Research examining the performance of crossbreeds on organic operations is scarce, and because of the importance of site specificity, Rodríguez-Bermúdez et al. (Reference Rodríguez-Bermúdez, Miranda, Baudracco, Fouz, Pereira and López-Alonso2019) suggest there is no universally best performing cow breed for an organic operation.
Feed comprises the largest share of variable costs on a dairy farm, forcing organic dairy producers to manage feed costs while ensuring they meet the regulated pasture requirements. In general, pasture is the least costly form of feed (Horner and Nilhollin, Reference Horner and Nilhollin2020). Across the nation, total feed costs were higher in each subsequent year. The cost of purchased feed per cwt of milk increased over each year, with a sizeable increase of 17% in 2016 as compared to 2010 (see table). Purchased feed comprises the largest portion of feed costs, followed by homegrown feed, while grazing contributes the smallest portion of the cost.
In the Upper Midwest and Corn Belt, the bulk of the feed is homegrown, while the Northeast dairies use a mixture of purchased and homegrown feed. For dairy producers in the West, during each of the three years (see Table 5), feed costs consist of mostly purchased feed. The differences in feed sources across the regions emerge for several reasons. The Upper Midwest and Northeast regions have suitable agronomic conditions for producing organic alfalfa, corn and soybean production, and thus are able to supply a large portion of their feed needs. Organic soybean production is concentrated in the Upper Midwest and Northeast, while organic corn production is proximate to the Upper Midwest (Hadachek et al., Reference Hadachek, Saitone, Sexton, Skorbiansky, Thornsbury and Effland2022). The large farms in the West have sizeable feed requirements, which they meet by contracting feed from local farmers or farmers in the Midwest (Whitney, Reference Whitney2022). Alfalfa, for example, is purchased from other growers, which supplements sileage grown on farm (Hadachek et al., Reference Hadachek, Saitone, Sexton, Skorbiansky, Thornsbury and Effland2022; Whitney, Reference Whitney2022).
Purchased, homegrown and grazing feed costs by region, 2005, 2010 and 2016

Notes: For 2005, total feed costs pairwise t-tests for equality revealed West and Upper Midwest, P-value = 0.00. For 2010, total feed costs pairwise t-tests for equality, Corn Belt and West, P-value = 0.02. For 2016, total feed costs pairwise t-tests for equality: Northeast and Corn Belt, P-value = 0.04; Northeast and Upper Midwest, P-value = 0.04. T-tests of the remaining pairs were not statistically significant.
Source: ARMS data, 2005, 2010 and 2016.
The only region where total feed costs per cwt increase progressively over the three years is the Northeast. High feed costs in 2016 faced by Northeastern dairies may be the result of drought, which reduced pasture and field crop yields (Lundgren, Reference Lundgren2016; Sweet et al., Reference Sweet, Wolfe, DeGaetano and Benner2017). In the other regions total feed costs in 2016 were below those in 2010. In 2005, pairwise t-tests of all pairs reveal that total feed costs were statistically different between the dairies in the West and the Upper Midwest (see note to table). In 2010, total feed costs were statistically different between dairies in the Corn Belt and the West. For 2016, pairwise t-tests of all pairs indicate that feed costs per cwt in Northeast significantly differ from those in the Corn Belt and in the Upper Midwest (see note to table). These differences highlight the effectiveness of managing feed costs according to the local environment of each farm, but also reveal the impact of adverse weather on costs incurred by dairy producers.
Pasture availability and months grazing
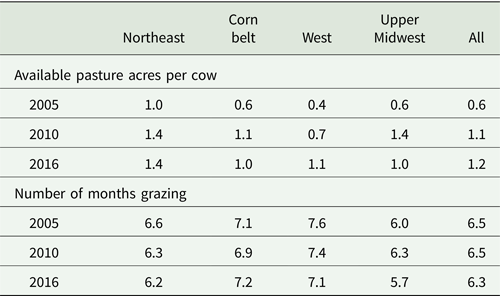
Nationwide, the average number of acres of pasture per cow was 0.6 in 2005, 1.1 in 2010 and 1.2 in 2016 (see Table 6). Farms in each region provided more land per cow in 2010 compared to 2005, yet the number of acres per cow at 0.7 in the West was approximately half of that of farms in the other regions. In 2005 and 2010, statistical tests across all pairs of regions of the pasture per cow revealed a statistical difference between each region and the West. A possible explanation for this difference is that organic dairies in regions other than the West were preparing to meet the Pasture Rule, readying for compliance in 2011. By 2016, organic dairies in all regions had increased the amount of pastureland available, and the only pair with a statistically significant difference was the Northeast and the Upper Midwest.
Pasture available and months grazing: 2005, 2010 and 2016
Notes: For pasture acres per cow, in 2005 and 2010, pairwise t-tests of equality between regions for Northeast and West, P-value = 0.02; Corn Belt and West, P-value = 0.03; and Upper Midwest and West, P-value = 0. For 2016, for Northeast and Upper Midwest, P-value = 0.03. Test for all other pairs finds no statistical significance.
Given the complexity of the ARMS data, statistical tests (similar to the t-tests used here) over time are not possible. Examining intertemporal significance, for these data, requires panel data regression analysis.
Source: ARMS, 2005, 2010 and 2016.
The number of months organic cows grazed on pasture remained relatively constant at the three points in time, approximately 6 months nationally (see Table 6). However, early discussions prior to the Pasture Rule focused on the quality of pasture, so that, on its own, time spent on pasture was not a sufficient measure. The amount of feed contributed by forage, mandated to be at least 30% during the grazing season, replaces time on the pasture with intake of feed from grazing.
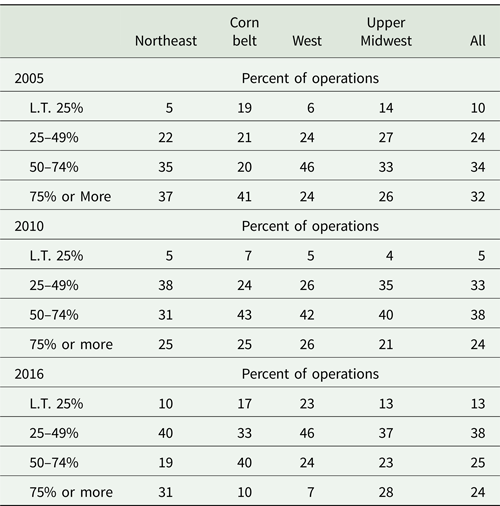
The ARMS data report the percent of forage from pasture during the grazing season in four categories: less than 25, 25–49, 50–74 and 75% or more (see Table 7). For two points in time, 2005 and 2010, the share of operations reporting a grazing share of forage of less than 25% declined nationally and for all regions (except for the Northeast, where it remained unchanged). The change may be the result of operations anticipating the Pasture Rule. At the same time, a smaller share of operations reported grazing at the upper end (75% or more) in 2010, compared to 2005, with the largest change taking place on organic dairies in the Northeast and the Corn Belt. This decline might have been a different response to the Pasture Rule, which allowed farmers to reduce grazing while remaining in compliance with the regulation.
Grazing share of forage, by regions: 2005, 2010 and 2016
Notes: 2005 Pairwise t-tests of equality for less than 25% for Northeast and Corn Belt, P-value = 0.02, Corn Belt and West, P-value = 0.04. 2016 Pairwise t-tests of equality for 50–75%: between Northeast and Corn Belt, P-value = 0.05; Corn Belt and Upper Midwest, P-value = 0.07. For 75% and greater: Northeast and Corn Belt, P-value = 0.01; for Northeast and West, P-value = 0.01. Test for all other pairs not listed finds no statistically significant difference.
Source: ARMS 2005, 2010, and 2016.
For 2016, relative to 2010, an increased share of operations reported that grazing contributed less than 25% of forage; nationally, 13% of the operations are in this category compared to 5% in 2010. The increased share of operations with less than 25 of feed from grazing occurs in every region of the country, with the greatest proportion located in the Corn Belt (17%) and West (23%). Pairwise t-tests find no statistical difference in regional differences in shares receiving less than 25% of forage from grazing in 2016.
At the same time, a smaller share of farms in the West (7%, down from 26% in 2010) and Corn Belt (10%, from 25% in 2010) reported a grazing share of forage of 75% or more. Pairwise t-tests find a statistical difference in the share of farms reporting that grazing makes up 75% or more of forage between the Northeast and West and the Northeast and the Corn Belt (see note to table).
These changes, particularly the increased share of farms reporting that less than 25% of forage comes from grazing, may be reflective of conditions specific to 2016. During 2016, conditions included unusually warm weather, drought in the West, Northeast and other parts of the country, and periods of very wet weather (NOAA, 2017).
Organic dairy financial health over time
The financial health of the dairy farm, and its response to changing market conditions, is critical to the success and viability of the operation. Several measures are used to assess financial health of organic dairy operations. The first is the revenue of the farm operation, which ARMS reports as the gross value of production per hundredweight. Next is gross value of production less operating costs, which provides insight into the amount of revenue available after covering variable costs. Finally, the profitability of the farm operation is reflected in net return on assets, defined as net farm income relative to farm assets (Hoppe, Reference Hoppe2014); the higher the net return, the more profitable is the farming operation.
Comparing the three points in time, 2005, 2010 and 2016, gross value of production increased in all regions (see Fig. 3a). The largest increase occurred on Western farms. Also noteworthy is that in 2005 and 2010, the value of milk production per cwt was highest in the Northeast, and in 2016, the value per cwt was the highest in the West. The second figure presents value of milk sold, less variable production costs, per cwt (see Appendix for data underlying the figure). This measure provides a measure of accounting profits, or the value of milk less accounting costs, and excludes the economic costs of the dairy operation (see McBride and Greene, Reference McBride and Greene2009a, Reference McBride and Greene2009b, for a discussion of the economic costs of organic dairy farming).
(a) Value of milk sold by region: 2005, 2010 and 2016. (b) Value of milk sold, less variable costs, by region: 2005, 2010 and 2016.
Note: Value of production includes the value of milk, cattle and other income. Value of milk sold, less variable costs, 2005 pairwise t-tests of equality for Northeast and Corn Belt, Northeast and Upper Midwest, Corn Belt and West, Upper Midwest and West, P-value = 0; for Northeast and West, P-value = 0.02. 2010 Pairwise tests of equality, Northeast and Corn Belt, and Corn Belt and West, P-value = 0.02. 2016 Pairwise t-tests of equality for Northeast and West, P-value = 0.01; Corn Belt and West, P-value = 0.03; Upper Midwest and West, P-value = 0.03. No statistical differences were identified in all other pairs.
Source: ARMS data, 2005, 2010 and 2016.
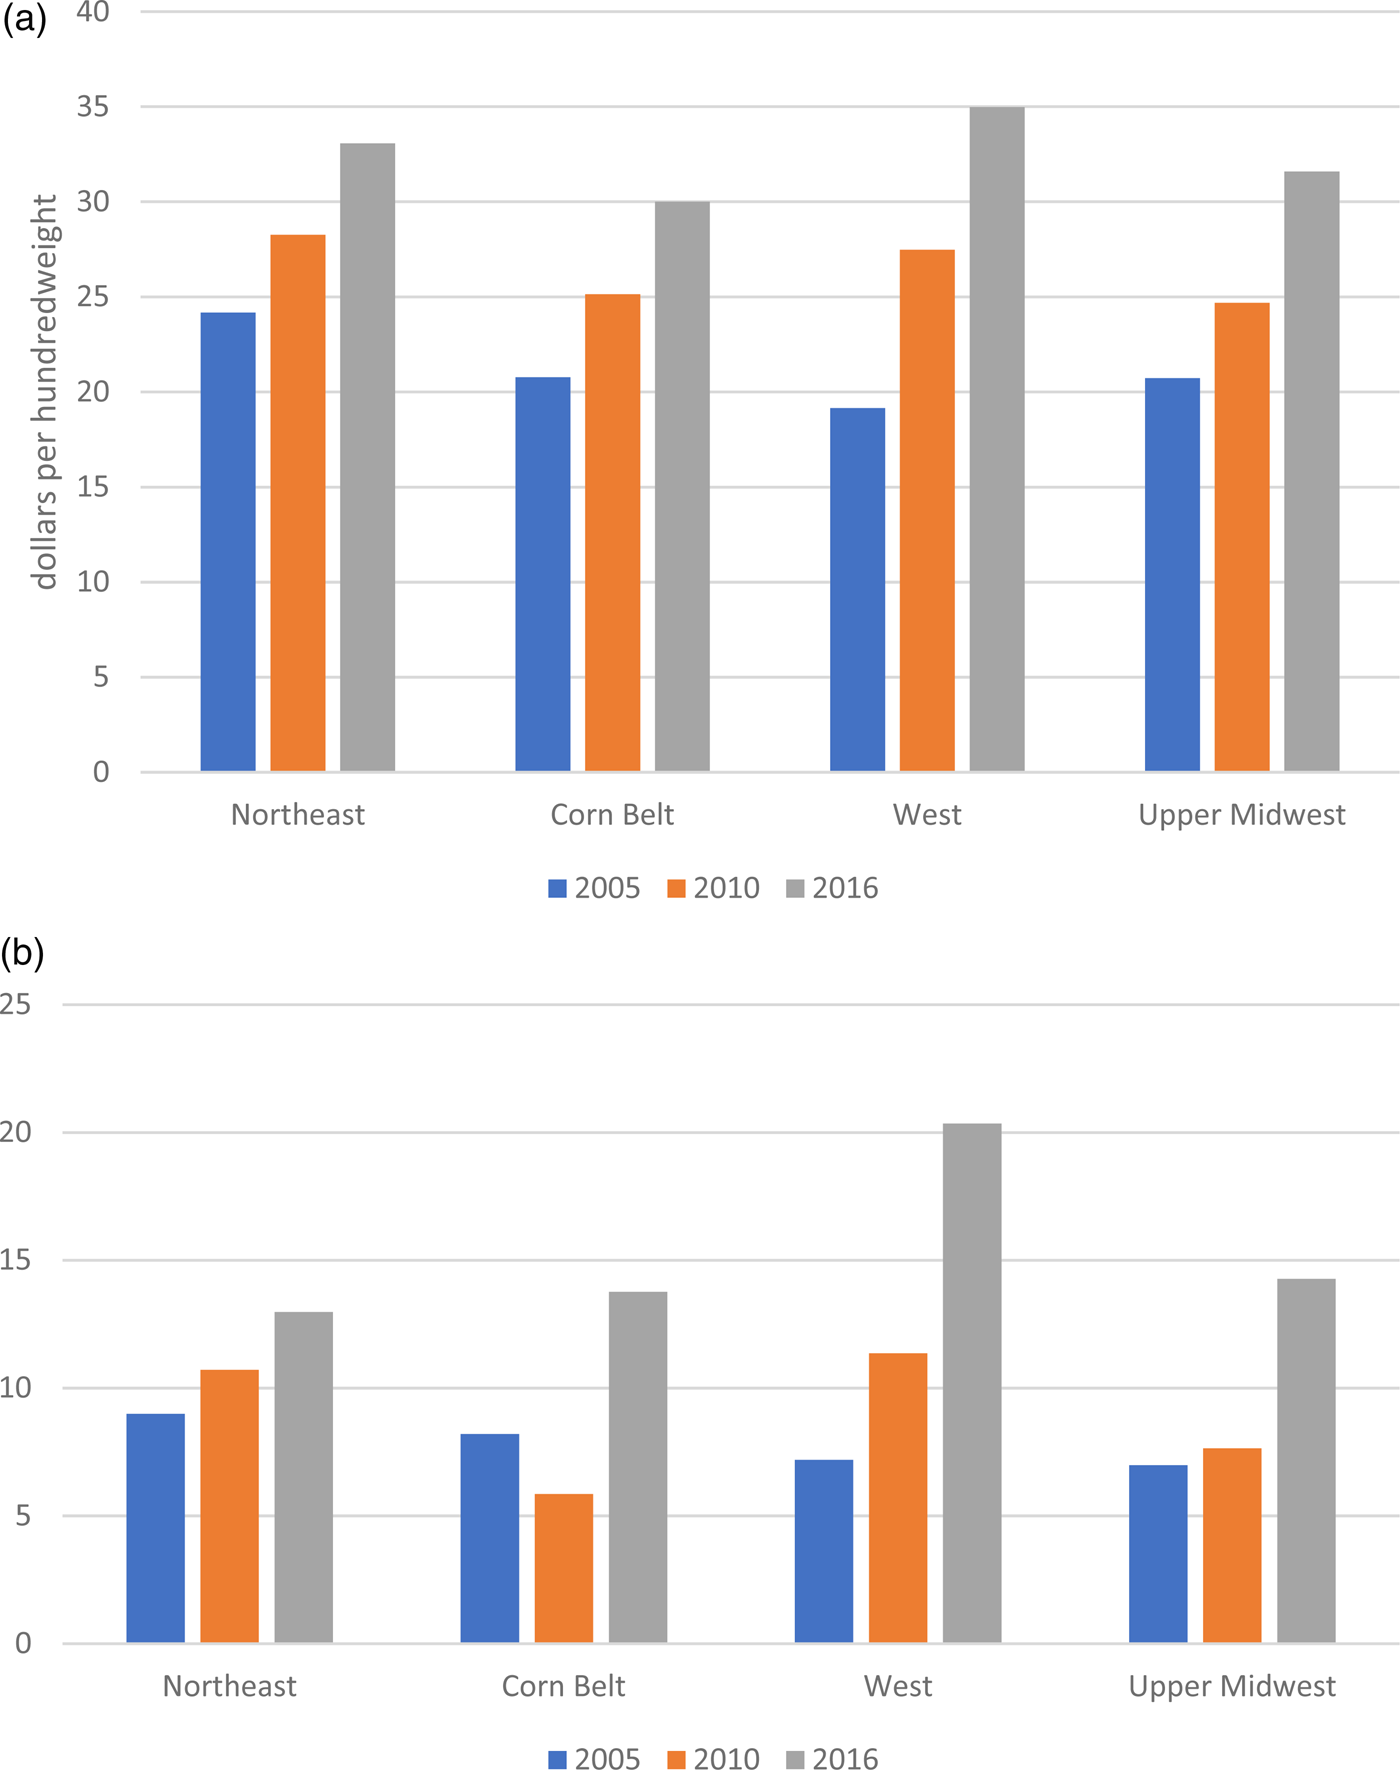
In 2005, the gross value of production less variable costs was highest in the Northeast, and lowest in the Upper Midwest. T-tests of equality, conducted pairwise across all regions, revealed a statistical difference between the Northeast and every other region (Corn Belt, Upper Midwest and West), and between the Corn Belt and West, and the Upper Midwest and West (see note to table). In 2010, statistical differences were found only between the Northeast and Corn Belt, and the Corn Belt and West. In 2016, the gross value of production less variable costs was highest in the West and lowest in the Northeast. The pairwise t-tests revealed a statistical difference between the West and each of the other three regions.
In 2016, in all regions, the production value less operating costs was higher than in 2005, but the gains were not uniform across regions (see Fig. 3b). In the West, in 2016, this measure was nearly three times higher than in 2005. In the Upper Midwest, the increase was slightly more than 100%. The organic dairies in the Northeast did not fare as well, yet the increase per cwt was close to 50%. Relative to dairies in the West and Upper Midwest, the gains were smaller in the Northeast. The change in distribution moved the Northeast, which had the highest production value less costs in 2005, to the lowest of the four regions in 2016. In 2016, the economic condition of the organic dairies in the West was remarkably better than dairies in other parts of the country. The higher economic performance of dairies in the West appears to be the result of both higher gross value of production and lower feed costs, meaning that not only are per unit costs lower but per unit revenue is higher as well. This is notable, considering that in 2005 and 2010, the performance of the organic dairies in the West was comparable to the dairies in other regions.
Rate of return on assets provides a measure of the overall profitability of a farm operation. When viewed from a national perspective, at 8% the rate of return was higher in 2016 than the 4% in 2005 and 2010 (see Table 8). Penn State extension offers 8% as the goal rate of return for dairy operations (Beck, Reference Beck2022), so using this objective measure the organic dairies were not sufficiently profitable in 2005 and 2010. However, the rate of return should be, at a minimum, above the interest rate on debt (Horner and Nilhollin, Reference Horner and Nilhollin2020).
Net return on assets by region: 2005, 2010 and 2016

Notes: Pairwise t-tests of equality: 2016 net return on assets, Northeast and West, P-value = 0.01; Corn Belt and West, P-value = 0.03; Upper Midwest and West, P-value = 0.01. For all other years, there were no statistically significant differences across pairs of regions.
Source: ARMS data, 2005, 2010 and 2016.
In 2005 and 2010, the net rate of return on assets was similar in all four regions. Pairwise t-tests of the regions for 2005 and 2010 revealed no statistical difference between any of the pairs. However, in 2016, the net rate of return on assets in the West—at 13%—was higher than in the other regions, where the return on assets was 6 or 7%; the difference between the West and each region, tested via pairwise t-tests, is statistically significant (see note to table). These regional differences likely reflect scale economies in the West, where operating costs per cwt decrease as organic dairies become larger (Nehring et al., Reference Nehring, Gillespie, Greene and Law2021). Other research using the same data find that, in 2016, the net rate of return for organic operations 75–174 head and 175 or more head was 9 and 11% (Nehring et al., Reference Nehring, Gillespie, Greene and Law2021). It is worth noting that this level of profitability exceeded the net rate of return on the largest conventional operations, with 1500 and more head per operation (Nehring et al., Reference Nehring, Gillespie, Greene and Law2021).
Trends suggested by the data
Overall, the data point to some clear trends. First, for the years covered by the available data (ARMS: 2005, 2010 and 2016, and Survey: 2008, 2011, 2016 and 2019), both the number of organic dairy farms and the amount of organic milk produced have grown in all regions of the country. The share of milk from different regions in the US has remained relatively constant since USDA first began collecting survey data on the organic sector in 2008. Feed costs may be volatile, particularly in the face of more frequent unexpected weather events, and place pressure on the economic returns of an operation. Organic dairies, on average, in all regions of the country are more than covering their operational costs. In 2016, farms in the Upper Midwest and the West earned the highest accounting profits, and the farms in the West are the most profitable.
The most notable changes took place in the West in 2016. As organic farms became larger and more efficient, in 2016, operations were notably more profitable than the organic dairies in the rest of the nation. In addition, they were as technically efficient as large conventional dairies. Industry experts suggest that rising feed costs in the West may make it challenging for the organic dairies to continue this level of profitability (Whitney, Reference Whitney2022). On the other hand, rising food prices in general may encourage consumers to substitute private label for branded organic milk, which would have an impact on the producers who supply milk that is sold under a brand.
One impact of the Pasture Rule appears to be an increase in the amount of pasture available for each cow. However, in 2016, not all operations met the required minimum 30% of forage from grazing. A possible explanation is that climate events, such as excessive rainfall or drought, affected the ability of the dairies to meet the grazing standards. This was a problem for some dairies in all regions.
Related problems are the well-known instances of fraud in the organic grain sector, where the product was not raised and distributed in compliance with the organic regulation. One high profile case includes fraudulent imported grains, which led USDA to revoke the certification of several firms in 2017 (USDA, AMS, 2017b). Equally high profile domestic cases of fraud in the organic grain sector have resulted in convictions and indictments (Nosowitz, Reference Nosowitz2020; DOJ, 2022). The incentives for fraud may be the result of the continual short supply of domestically produced organic feed grain, even during the periods when there was a surplus of organic milk. The scarcity of organic feed grain was a consequence of slow growth in certified organic grain acreage (Dimitri and Oberholtzer, Reference Dimitri and Oberholtzer2009). An estimated 7% of organic feed grain on the market was fraudulent during the 2014–2019 year period (Baker, Reference Baker2020). The widespread availability of fraudulent organic grain likely distorted the market price of organic feed grain.
Discussion
A strong concern of organic dairy producers has been that uneven application of the organic regulation, specifically regarding access to pasture, grazing and expansion of the organic herd, and herd expansion, has granted some producers a cost advantage. In many cases, the debates appear to have ended up as comparing ‘family organic farms’ in the Northeast and the Midwest with large industrial farms in the West (Scully, Reference Scully2020). There is no dispute about the differential application of the regulation, as the USDA Inspector General identified several cases where certifiers were not applying the regulation uniformly (USDA OIG, 2013). And the data support higher productivity and profitability of the Western operations, at least for 2016, as which is the most recent year for which ARMS data are available. The recent gap between the Western operations and the organic dairies in the rest of the country is large, and hard to overlook.
The questions are whether differential applications by certifiers are the driving factors behind the economic changes in the organic dairy sector and whether the slow response of the regulatory authorities provided a competitive advantage to the large-scale operations? Furthermore, do the common points of contention—such the very large farms in the West do not adhere to the standards—hold up under scrutiny? Are there other factors that have not been fully considered? We raise the following three points, all of which deserve additional attention.
Is it possible for a large dairy to comply with the grazing requirements?
The large number of cows on organic operations in the West has raised questions about whether the farms are adhering to the pasture requirements, or the other regulations regarding organic dairying (Goodman, Reference Goodman2018). More specifically, it has been said that bringing thousands of cows in from pasture twice a day for milking is nearly impossible (Scholten, Reference Scholten2014). Others, however, indicate that large organic herds can be effectively managed to meet the pasture requirements. Doing so requires a high level of skill in herd and pasture management, along with developing supporting infrastructure on the farm and an extensive record keeping system (Flack, Reference Flack2015; Moynihan, Reference Moynihan2022). Thus, it is reasonable to assume that large-scale organic dairies are able to, in principle, satisfy the pasture requirements, which are an integral part of the farm's organic systems plan.
Whether organic farms are adhering to the grazing and pasture requirements is something that needs to be verified through enforcement and inspections, rather than being dismissed outright as an impossibility. And surprise inspections, rather than planned ones, would increase the level of confidence in the outcomes of these inspections (Thicke, Reference Thicke2017). However, the findings of the 2016 ARMS survey regarding the contribution of grazed forage to feed suggest that this area warrants additional scrutiny by certifiers as they conduct their inspections of organic dairies, in all parts of the country.
The role of an oligopolistic milk processing sector
The influence of the structure in the organic dairy processing sector on the organic food system has not been sufficiently examined in the literature. Economic theory indicates that an oligopolistic structure has implications for the suppliers of organic milk as well as consumers. For organic dairy, there are also important differences in the business models adopted by the three large milk processors, scale of operations and how the relationship among the processors evolved over time. While a full analysis is beyond the scope of this paper, the broad outlines of such an analysis might proceed as follows.
In the early days of the organic sector, Organic Valley and Horizon coexisted in the market. While both maximized profits, each pursued similar goals of price stability for their suppliers. This shared goal likely had similar impacts on their costs. The pay price, which is proprietary information, received by organic dairy producers varies throughout the year, depending on the buyer, when the contract is signed and premiums offered (Miller, Reference Miller2019). Organic Valley, a farmer cooperative, publishes its farmgate prices online, which in 2021 ranged from $27.13 to $32.42 with a national average quality premium of slightly more than $2 (Organic Valley, Undated). Milk prices paid by Organic Valley and Horizon for the years 2007–2013, after accounting for premiums paid to farmers, were within $.25–$1.16 per cwt (Su and Cook, Reference Su and Cook2015).
However, once Aurora entered the market, the competitive structure in the market became more complex. The dominant milk processers were not aligned in terms of providing stable prices to farmers. And because Aurora Dairy is vertically integrated into milk production, its profit maximization decision differs. Aurora's business decisions do not reflect the desire to provide a stable price to farmer suppliers, but instead takes milk as a production cost that is under their control. This difference alone likely provides Aurora with a cost advantage.
When the Department of Justice investigated the antitrust implications of Danone's purchase of the Horizon brand, they examined the potential impact of the merger on competition between Horizon and Organic Valley. The bulk of the DOJ's attention was on the implications for farmers in the Northeast. However, the DOJ did not consider whether Horizon would change objectives, from one providing farmers with a stable price, to a brand seeking low fluid milk prices. But in 2021, the Horizon brand dropped 89 small-scale organic dairies in the Northeast, indicating they would buy from other lower cost dairies (Maltby, Reference Maltby2021). While advocates place blame on large-scale organic dairies in the West, Horizon argues that it prefers doing business with organic dairies located closer to their processing facility in Western New York State (Held, Reference Held2021). At the time of this writing, it is too soon to tell if this action is merely a shift in the location of farms Horizon contracts with, or if they will eventually replace ‘stable pricing’ with ‘low cost’ milk from large-scale dairies.
The power of the public–private partnership
Related to the regulation, the advice of the advisory board (the NOSB) was not always accepted or implemented, and when it was, the regulatory process often took many years. Because of the opportunity for public comments, there was, and remains, ample opportunity for any interested party to point out places where the regulation needed to be tightened and to encourage USDA to implement NOSB recommendations. Through public comment, many have noted when the rule-making process is taking too long. USDA's slow progress with updating the organic regulation has been a continual source of frustration for the organic industry (Walker, Reference WalkerUndated), leading to lawsuits in some instances (Crawford, Reference Crawford2017). The backlog of NOSB recommendations lacking final rules led the House to introduce the bill Continuous Improvement and Accountability in Organic Standards Act in 2021 (H.R. 2918, 2021).
The course of events illuminates the critical role of input from the organic industry and other interested parties, and the importance of addressing problems with the regulation. For the origins of organic livestock, it is not possible to ascertain from the available data how organic dairies around the nation have been expanding their herds. But given the audit report finding that some certifiers were allowing continuous conversion, now that the origins of organic livestock rule were finalized, this practice will end in the coming years. The analysis suggests that the amount of pasture available per cow did increase upon the implementation of the pasture rule (Table 5). In other words, by providing certifiers and farmers with clear guidance, tightening the regulation does have an impact on farmer practices.
Conclusion
In this paper, we sought to understand the evolution of the organic dairy sector by exploring the available data in the context of market and regulatory changes. Three factors stand out as important: (1) the vagueness of the language in the organic regulation and the challenges of making the language more specific, (2) the market forces that place pressure on dairy farmers, including those farming organically, and (3) changes in market structure at the processor level. These factors coexist with the inconsistencies across certifiers, along with other influential factors including macroeconomic conditions, consumer choices, feed costs and severe weather events such as flooding and drought.
It is indisputable that the organic dairy sector in the US has grown and that the historical economic performance of organic dairy operations in all regions was relatively equal in 2005 and 2010. However, for 2016, the large-scale organic dairies in the West, along with their store brands of organic milk, were much more profitable than those in the rest of the country. Whether the higher profitability of organic dairies in the West continues is unclear at the time of this writing.
That said, the examination of the available data, markets and discourse does not provide an answer to whether delays in implementing the Pasture Rule and the Origins of Organic Livestock gave the large-scale dairies an economic edge. However, it does raise the question of whether an important factor has been omitted from the discourse: how much influence does the market structure of the organic milk processing sector have on the profitability of organic dairy farms? To adequately address this question, the farmer–processor relationship would need to be examined using industrial organization techniques that modeled a market with a vertically integrated firm (approximating Aurora Dairy), one firm that uses quotas, and another firm that uses contracts. As the analysis examined the weight of the evidence, the key question is whether the higher profitability of large-scale organic dairies in the West and their store brands of milk is more likely the result of inconsistent certifier behavior and not the market forces that dominate modern agriculture.
Supplementary material
The supplementary material for this article can be found at https://doi.org/10.1017/S1742170522000254.
Acknowledgements
The authors thank the anonymous reviewers for helpful comments and feedback. Any remaining errors are the responsibility of the authors.
Financial support
This research was supported in part by the US Department of Agriculture, Economic Research Service. The findings and conclusions in this publication are those of the authors and should not be construed to represent any official USDA of US Government determination or policy.
Appendix A
ARMS data and Organic Survey data
Agriculture Resource and Management Survey (ARMS)
ARMS is an annual survey of all types of farms in the 48 contiguous US states, with specific questionnaires sent to producers of 2–3 specific target commodities. For the dairy survey, ARMS targeted commercial producers with at least ten cows in states accounting for at least 90% of national production. Note this targeting is for the entire dairy sector, and not specifically organic dairy. For 2005, USDA used a slightly different sampling methodology, and targeted organic operations in 19 states that were identified by organic certifying agents and organic milk processors.
The ARMS collects information on farm size and type, income and expenses, farm and household characteristics, and production practices. Commodity versions add commodity-specific questions on expenses, gross returns, production and production practices. The ARMS is a design-based survey that uses stratified sampling, so weights or expansion factors are included for each observation, allowing for the extension of results to the dairy farm population of the largest dairy states in the US. In 2005, the states included in the ARMS organic dairy dataset are California, Idaho, Indiana, Iowa, Maine, Michigan, Minnesota, New York, Ohio, Oregon, Pennsylvania, Vermont, Washington and Wisconsin. In 2010, states included in the ARMS dataset are: California, Idaho, Iowa, Illinois, Indiana, Maine, Michigan, Minnesota, Missouri, New York, Ohio, Oregon, Pennsylvania, Vermont, Wisconsin and Washington. For 2016, organic dairies were located in California, Indiana, Iowa, Maine, Michigan, Minnesota, New York, Ohio, Oregon, Pennsylvania, Vermont, Washington and Wisconsin.
The 2005 ARMS data include 348 organic dairies; the 2010 data include 594 organic dairies; and in 2016, the data include 412 organic operations. Nehring et al. (Reference Nehring, Gillespie, Greene and Law2021) note that few very large organic dairy farms are included in the dairy ARMS sample.
USDA's National Agriculture Statistics Organic Survey
The first organic survey was initiated in 2008 to support an emerging organic industry. The 2008 and 2014 organic surveys were conducted as part of the census of agriculture as special studies. These data collection efforts surveyed all known certified, exempt and transitioning organic operations in the US. The 2011, 2015 and 2016 certified organic surveys were conducted in cooperation with the USDA's Risk Management Agency in an effort to expand the number and variety of premium price elections for certified organic crops. The survey in these years was restricted to only certified organic operations in the US. The 2019 Organic Survey was a census of all known operations with certified or transitioning organic production in the United States in 2019.
The sources for the sampling frame for the 2019 Organic Survey are: the 2017 Census of Agriculture, the 2016 Certified Organic Survey, the 2019 Agricultural Marketing Service certified organic list and sources supplied by Regional Field Offices.
The 2019 survey uses a weighting methodology that includes weight adjustments for nonresponse and undercoverage. The response rate for the 2019 Organic Survey was 74%, for the 2016 Survey was 60% and 63% for the 2014 Organic Survey (USDA NASS, 2017, 2020).


 Open access

