


The largest increases in women’s candidacies for the US Congress have occurred after events demonstrating the consequences of women’s exclusion from political office. In the first “Year of the Woman” in 1992, a then-record number of women ran for Congress following the televised Senate confirmation hearings of Justice Clarence Thomas, in which an all-male, all-white committee interrogated Anita Hill about her experiences of sexual harassment. In the second Year of the Woman in 2018, a record number of women candidates emerged in the wake of Donald Trump’s election. For the first time, over half of new Democratic House candidates were women (Center for American Women in Politics 2019).
The record number of women running for Congress following the Anita Hill hearings and during the Trump era hinged on women’s absence from elected office. Yet, existing research suggests that where more women are present in politics, women will be more politically engaged (Alexander Reference Alexander2012; Atkeson and Carrillo Reference Atkeson and Carrillo2007; Barnes and Burchard Reference Barnes and Burchard2013; Campbell, Childs, and Lovenduski Reference Campbell, Childs and Lovenduski2006; Hinojosa and Kittilson Reference Hinojosa and Kittilson2020; Reingold and Harrell Reference Reingold and Harrell2010; Stauffer and Fisk Reference Stauffer and Fisk2021; Wolbrecht and Campbell Reference Wolbrecht and Campbell2007). The link between inclusion and engagement, on the one hand, and the observation that exclusion boosts women’s candidacies on the other, represents a significant puzzle in the ambition scholarship. Indeed, in distinction from the near consensus that inclusion boosts women’s political engagement, the link between inclusion and women’s political ambition receives more mixed support, both in research from the US case and beyond. Some studies show that the presence of women officeholders raises women’s political ambition (Bonneau and Kanthak Reference Bonneau and Kanthak2020; Costa and Wallace Reference Costa and Wallace2021; Ladam, Harden, and Windett Reference Ladam, Harden and Windett2018; Mariani, Marshall, and Mathews-Schultz Reference Mariani, Marshall and Mathews-Schultz2015). Others find that the election of women officeholders is not followed by the emergence of new women candidates (Broockman Reference Broockman2014; Clayton and Tang Reference Clayton and Tang2018; Foos and Gilardi Reference Foos and Gilardi2020) or that any positive relationship fades quickly over time (Gilardi Reference Gilardi2015).
Can exclusion in some instances bolster ambition? When, how, and for whom does this effect emerge? Drawing from focus groups conducted with women aspirants—as well as the rich body of scholarship on gender and political ambition (Bernhard, Shames, and Teele Reference Bernhard, Shames and Teele2021; Bos et al. Reference Bos, Greenlee, Holman, Oxley and Lay2021; Holman and Schneider Reference Holman and Schneider2018; Preece and Stoddard Reference Preece and Stoddard2015; Schneider et al. Reference Schneider, Holman, Diekman and McAndrew2016; Shames et al. Reference Shames, Bernhard, Holman and Teele2020)—we develop and test a new theory linking exclusion, policy threat, and political ambition. We posit that when gendered policy threats combine with low descriptive representation—that is, when women are confronted with the policy consequences of their exclusion—women’s political ambition will increase. By contrast, in the absence of a gendered policy threat—and consistent with standard role-model accounts—men’s overrepresentation depresses women’s interest in running for office. Our focus groups further suggest a potential mechanism underlying these results: feelings of political efficacy, or the belief that “politics is a place where someone like me can make a difference.” When women are absent from policy-making, threats to women’s rights can activate women’s sense of political efficacy and thus their political ambition.
We test our theory using survey experiments fielded via the survey firm Dynata and later replicated in the 2020 Cooperative Election Study (CES). Our vignettes vary the gender composition of a hypothetical city council (all-male or gender-balanced) as well as the issue the council will debate in the coming term: women’s reproductive healthcare (the treatment issue) or renewable energy (the placebo issue). We examine ambition using three measures: (1) interest in running for a position on the city council described in the vignette, (2) change in political ambition from pretreatment to posttreatment, and (3) a behavioral expression of ambition (clicking a link to learn more about how to run for office).
We find that women report increased ambition after reading about an all-male city council, but only when the council is poised to legislate on a women’s rights issue. When the council is debating renewable energy, men’s overrepresentation does not affect—or even depresses—women’s political ambition. Across outcome measures, there are no treatment effects among men. Further bolstering the connection between exclusion, policy threat, and ambition, we also find the strongest treatment effects among pro-choice women (i.e., among those who likely perceive cuts to reproductive healthcare as most threatening). We also find evidence consistent with our proposed mechanism: women report more political efficacy after reading about an all-male council debating women’s reproductive healthcare than in any other condition. Similarly, the treatment effects are most pronounced among women who answered a pretreatment question indicating that they would be most interested in running for office where they could “make the biggest difference.”
We also consider the possibility of heterogeneous treatment effects among women respondents along two dimensions—partisanship and racial/ethnic identity—which represent the most significant sources of variation in political attitudes and behavior in US politics. On the former, we find the strongest treatment effects among women who lean Democratic or are political independents. On the latter, we find significant treatment effects among Black women and white women, but not among Latinas. We provide additional exploratory analyses related to each set of findings.
Together, our results demonstrate that exclusion combined with gendered policy threat raises women’s interest in running for office, particularly among those who believe that they can make a difference. We build on observations from actual moments in US history when women, confronted with the consequences of their exclusion, have responded by expressing more political ambition. Our study reproduces this effect, showing that ambition is both malleable and context-dependent. When women’s policy interests are not at stake, role model effects operate as expected: women do not run when they cannot see themselves in office. Yet, when women’s policy interests are threatened, women’s underrepresentation can motivate women to run. Policy threat makes exclusion salient, inspiring some women to seek a seat at the table.
ROLE MODELS AND WOMEN’S POLITICAL AMBITION
Women are less willing to run for political office than men (Fox and Lawless Reference Fox and Lawless2005; Reference Fox and Lawless2010). Existing work explains persistent gender differences in candidate emergence through both demand- and supply-side factors, which further intersect with women’s other identities, including partisanship and race and ethnicity (Bejarano Reference Bejarano2013; Brown Reference Brown2014; Holman and Schneider Reference Holman and Schneider2018; Shah, Scott, and Juenke Reference Shah, Scott and Juenke2019; Silva and Skulley Reference Silva and Skulley2019). With respect to voters’ and party leaders’ demand for women candidates, scholars highlight the importance of efforts to recruit women (Crowder-Meyer Reference Crowder-Meyer2013; Karpowitz, Monson, and Preece Reference Karpowitz, Monson and Preece2017). They also point to potential biases that party leaders and voters may harbor against women candidates (Mo Reference Mo2015), including the public perception that women cannot win elections (Bateson Reference Bateson2020; Hassell and Visalvanich Reference Hassell and Visalvanich2019), as well as voters’ biases against politically ambitious women (Saha and Weeks Reference Saha and Weeks2020).
With respect to the supply of women candidates—meaning women’s willingness to put themselves forward for office—researchers point to gender differences in women’s nascent ambition (the desire to run for office). These works highlight gender differences in political socialization (Bos et al. Reference Bos, Greenlee, Holman, Oxley and Lay2021), women’s doubts about their own qualifications and abilities (Crowder-Meyer Reference Crowder-Meyer2020; Fox and Lawless Reference Fox and Lawless2005; Reference Fox and Lawless2010; Preece Reference Preece2016), and aversion to competition (Kanthak and Woon Reference Kanthak and Woon2015; Preece and Stoddard Reference Preece and Stoddard2015). Supply-side research also emphasizes how structural and societal barriers keep ambitious women from running, including familial, financial, and care-taking obligations (Bernhard, Shames, and Teele Reference Bernhard, Shames and Teele2021; Silbermann Reference Silbermann2015), women’s underrepresentation in pipeline professions (Thomsen and King Reference Thomsen and King2020), and gendered and sexist media coverage (Haraldsson and Wängnerud Reference Haraldsson and Wängnerud2019). Even when women have high nascent ambition, these barriers can limit their expressed ambition (whether or not they actually run).
Particular attention has been paid to how role models—women politicians with whom potential aspirants can identify—shape the supply of women candidates. This research builds on scholarship demonstrating that exposure to women officeholders boosts women’s political engagement. When surveyed, for example, American women are more knowledgeable than men about women’s descriptive representation (Dolan Reference Dolan2011), suggesting that they are more attentive to women’s representation. Women living in districts with more women representatives also have higher levels of political participation and efficacy (Atkeson and Carrillo Reference Atkeson and Carrillo2007; Burns, Schlozman, and Verba Reference Burns, Schlozman and Verba2001; Fridkin and Kenney Reference Fridkin and Kenney2014). These results hold not only in the United States (US), but also across cases worldwide (Alexander Reference Alexander2012; Brulé Reference Brulé2020; Dassonneville and McAllister Reference Dassonneville and McAllister2018; Hinojosa and Kittilson Reference Hinojosa and Kittilson2020; Wolbrecht and Campbell Reference Wolbrecht and Campbell2007).
Building on the findings concerning women’s engagement, scholars posit that role model effects may also apply to ambition. Focusing on the US from 1978 to 2012, Ladam, Harden, and Windett (Reference Ladam, Harden and Windett2018) show that the presence of women governors and senators is positively associated with the emergence of new women candidates for state legislatures. This role model effect is most pronounced among Democratic women (Bonneau and Kanthak Reference Bonneau and Kanthak2020; Manento and Schenk Reference Manento and Schenk2021; Mariani, Marshall, and Mathews-Schultz Reference Mariani, Marshall and Mathews-Schultz2015). Work examining the use of role models in campaign trainings for women also points to the positive effects of “presenting women who are perceived to be both strong and successful[…] in politics” and who “inspire confidence that their success is achievable” (Sweet-Cushman Reference Sweet-Cushman2018). Other studies from the US, however, yield mixed or null results. Manento and Schenk (Reference Manento and Schenk2021) find support for role model effects for Democratic women, but find the opposite effect among Republicans. Using a regression discontinuity design, Broockman (Reference Broockman2014) notes that contrary to prevailing expectations, the election of women to US state legislatures has no effect on other women’s candidacies.
These mixed findings suggest that role model effects are context-dependent: sometimes descriptive representation bolsters women’s ambition, but sometimes it does not. They are also consistent with research critiquing treatments of political ambition as a fixed character trait. This work conceptualizes women’s political ambition as situational, relational, and responsive to changes in the political context and in prospective candidates’ own lives (Carroll and Sanbonmatsu Reference Carroll and Sanbonmatsu2013; Schneider et al. Reference Schneider, Holman, Diekman and McAndrew2016; Shames Reference Shames2017). For instance, women’s ambition responds to framing, with more women expressing interest in running when political office is presented as advancing communal goals, such as helping others (Schneider et al. Reference Schneider, Holman, Diekman and McAndrew2016).
Women’s ambition also increases when women are faced with pressing policy issues related to gender or the intersection of gender and race or ethnicity (Carroll and Sanbonmatsu Reference Carroll and Sanbonmatsu2013; Dittmar, Sanbonmatsu, and Carroll Reference Dittmar, Sanbonmatsu and Carroll2018; Dowe Reference Dowe2020; Silva and Skulley Reference Silva and Skulley2019). Work on women’s candidacies following Trump’s election suggests that urgency, anger, and threat motivated women to enter the 2018 congressional races (Dittmar Reference Dittmar2020). More generally, the social mobilization literature links political action on behalf of descriptive group membership to fears about losing rights or declining group safety. This effect holds among women broadly and women of color specifically (Dowe Reference Dowe2020; Silva and Skulley Reference Silva and Skulley2019; Thomas and Wilcox Reference Thomas and Wilcox2014), as well as among senior citizens (Campbell Reference Campbell2003) and Black, Latinx, and Arab Americans (Anoll and Israel-Trummel Reference Anoll and Israel-Trummel2019; Cho, Gimpel, and Wu Reference Cho, Gimpel and Wu2006; Nichols and Valdéz Reference Nichols and Valdéz2020; Scott and Collins Reference Scott and Collins2020).
Drawing on scholarship that emphasizes the malleability of women’s political ambition and the importance of context, we examine whether and when women’s exclusion from elected office bolsters women’s political ambition. In the public imagination, descriptive and substantive representation tend to be linked. Citizens believe that policies better reflect women’s interests when women are involved in the policy-making process (Clayton, O’Brien, and Piscopo Reference Clayton, O’Brien and Piscopo2019). Given the public perception that women’s interests are not represented in all-male groups, and that policy concerns can motivate some women to run for office, we posit that the combination of exclusion and policy threat together can raise women’s political ambition. That is, when political events make the consequences of women’s exclusion salient, some women become more interested in pursuing elected office.
THEORIZING AMBITION USING FOCUS GROUPS
We use focus groups to develop a theory of women’s political ambition that can explain major jumps in women’s candidacies, such as those that occurred during the 1992 and 2018 Years of the Woman. Specifically, to better understand the motivations of women candidates in these moments, we conducted three focus groups with women political aspirants between March and August 2018. Participants were recruited using the snowball method, beginning with graduates of local chapters of Emerge America, the largest and most comprehensive training program for Democratic women candidates in the US (see Bernhard, Shames, and Teele Reference Bernhard, Shames and Teele2021).
The first two groups brought together women who either enrolled in or expressed interest in an Emerge candidate training program after 2016. Participants ranged in age from mid 20s to early 50s, and included white women, women of color, and women identifying as queer. All were Democrats. One group occurred in Nashville, Tennessee and the other in Los Angeles, California. The third focus group consisted of women leaders of undergraduate political groups in Nashville who indicated an interest in running for political office in the future, and included some women who identified as Republican and/or conservative. In total, 16 women participated across the three groups. All participants were told in advance that the focus groups aimed to understand women’s interest in running for office, so no deception occurred, and all participants gave consent (with no consent withdrawn during or after the groups). Participants were compensated with Amazon gift cards for their time. For more details about our human subjects protections, see Sections E and F of the Supplementary Material.
The focus groups aimed to generate theory about descriptive representation and women’s political ambition, particularly in the aftermath of the 2016 election. All groups opened by asking participants to discuss when they first expressed interest in politics and to describe their current levels of political activity and interest in running for office. The focus groups in Nashville occurred first, and after the opening questions, participants were shown the images from our experimental vignettes: the all-male and gender-balanced groups of politicians discussing a women’s rights policy. The focus group in Los Angeles happened second, and building upon the Southern group’s conversations, the West Coast participants were shown real images meant to convey exclusion absent a policy cue (Hillary Clinton’s concession speech), exclusion coupled with policy threat (the all-male Freedom Caucus convened by Vice President Mike Pence to discuss repealing the Affordable Care Act; see Figure 1), and inclusion absent a policy cue (a group photo of women serving in the 2016–18 Congress). Even though images varied across the groups, participants in all groups were invited to reflect on their reactions to seeing women’s exclusion from politics, to seeing groups of all-male lawmakers debating women’s policy interests, and to seeing women role models.
Image Shown to Focus Group Participants. Vice President Mike Pence Meets with the Freedom Caucus on March 23, 2017 to Discuss Repealing Provisions of the Affordable Care Act, Including Maternal Health and Birth Control Coverage

In the opening discussion, participants explained that the 2016 election increased their political ambition and motivated them to find ways to make a difference because the men, in the words of one Southern participant, “had screwed it all up.” A Los Angeles participant described how she wanted to figure out what to do, and so she visited the webpage for her Southern California city and was surprised to see that they were all men. She recounted her reaction: “Seven men, really? I started telling other women how we were under-represented on city council, and they all said I should run.” More generally, the Trump era changed women’s political calculations. One Los Angeles participant expressed the sentiment that Trump even changed how she viewed her own qualifications, noting that his inexperience and boorish character eased her worries that she was not prepared enough to run.
Turning more explicitly to the drivers of exclusion and policy threat that motivated our study, a Southern participant reflected that the Trump-era policies had deepened women’s desire to run for office, “just because we can see how we can make a difference.” A participant in the Southern student group described her reaction to Trump’s win: “I wasn’t just going to sulk in misery because that wouldn’t do anything[…] and I wasn’t going to accept it for what it was, so the only other option was to do something.” One West Coast participant pointed to the Freedom Caucus photo and said, “This is the fire in my belly.” A participant in the Nashville aspirant group in fact also used this phrase:
It was really the aftermath of the election of Donald Trump, as it began to settle in… I felt myself saying, “I don’t have a choice, I have to run.” It’s like a fire in my belly that’s not going to go away if I don’t stand up as a woman and someone who has thought about it before. If not now, when? And if not me, who?
Yet, neither exclusion nor inclusion alone motivated our participants. The Los Angeles participants were asked to select which image best captured why they wanted to run for office. Here, participants did not feel galvanized when viewing Clinton’s concession speech; instead, when exposed to this message of pure exclusion, they felt demoralized or resigned. Participants also felt disconnected from the images showing inclusion. They did not feel inspired by the current congresswomen, even though this image offered role models. One commented that “they look older than me,” so she could not see herself as part of this group. In the Southern aspirant group, a participant saw the gender-balanced group of politicians not as role models, but as policy-makers, recalling that women in Congress “are doing good work” and “I don’t need to get in there and help them.” The participant contrasted the gender-balanced group with the all-male group, saying of the all-male group, “that’s when I feel I need to get in there and fix it.” Similarly, another Nashville aspirant contrasted the all-male image with the gender-balanced image and said of the all-male image, “This photo doesn’t make me feel like politics is inaccessible. This photo makes me want to get involved because women need to be cut and pasted into this situation.”
Overall, women aspirants confronted with exclusion responded with a powerful desire to represent their own interests in office. The photos of the all-male groups activated indignation, which stemmed from their sense that the all-male group would not get women’s interests “right.” Women participants explicitly connected men’s overrepresentation to anti-feminist behavior and policy outcomes. A participant from the student group wondered, “How many of these guys have sexually harassed women in the workplace?” Another participant commented, “But having eight men make a decision like this [about reproductive rights] feels like [an] assault.” Women generally expressed a strong consensus that they did not trust all-male groups to make “correct” policy choices on issues that pertain to women’s lived experiences.
Importantly, it was the consequences of exclusion, rather than exclusion itself, that most motivated focus group participants. Neither exclusion nor policy threat alone seemed sufficient to bolster ambition. More broadly, most Americans misestimate how many women are in elected office (Stauffer Reference Stauffer2021). And, even if citizens—like our focus group participants—know that women are underrepresented, most political institutions across time and space have been occupied largely by men and most have adopted policies without considering women’s interests. The gender gap in political ambition exists within this “steady state” of women’s descriptive and substantive underrepresentation. Thus, rather than the presence of exclusion or threat alone bolstering ambition, it is when women are confronted with the negative consequences of their exclusion that we observe significant increases in women’s political ambition.
HOW EXCLUSION AND POLICY THREAT SHAPE AMBITION
Our focus groups centered our attention on the combined effects of exclusion and policy threat and shaped our central expectation: being confronted with the policy consequences of exclusion can increase women’s political ambition. This central expectation yields three observable implications to be tested via survey experiments.Footnote 1
First, effects should be concentrated on gendered threats. We expect that policy threat has mobilizing effects when respondents can clearly see the need for women’s perspectives in the decision-making process. That is, ambition should increase when women think that women’s presence in politics will advance women’s policy interests (Clayton, O’Brien, and Piscopo Reference Clayton, O’Brien and Piscopo2019; Mansbridge Reference Mansbridge1999). Exclusion in the absence of a direct policy threat, on the other hand, should either have no impact on women’s political ambition or may even have a demobilizing effect. Thus, even when considering an all-male legislative body, a generalized (i.e., nominally non-gendered) policy threat will not increase women’s ambition.
Second, increased ambition should occur only when a gendered policy threat combines with women’s underrepresentation. A gender-balanced political body does not suggest that women’s voices were excluded from the decision-making process, and thus does not signal the need for women’s inclusion in the same way as an all-male group. We expect that a gendered policy threat increases women’s political ambition only when women are excluded from elected office. Thus, a gender-balanced legislative body will not increase ambition, even when considering a gendered policy threat.
Third, we expect that these effects should hold only among women. Of course, women are a diverse group, and not all women agree on their policy preferences or political priorities (Beckwith Reference Beckwith, Escobar-Lemmon and Taylor-Robinson2014; Celis and Childs Reference Celis and Childs2012; Smooth Reference Smooth2011). At the same time, the link between women’s descriptive and substantive representation persists in the public imagination (Mansbridge Reference Mansbridge1999). That is, citizens assume that women in politics are more likely to champion “women’s issues.” Women also have a stronger preference for descriptive representation (Dolan and Lynch Reference Dolan and Lynch2015; Montoya et al. Reference Montoya, Bejarano, Brown and Gershon2021) and report feeling more strongly about gender equality issues than men (Horowitz and Igielnik Reference Horowitz and Igielnik2020). While we theorize about potential differences in treatment effects among women below, our expectation is that, on average, treatment effects should only be detectable among women. Thus, when combined with a gendered policy threat, the exclusion of women from elected office will increase women’s political ambition, but will not increase men’s ambition.
Increased Efficacy as a Source of Political Ambition
Our focus groups provided our central expectation—exposure to the policy consequences of exclusion can increase women’s political ambition—and observable implications. They also suggest a potential mechanism underlying this effect: increased political efficacy. Exclusion paired with policy threat increased our focus group participants’ ambition because they sensed that political outcomes would be different if women like them were present in decision-making institutions.
Participants placed particular importance on the idea that “politics is a place where someone like me can make a difference.”Footnote 2 Congressmen rolling back women’s rights increased women’s feelings that they needed to “take things into their own hands” (Southern participant). Indeed, women in our focus groups spoke of needing to add women’s perspectives “because there aren’t enough women in office to initiate these processes” (West Coast participant). The respondents’ emphasis on efficacy is consistent with existing work suggesting that women express greater political ambition when political careers are framed as achieving communal or issue-based goals (Schneider et al. Reference Schneider, Holman, Diekman and McAndrew2016) and when they perceive that they can influence urgent and important policy agendas (Dittmar, Sanbonmatsu, and Carroll Reference Dittmar, Sanbonmatsu and Carroll2018). In 2018, women candidates for the US House routinely framed their bids in terms of “someone needing to do something” (Dittmar Reference Dittmar2020). Our focus group participants echoed this sentiment.
We thus expect that when coupled with gendered policy threat, women’s exclusion from politics increases women’s political ambition by increasing their political efficacy. Women respondents should be more likely to report that they could make a difference in politics after exposure to a group of men legislating on women’s rights, as compared to both a gender-balanced group debating the same issue and a group of men discussing a generalized policy threat.
Variation among Women
On average, being confronted with the policy consequences of exclusion will increase women’s political ambition. Yet, not all women interpret exclusion and policy threat in the same way. We expect variation among respondents regarding their preferences for descriptive representation and their concern with gendered threats, which moderate the effects that we outline above. We consider the possibility of heterogeneous treatment effects along two key dimensions structuring women’s relationship with politics: partisanship and race/ethnicity. We focus on these two sets of characteristics because an expansive literature identifies partisanship and race/ethnicity as significant sources of variation in political attitudes and behavior in US politics, including (and especially) among women (e.g., Barnes and Cassese Reference Barnes and Cassese2017; Brown Reference Brown2014; Klar Reference Klar2018; Silva and Skulley Reference Silva and Skulley2019; Smooth Reference Smooth2011).Footnote 3
Partisanship
Drawing from real-world moments and our theory about what happens when the policy consequences of exclusion become salient, we expect that effects should be most pronounced among Democratic women. First, Democratic women express a greater preference for descriptive representation than Republican women (Thomas Reference Thomas2019). Democratic women may therefore be more inspired than Republican women to remedy women’s underrepresentation by running for office themselves. Second, the Democratic Party has a stronger track record of feminist policy outcomes, and Democratic women (both as citizens and as officeholders) tend to hold more progressive views on women’s rights than Republican women (Klar Reference Klar2018).
Democratic women may therefore be particularly motivated to change policies that harm women’s rights. For example, the photo of the all-male Freedom Caucus was deployed by EMILY’s List in the 2018 elections.Footnote 4 That a well-known and influential fundraising group for pro-choice Democratic women candidates also selected this image speaks to the message it evokes: while Democratic women are not going to join the Freedom Caucus or add diversity to the Republican party, the photo reminds them that their presence can shift the larger policy agenda. We thus hypothesize that when combined with a gendered policy threat, the exclusion of women from elected office will increase Democratic women respondents’ political ambition more so than Republican women’s ambition.
Race and Ethnicity
Women’s political ambition also varies by race and ethnicity (Holman and Schneider Reference Holman and Schneider2018; Shah, Scott, and Juenke Reference Shah, Scott and Juenke2019; Silva and Skulley Reference Silva and Skulley2019). Messages about women’s underrepresentation tend to resonate differently among different groups of women. For example, Black women, but not white women or Latinas, tend to express more political ambition after reading that resource deficits explain women’s political underrepresentation (Holman and Schneider Reference Holman and Schneider2018). This framing about structural obstacles may motivate Black women who see their participation as important despite, or even because of, such obstacles (Dowe Reference Dowe2020). Indeed, Black women are overrepresented in social movement organizations dedicated to closing gaps in political participation, and Black sororities significantly bolster members’ political engagement and ambition (Brown and Lemi Reference Brown and Lemi2021, 95–100).
Our theory about the combined effects of exclusion and policy threat offers competing expectations for the political ambition of women of color. On the one hand, Trump’s election boosted the political engagement of Black women (Lopez Bunyasi and Smith Reference Lopez Bunyasi and Smith2018) and Latinas (Sampaio Reference Sampaio2019). This suggests that women of color may find messages about exclusion coupled with policy threat especially mobilizing. On the other hand, women of color more regularly experience exclusion and policy threat, and the consequences of exclusion motivated women of color to run for office well before Trump. Since women of color are more acutely aware that the political system is biased, key moments like the Hill hearings or the Trump presidency may be less shocking, and therefore less mobilizing, for this group (Dittmar Reference Dittmar2020). Put another way, although exclusion and policy threat may be more deeply felt among women from marginalized racial and ethnic groups, they might also be more regularized experiences, thereby reducing treatment effects.
Adding further complexity, gendered policy threats can also have racialized dimensions. Consider, for instance, reproductive healthcare (the issue featured in our treatments below). Women of color face unique barriers when accessing healthcare, including underfunded services and racial discrimination from providers (Feagin and Bennefield Reference Feagin and Bennefield2014). These structural obstacles could make policy threats related to reproductive health especially motivating for women of color.
Likewise, when women of color consider running for office, they observe not only the gender makeup of political institutions, but also the racial composition of these decision-making bodies. Our treatments, for example, rely on images of real politicians on a hypothetical city council. Furthermore, across treatment conditions, the politicians featured are mostly white.Footnote 5 The majority-white composition of the council produces a different test for women of color compared with white women. For Black and Latina women, the two largest racial/ethnic minority groups in our sample, we are testing whether respondents are more mobilized by an all-male city council compared with a gender-balanced council even when most council members are white. Since Black and Latina women feel best represented by candidates who share both their gender and their race or ethnicity (Montoya et al. Reference Montoya, Bejarano, Brown and Gershon2021), we may be less likely to observe treatment effects among these women. That is, Black and Latina women might report low ambition in both the all-male and gender-balanced conditions given the majority-white composition of both groups.
Taken together, our theorizing recognizes that intersectionality matters for understanding political ambition, but offers divergent expectations about how women from different racial or ethnic groups will be mobilized by the joint effects of exclusion and policy threat. We thus expect that gendered policy threat and women’s exclusion affect women’s ambition differently, depending on their race and ethnicity.
AN EXPERIMENTAL DESIGN TO EXAMINE POLICY THREAT AND EXCLUSION
We test our theory of exclusion and policy threat via a survey experiment in which we control both the makeup of the decision-making body and the issue under discussion. An experiment allows us to causally isolate the effects of two factors on respondents’ political ambition: (1) gendered versus more generalized policy threats, and (2) high versus low levels of women’s descriptive representation. In observational work, it is difficult to disentangle whether women officeholders motivate women to run for office or whether electorates with many ambitious women are more likely to elect women to office in the first place. Studies that take advantage of policy experiments or as-if random variation in women’s representation can alleviate many of these concerns. Yet, real-world scenarios rarely, if ever, offer situations where both policy threat and descriptive representation vary randomly. We need an approach that varies both, and survey experiments are ideal for this purpose.
Our design asks respondents to read one of four short newspaper articles about a city council that is up for reelection. The articles vary on two dimensions. First, we vary the gender composition of the hypothetical eight-member city council: either it consists of only men or of four men and four women.Footnote 6 The article includes a headline and photos of the eight legislators (either all men or equal numbers of men and women).Footnote 7 We use photos in order to ensure that respondents receive the treatment (i.e., that they are aware of the gender composition of the council) and to capture the real-world setting where news reports and social media use images of all-male decision-makers to emphasize women’s exclusion, especially when women’s rights are at stake.
Second, we vary the policy area on which the city council will legislate following the election. All vignettes explain that the city council is considering a 50% reduction in city spending, but we vary whether that reduction applies to a gendered issue area—women’s reproductive health clinics—or to an issue area that is not overtly gendered—renewable energy projects. The vignettes describe a city council race, in order to create a plausible scenario that would resonate with respondents irrespective of their actual congressional district.
We measure political ambition in three ways. First, we measure respondents’ expressed interest in pursuing a position on the city council described in the vignette. We also capture within-respondent changes in nascent political ambition by asking respondents to state their interest in running for office both pretreatment and posttreatment. Finally, we include a behavioral measure associated with political ambition: clicking on a link to learn more about how to run for office.
Since our theory builds inductively from our focus groups, which themselves explored women aspirants’ reactions to Trump’s 2016 victory and the ensuing policy threats, we designed our treatment with Democrats in mind. Our policy threat conditions focus on two issues, reproductive health and climate change, over which Democrats exercise considerable ownership. Importantly, while renewable energy is not overtly gendered—it is related neither to women’s rights nor women’s socialized roles as family caretakers (see Beckwith Reference Beckwith, Escobar-Lemmon and Taylor-Robinson2014)—it is also an issue on which men’s and women’s attitudes tend to differ. American women, on average, express more concern about climate change and are more supportive of climate change mitigation policies than men (Bush and Clayton Reference Bush and Clayton2022). Recent polling data also suggest that Democratic women are slightly more concerned about climate change than reproductive rights.Footnote 8 We are thus presenting women with a placebo issue that they may both care more about than reproductive rights and on which they may have more progressive views than men. This biases us against detecting significant treatment effects and represents an especially hard test for our theory.
We collect data from two sources. First, in July 2020, we fielded the study to 1,250 American citizens via the survey firm, Dynata (formerly SSI), with respondents selected to mirror the US adult population with respect to age, race/ethnicity, gender, and geographic region. Second, we included our vignettes and main response question on the CES, a nationally representative survey with a stratified sample of US adult citizens administered by the sampling firm YouGov.Footnote 9 Our survey experiment was fielded through CES to 1,500 respondents in the preelection wave in October 2020. We first present our more extensive results from the Dynata sample and then show that our core findings replicate using the nationally representative CES sample.
POLICY THREAT AND EXCLUSION RAISE WOMEN’S POLITICAL AMBITION
We first ask respondents to reflect on the city council described in the vignette. This outcome question reads: “If you were to consider running for political office, how interested would you be in running for the city council election described above?”
Respondents could answer on a four-point Likert scale from “not at all interested” to “very interested.” Figure 2 displays our results. When the city council is set to legislate on women’s reproductive healthcare, women express more interest in running when the council is all-male than when it is gender-balanced. The effect size is two-tenths of a standard deviation and is significant at p = 0.07 (although expectations were preregistered, to be conservative all p-values are associated with two-tailed tests).
Treatment Effects for Women Respondents on Interest in Hypothetical Race
Note: Error Bars at 95% confidence intervals. See also Model 1 of Table 1.

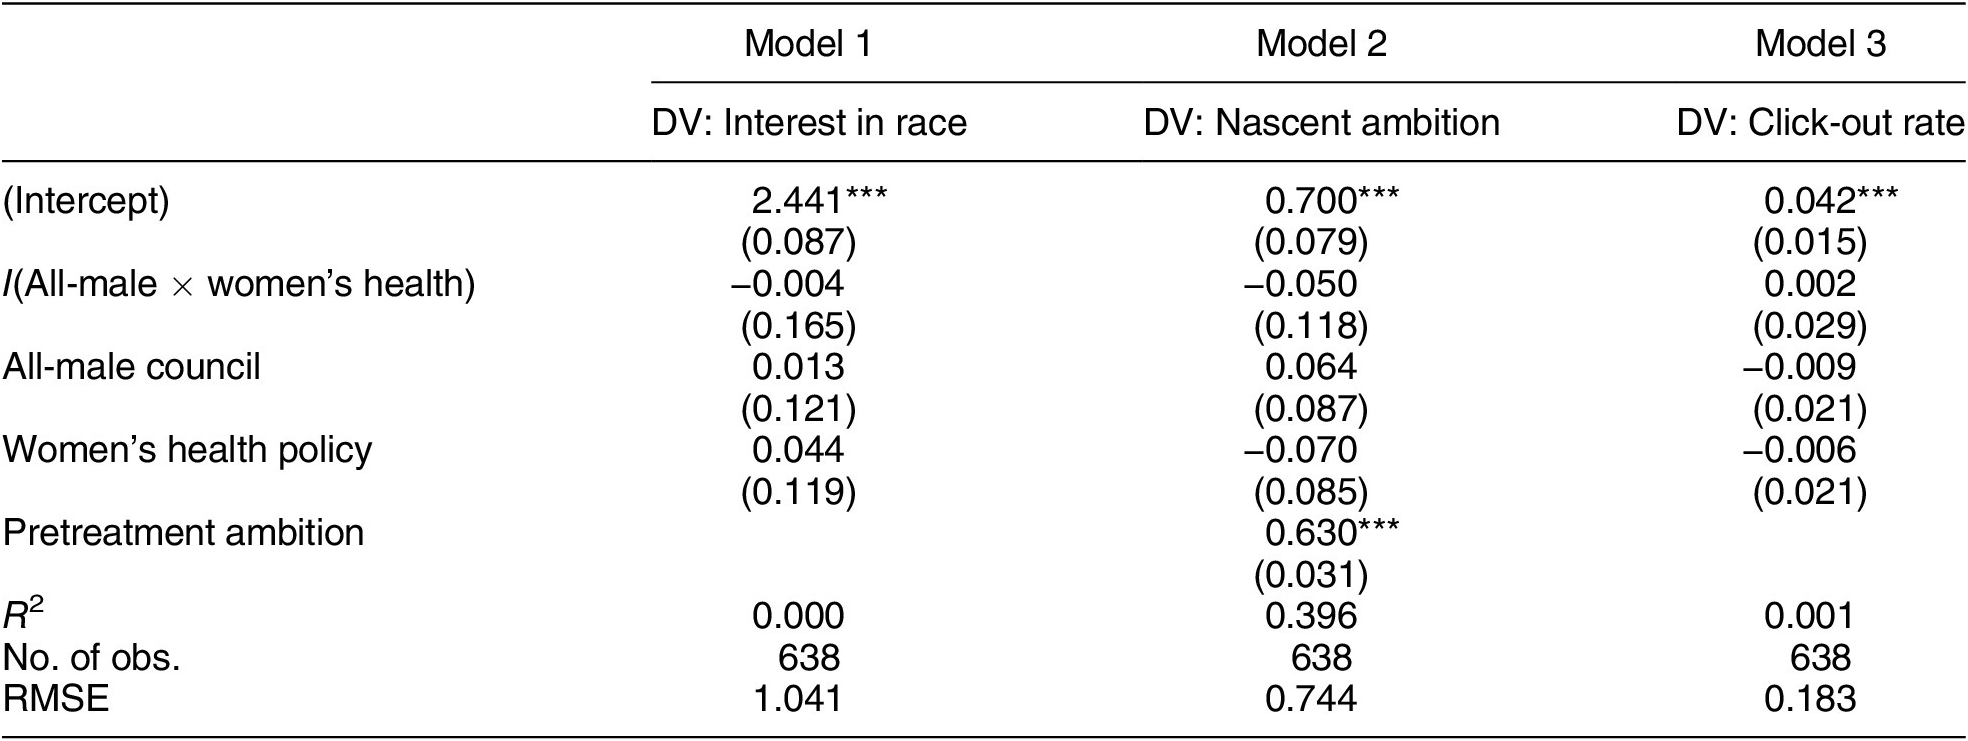
When the city council is set to legislate on renewable energy projects, no difference appears in women’s ambition between the two treatment conditions. If anything, women’s interest in running is lower (although not significantly) in the all-male condition. As we show in Model 1 of Table 1, a difference-in-difference test shows that the all-male council condition increases women’s political ambition to a significantly greater degree when the council is set to legislate on reproductive healthcare than when it is set to legislate on renewable energy (interaction term significant at p = 0.06). Men, for their part, are not affected by the all-male treatment on either the issue of reproductive healthcare (p = 0.30) or renewable energy (p = 0.91), and the interaction between the all-male condition and the women’s health condition is not statistically significant (see Table 2, displaying results for men respondents).
Difference-in-Difference Test for Women Respondents across Three Ambition Measures (Dynata Sample)

*** p < 0.01, ** p < 0.05, * p < 0.1.
Difference-in-Difference Test for Men Respondents across Three Ambition Measures (Dynata Sample)
*** p < 0.01, ** p < 0.05, * p < 0.1.
Whereas our first test asks about the specific race featured in the vignette, our second test uses a within-subject design to measure changes in women’s ambition more broadly after exposure to the treatment. For this test, we use the literature’s standard question and response options to measure nascent political ambition, or the general desire to run for office at some moment in time (see Fox and Lawless Reference Fox and Lawless2005). The question asks: “Which best characterizes your attitude toward running for political office in the future?” Respondents could answer: “It is something I am unlikely to do”; “I would not rule it out forever, but I currently have no interest”; “It is something I might undertake if the opportunity presented itself”; or “It is something I definitely would like to undertake in the future.” Higher values on this scale are associated with higher levels of political ambition.
This question has two advantages. First, it examines more general attitudes about running for office, rather than asking respondents to make their calculations relative to a specific race. This may be a more difficult test, as nascent ambition may be harder to move because respondents are reflecting on their actual life choices rather than a hypothetical scenario. Second, we can assess how reading about an all-male council changes women’s ambition from a baseline measure. We predict that reading about an all-male council discussing reproductive rights will increase women’s political ambition relative to reading about a gender-balanced council discussing the same issue. Measuring ambition pretreatment and posttreatment offers a test of within-subject changes in ambition.
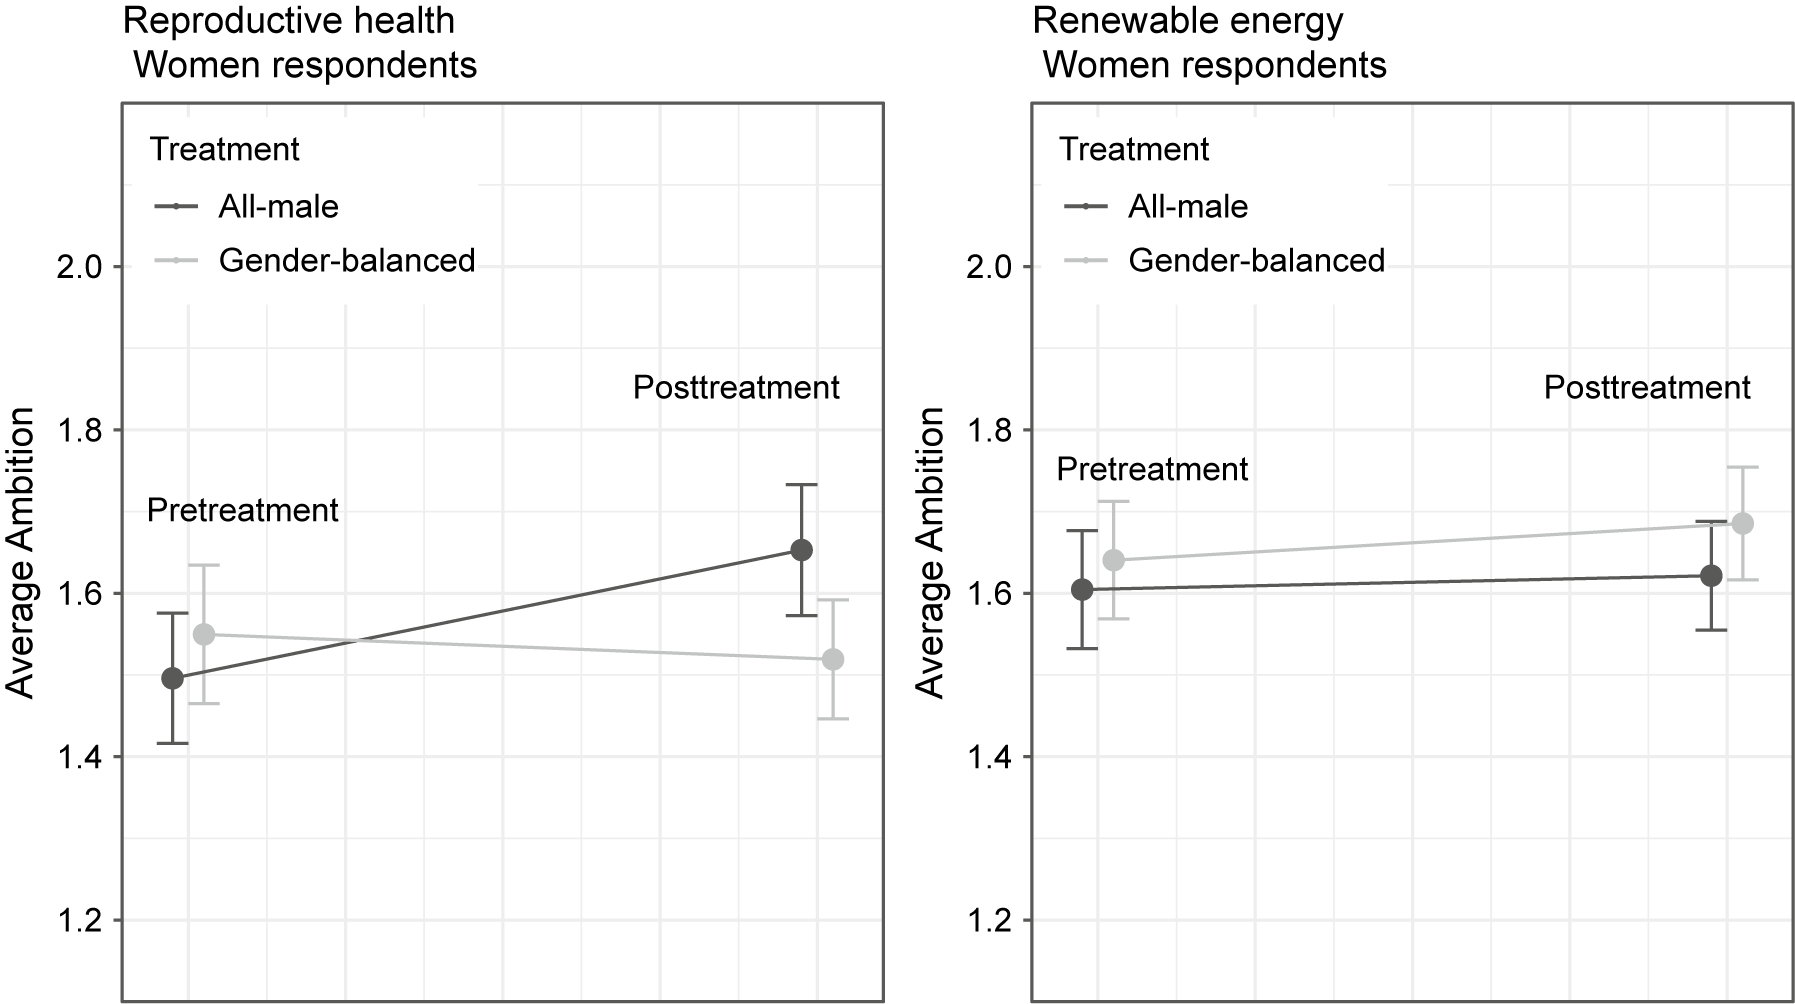
Figure 3 shows the results for women respondents. As we hypothesized, women who read about the all-male council report higher levels of nascent political ambition posttreatment (left panel, treatment effect significant at p ≤ 0.05). Like our first test, this effect size is equivalent to a two-tenth standard deviation increase relative to respondents’ pretreatment ambition. Moreover, reading about an all-male council has no effect on women’s political ambition when the council is set to debate renewable energy projects. This difference in treatment effects across the two issue areas is significant at the p = 0.07 level (see Model 2 of Table 1). For men, we again find no evidence that the interaction between issue area and women’s representation differentially affects average posttreatment ambition (see Model 2 of Table 2).
Within-Subject Treatment Effects (Pretreatment vs. Posttreatment) for Women Respondents
Note: Error Bars at 95% confidence intervals. See also Model 2 of Table 1.
Finally, we include a behavioral measure of political ambition. Posttreatment, we present respondents with the following text box:
If you are interested in learning more about how to run for local office, please click the link below. A website will open in a new window that provides bipartisan resources and support. https://www.runforoffice.org
Figure 4 shows treatment effects (the percentage of respondents who clicked the link) for women on both issue areas. We find a significant treatment effect on the topic of reproductive health. After reading about this issue, only 1.5% of women in the gender-balanced condition click on the link, whereas 5.8% of women in the all-male condition do so (difference significant at p = 0.07). There are no significant treatment effects on the issue of renewable energy. The all-male treatment has a significantly greater effect in the reproductive health condition than in the renewable energy condition (interaction significant at p ≤ 0.05; see Model 3 of Table 1). Finally, again we find that men are statistically indistinguishable across treatment conditions (all-male vs. gender-balanced) in both issue areas (see Model 3 of Table 2). Across all three measures of ambition, and specifically when women’s rights are at stake, all-male councils mobilize women’s nascent political ambition, but not men’s ambition.
Treatment Effects for Women Respondents on Click-Out Rates
Note: Error Bars at 95% confidence intervals. See also Model 3 of Table 1.

Treatment Effects Strongest for Pro-Choice Women
Given that our theory focuses on policy threat, we expect that our effects will be strongest among pro-choice women. Specifically, the proliferation of state laws that seek to limit access to abortion suggests that pro-choice women will find funding cuts to reproductive health clinics the most threatening, and so they should be the most motivated to take action in this condition.
In our Dynata survey, we asked pretreatment questions to gauge respondents’ preferences across a range of policy issues. Among these, we ask: “Do you think restricting access to abortion is a good idea or a bad idea?” Figure 5 plots the conditional average treatment effects (CATEs) for women respondents who answered that limiting access to abortion was “a bad idea” (top row) and for those that answered it was “a good idea” (bottom row). Consistent with our theory, when the issue up for debate is reproductive healthcare, pro-choice women report greater political ambition when running for a seat on an all-male council. For the placebo issue of renewable energy, we do not find significant treatment effects among pro-choice women. Treatment effects across the two issue areas are statistically distinguishable from each other (interaction significant at p = 0.09; see Table SI.3 in the Supplementary Material). Consistent with our theory, we also find no treatment effects among anti-choice women.
Treatment Effects for Women Respondents on Interest in Hypothetical Race by Pretreatment Abortion Stance
Note: Error Bars at 95% confidence intervals. See also Table SI.3 in the Supplementary Material.

Treatment Effects Work through Increased Political Efficacy
We theorized that groups of men legislating on women’s rights would raise women’s ambition because all-male groups signal to women that their perspectives were missing in political discussions. In all-male settings, women are more likely to think that their presence can influence the outcome, steering the group toward the “right” decision for women. To test for evidence consistent with political efficacy as a mechanism, we asked respondents how much they agreed with the statement, “politics is a place where someone like me could make a difference,” on a four-point Likert scale ranging from “strongly disagree” to “strongly agree” with higher values indicating greater levels of agreement.
Figure 6 shows treatment effects associated with this question for women respondents in the reproductive healthcare condition (left panel) and the renewable energy condition (right panel). In line with our expectations, women respondents are more likely to report that they could make a difference in politics after reading about an all-male city council set to legislate on women’s rights as compared with a gender-balanced council set to legislate on this issue. Moreover, the opposite effect appears when the topic under discussion is renewable energy. Here, women respondents report significantly less political efficacy in the all-male condition. Taken together, we find that the all-male treatment increases women’s political efficacy to a greater degree when the topic is reproductive health compared with renewable energy (interaction significant at p ≤ 0.05; see Table 3). This finding is consistent with standard theories about role models: in the absence of policy threat, women feel more efficacious when representative bodies are gender-balanced.
Treatment Effects for Women Respondents on Perceived Efficacy
Note: Error Bars at 95% confidence intervals. See also Table 3.

Difference-in-Difference Test for Women Respondents for Measures of Efficacy (Dynata Data)
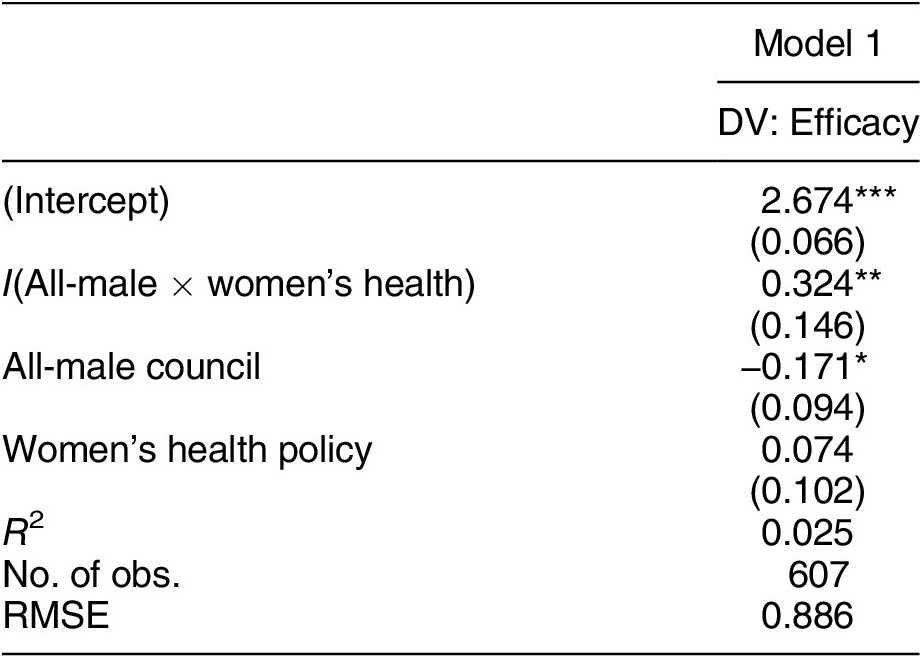
*** p < 0.01, ** p < 0.05, * p < 0.1.
As a second test for evidence consistent with our mechanism, we asked respondents the following question pretreatment:
We know not everyone is interested in running for political office. But if you were to run some day in the future, which of the following statements best describes you?
Respondents could answer: “I would run where I could make the biggest difference”; “I would run where I think I could win”; or “I would run where the position would be most enjoyable.” Figure 7 plots CATEs by respondents’ selection (see also Table SI.4 in the Supplementary Material). In line with our theory, we only find significant treatment effects among women who report that they would want to run where they could make the biggest difference (p = 0.06). When the topic under discussion is renewable energy, we do not observe treatment effects among women who report that they want to run where they could make the biggest difference (upper right panel in Figure 7).
Treatment Effects for Women Respondents on Interest in Hypothetical Race by Pretreatment Entry Preferences
Note: Error Bars at 95% confidence intervals. See also Table SI.3 in the Supplementary Material.

This test also sheds light on a potential alternative explanation for our results. As Dolan (Reference Dolan1998) noted in her study of women candidates following the Anita Hill hearings, women might view the all-male council as an opportune moment to run for political office, believing that voters will have an especially high demand for women candidates in such an environment. If the treatment effects among women respondents are driven by politically savvy women who are calculating the right moment to run, then we would expect our results to be most pronounced among those women who reported pretreatment that they would run where they thought they could win—and not where they thought they could make the biggest difference. This is not the case. We find no treatment effects among the group of women who report that they would be more likely to run where they think they would win (bottom row of Figure 7). That treatment effects are strongest among those who want to make a difference echoes the real-world case of the 2018 elections. Women candidates expected that their presence would allow them to effect policy change, including by wrestling agenda-setting power away from male-dominated groups.
Effects Highest among Democratic Leaners and Independents
We hypothesized that the treatment effects on the issue of reproductive rights would be stronger among Democratic than Republican women. To test this expectation, we examine how party identification and strength of partisanship condition our results. We measure CATEs for respondents’ interest in running for the race described in their vignette. Figure 8 plots these CATEs for women respondents grouped into five categories: those who responded to a party identification question by choosing either Democrat or Republican; those who declined to choose either Democrat or Republican but then, on a second question, reported leaning Democrat or Republican; and those who selected Independent on both the first and second questions (see also Table SI.5 in the Supplementary Material).
Conditional Average Treatment Effects for Women Respondents on Interest in Hypothetical Race by Party Identification
Note: Error Bars at 95% confidence intervals. The dot size represents sample size in each group. See also Table SI.5 in the Supplementary Material.
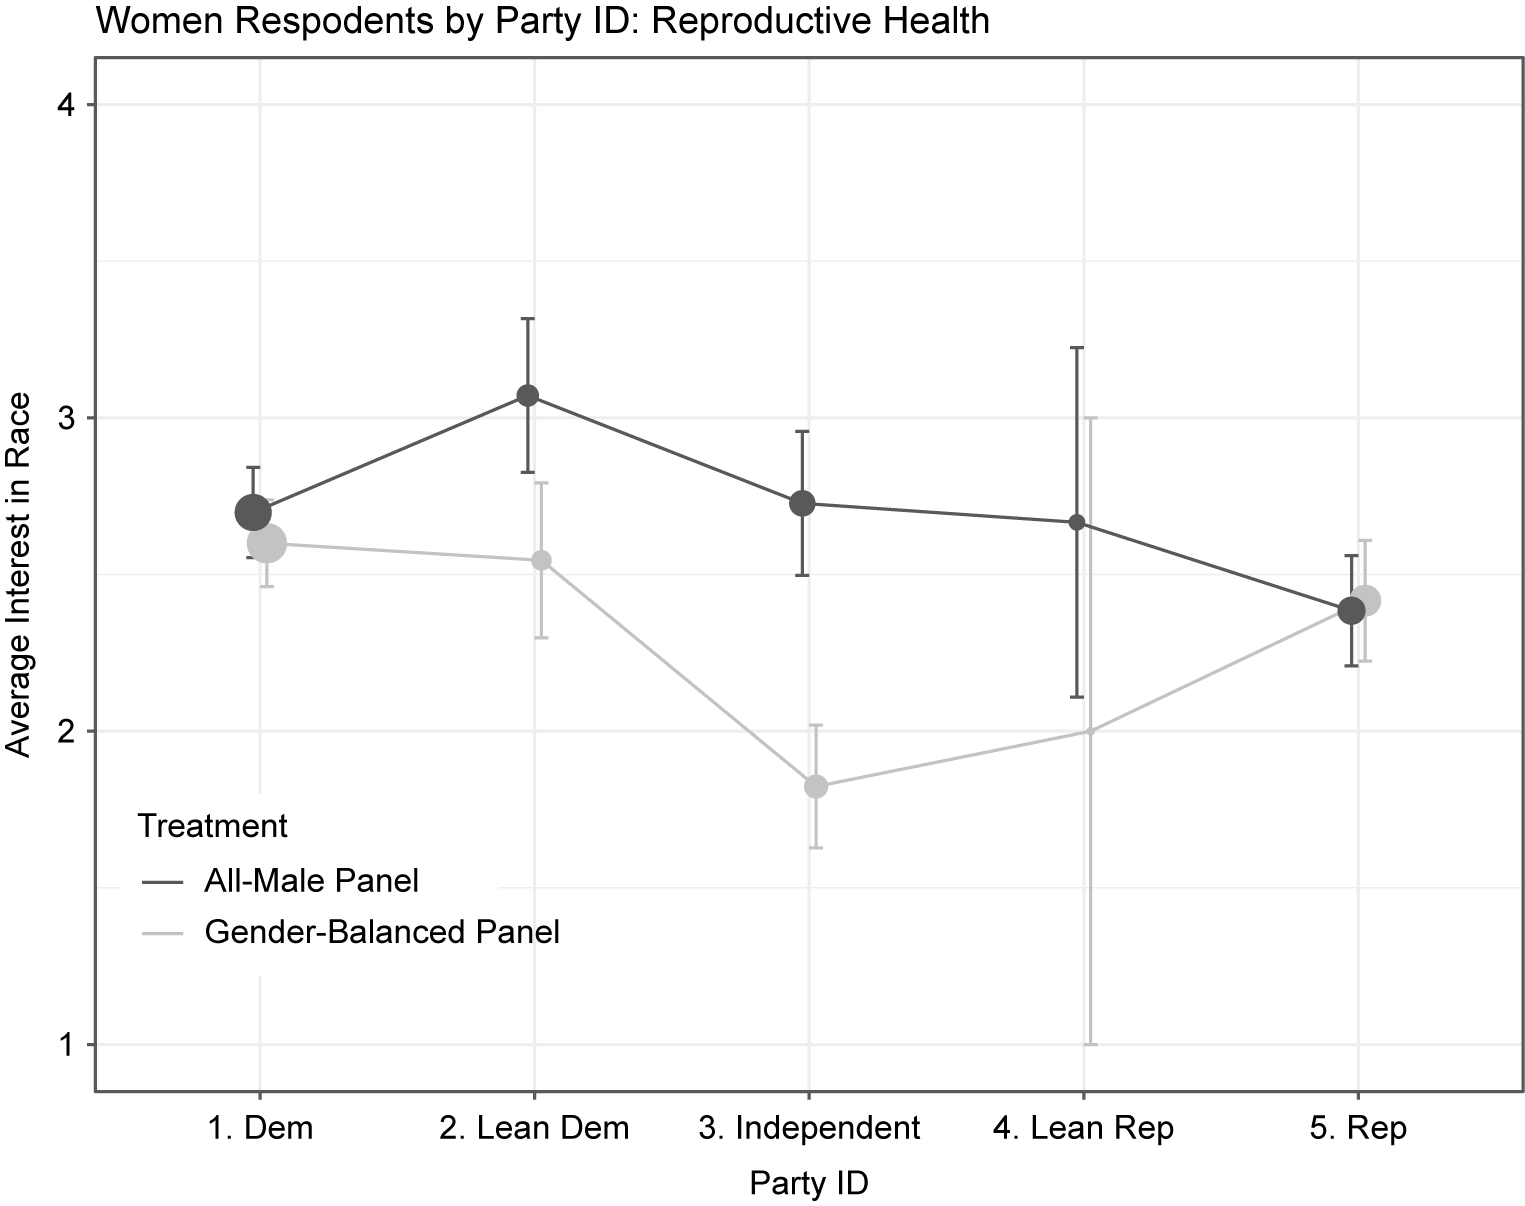
Our results are generally consistent with our expectations, but with an important caveat. Treatment effects are driven not by Democratic women, but rather by women who lean Democrat and those who identify as political Independents. Indeed, the largest CATE and the only one to achieve traditional levels of statistical significance on its own is for Independent women (p ≤ 0.01).
Although we can only speculate about the origins of this finding, we posit that perhaps women who readily identify as Democrats are more aware of women’s exclusion from politics and resulting policy threats. Democratic women are thus expressing levels of political ambition in which the political moment (what we are priming with our treatments) is already “baked in” to their thinking. Put another way, given that those with stronger partisan identities also tend to have more political knowledge (Carpini and Keeter Reference Carpini and Keeter1996), Democratic women may have already internalized an electoral environment in which groups of men legislate on women’s rights (particularly in advance of the 2020 presidential election). This awareness may lead Democratic women to express high levels of political ambition even in the gender-balanced condition, making our all-male treatment less effective.Footnote 10 Conversely, those who only lean Democratic or are Independents may be more moved by our treatment if they are less attuned to news stories of men legislating on women’s rights. This group may be responding to what is more likely new information, and thus may be more likely to update their reported ambition as a result.
Treatment Effects Hold for Black and White Women, but not Latinas
Next, we analyze how exclusion and policy threat may differently affect the political ambition of Black women, Latina women, and white women—the three largest racial or ethnic subgroups in our sample.Footnote 11 For each group of women, Figure 9 plots the average interest in running for office in each treatment condition (see also Table SI.6 in the Supplementary Material).
Conditional Treatment Effects for Women Respondents on Interest in Hypothetical Race by Respondent Race/Ethnicity
Note: Error Bars at 95% confidence intervals. See also Table SI.6 in the Supplementary Material.
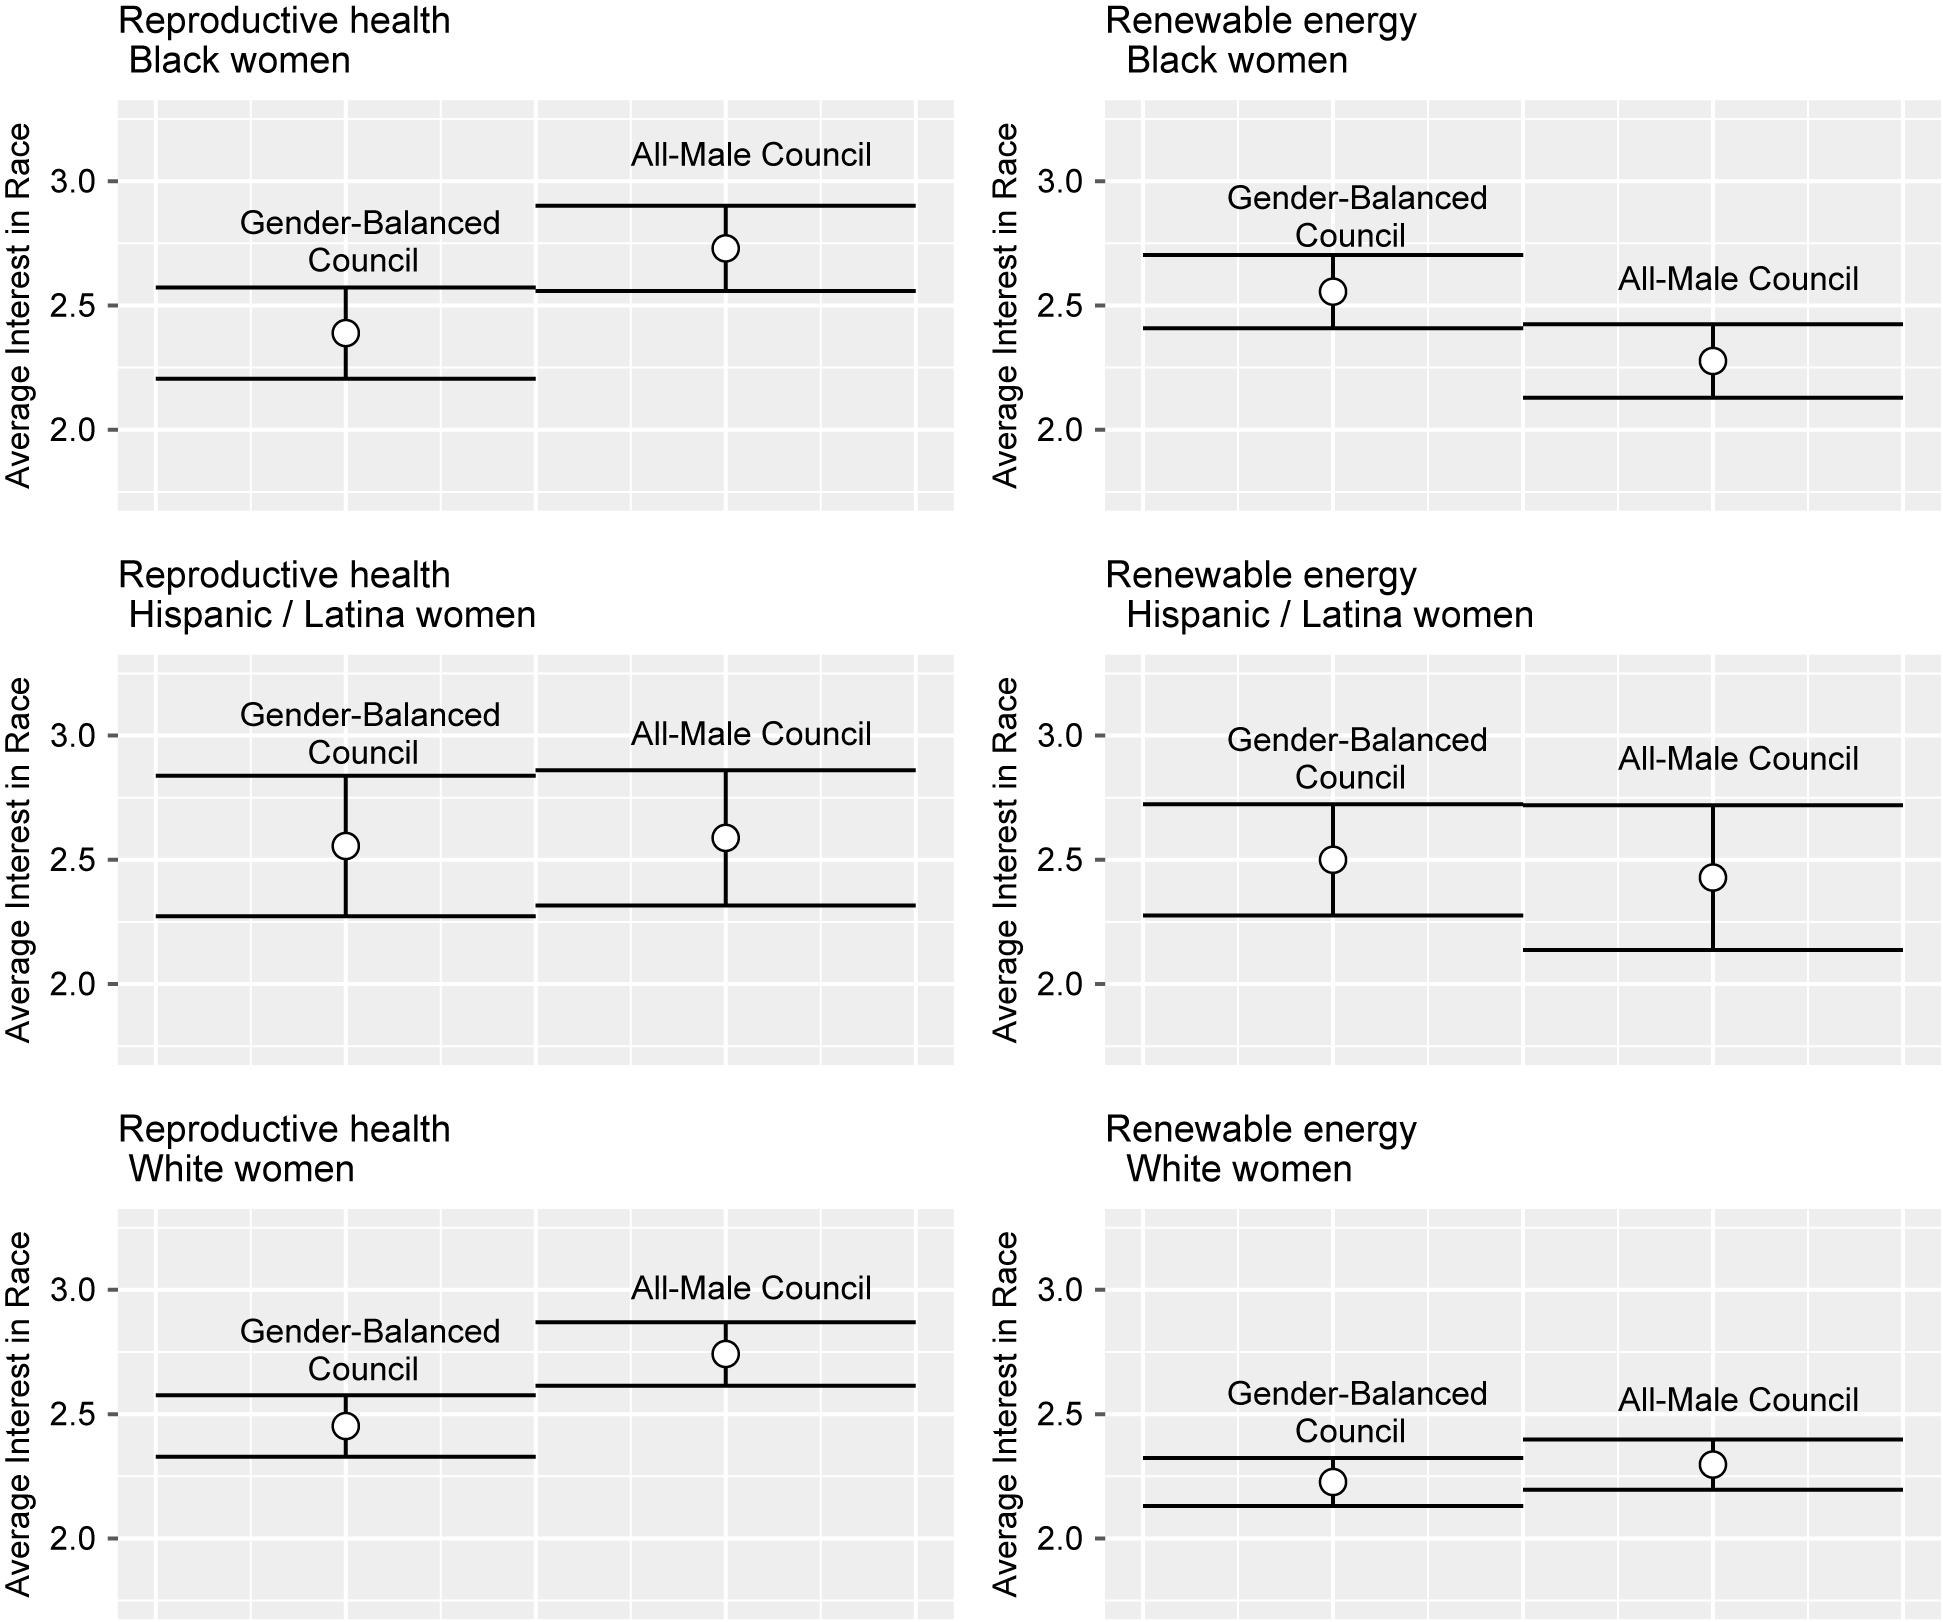
We find very similar treatment effects among Black women and white women. In the vignettes in which the city council is poised to legislate on reproductive healthcare, both Black and white women rate their interest in running as 2.4 (on a four-point scale) when the current council is gender-balanced versus an average of approximately 2.7 when the current council is all-male. This 0.3-point difference corresponds to an approximately 0.3 standard deviation difference for each group. Among both Black and white women, this increase is significantly greater than what we observe when the topic under discussion is renewable energy.Footnote 12 For Latinas, we observe no differences in either treatment condition. This is not a matter of reduced sample size for this group; substantively, the differences are very close to zero.
Above, we noted that the majority-white councils might reduce treatment effects among women of color. We find, however, that Black women are on average more motivated to run to replace a member of the all-male/majority-white council than the gender-balanced/majority-white council. While speculative, our results suggest that councilor gender sends a strong signal on the issue of reproductive healthcare to Black women, even without a shared racial identity. Of course, our treatment effects may have changed if we simultaneously varied the gender and race composition of the councils, a key avenue for future research.
Why do we observe strong effects among Black and white women, but not Latinas? We consider two possible explanations. First, we turn to our finding that treatment effects are most pronounced among women who identify as pro-choice. The heterogeneity we observe among women from different racial/ethnic groups could result from different average preferences on the issue of abortion. However, we find little variation in pro-choice attitudes among women: 63% of Latina women answered that restricting abortion access was “a bad idea” compared with 65% of Black women and 68% of white women. These differences are small substantively and not significantly distinct from each other (chi-squared test p-value = 0.72).
Alternatively, our treatments may produce different levels of efficacy across groups. We find some evidence consistent with this explanation. Our exclusion/policy threat treatment does not increase average efficacy among Latinas (agreeing with the statement “politics is a place where someone like me could make a difference”), whereas we observe significant effects for both Black and white women (see Table SI.8 in the Supplementary Material). Similarly, although we observe significant treatment effects among pro-choice Black and white women, we do not observe effects among pro-choice Latinas (see Figure SI.3 in the Supplementary Material). These results comport with studies finding that Latinas’ political ambition is less malleable (see, e.g., Herrick and Pryor Reference Herrick and Pryor2020; Holman and Schneider Reference Holman and Schneider2018). Still, we caution that our results here are speculative; they rely on post hoc analyses from small groups of respondents. Future work that over-samples women of color (like Herrick and Pryor Reference Herrick and Pryor2020; Montoya et al. Reference Montoya, Bejarano, Brown and Gershon2021) could further examine how messages about exclusion and policy threat resonate among women from different racial and ethnic groups.
Core Results Replicate with CES Data
Finally, as a robustness check, we placed a shorter module of our survey experiment on the preelection wave of the CES, which was fielded in October 2020 to a nationally representative sample of 1,500 American citizens. Our module included the four randomized vignettes and our main outcome question: respondents’ interest in running for the city council race described in the vignette.
Consistent with our Dynata results, we find that an all-male city council increases women’s political ambition when set to legislate on reproductive healthcare. Conversely, the all-male city council depresses women’s political ambition when set to legislate on renewable energy. As we show in Table 4, the difference in difference between the treatment effects of the all-male council in the two policy areas is statistically significant for women respondents (interaction significant at p ≤ 0.05), but not for men. In short, our core finding replicates on a nationally representative survey.Footnote 13
Replication using CES Data. Difference-in-Difference Test for Women Respondents (Model 1) and Men Respondents (Model 2) on Interest in Running for the Race Described in the Experimental Vignette

*** p < 0.01, ** p < 0.05, * p < 0.1.
THE MOBILIZING POWER OF EXCLUSION AND POLICY THREAT
Theories focused on political role models suggest that women’s descriptive representation and political engagement are positively related, whereas the relationship between women’s presence and political ambition is less clear. In the US, women’s candidacy jumped notably in two moments when the costs of women’s exclusion were made evident: in 1992, following the Anita Hill hearings, and in 2018, after the election of Donald Trump. Together these Years of the Woman suggest that the political world is not behaving as role model effects would predict. It is being confronted with the potential policy consequences of women’s exclusion, rather than seeing women in office, that drives new women to enter politics.
Consistent with these real-world examples, our survey experiments find that women who read about an all-male city council poised to legislate on women’s rights report increased ambition compared with their pretreatment ambition levels and to women in other treatment groups. While our vignette manipulated this messaging about exclusion and policy threat at the local level—an arena in which women tend to express more political interest (Coffé Reference Coffé2013)—our motivating examples and focus groups, combined with scholarship on the 2018 elections, suggest that our results should generalize to the national level. For instance, some focus group participants expressed interest in higher-level offices. More generally, their reactions to images of all-male lawmakers deliberating on women’s rights mirrored accounts from women who ran for Congress in 2018. When asked why she entered the race, Virginia congressional candidate Helen Allio stated, “When the election happened, and the Women’s March, we all just by telepathy said, ‘No we gotta fix this. We’re gonna fix it.’ And we are” (Kurtzleben Reference Kurtzleben2018). Allio’s sense of urgency in responding to the Trump era was broadly echoed in other 2018 women candidates’ explanations for running. Many nonincumbent Democratic women congressional candidates justified their 2018 campaigns by referencing motivations like anger and fear, and by stating the need to “do something” in response to the threat posed by Trump (Dittmar Reference Dittmar2020). Likewise, in discussing both local and national politics, our focus group participants talked about wanting to wrestle policy agendas back in the “right” direction—to “get in there and fix it.”
Our findings also matter for local, state, and national politics because all-male bodies occur at all levels of government. Recall, for example, that one West Coast focus group participant expressed indignation upon discovering that her city council—a large metropolis in Southern California —was all men. In fact, 56 California cities in 2017 had all-male city councils (Kaplan Reference Kaplan2018). In 2018, large cities in other states, such as Tampa and Buffalo, did as well. That same year, an all-male city council in Waskom, Texas voted to adopt antiabortion provisions that made the town a “sanctuary city for the unborn,” outlining the private enforcement mechanisms that went on to underpin Texas’ subsequent antiabortion law. Exclusion also occurs at the state level. While all US state legislatures have some women members, all-male committees persist: in recent years, an all-male committee in Maryland’s state legislature voted to preserve rapists’ parental rights and an all-male committee in Utah’s lower house voted against eliminating taxes on menstrual products. In short, our research design does not describe a historical anachronism of male dominance, but rather the recent state of affairs in places across the US.
Our work also underscores a point increasingly made by other scholars—political ambition is not a fixed character trait but an interest that waxes and wanes within individuals over time. Just as existing research suggests that women’s ambition varies depending on whether respondents are primed to think about competition (Preece and Stoddard Reference Preece and Stoddard2015) or that political careers are a way to serve one’s community (Schneider et al. Reference Schneider, Holman, Diekman and McAndrew2016), women’s sense of what they can accomplish while in office also moves their ambition. As two respondents in separate focus groups noted—one of whom later did run and win a seat on her all-male city council—the Trump era sparked a “fire in the belly.” Our findings suggest that policy threat stokes that flame.
DIRECTIONS FOR FUTURE RESEARCH
Our research offers a new approach for thinking about how descriptive representation shapes ambition. Our work also generates new research questions concerning the scope conditions of these findings. First, our theory and design focused on the effects of all-male groups compared to gender-balanced groups. What happens at thresholds between zero and parity? Although other work suggests that the presence of a token woman in an otherwise all-male decision-making body does not change respondents’ aversion to male dominance (Clayton, O’Brien, and Piscopo Reference Clayton, O’Brien and Piscopo2019), different women may have differing perceptions of inclusion/exclusion at 20%, 30%, or 40% thresholds. Future work can attempt to more precisely identify these inclusion and exclusion thresholds among subsets of women. Regardless, our theory suggests that the exact proportion may matter less than the overall message about exclusion and policy threat. After all, in both Years of the Woman, the proportions of women in the US Congress and state legislatures were greater than zero and record numbers of women still ran for office.
Second, our experiment was designed to resonate with Democrats. Yet, our theory could also apply to right-leaning women. Observing an all-male group legislating on an issue that Republican women link to their gendered interests, such as school choice, could increase their ambition. However, we remain agnostic as to whether we would observe this outcome in practice because our theory suggests that effects depend on women believing that their presence would influence the outcome. Republicans place less importance on descriptive representation. Republican women may therefore trust Republican men to be aligned on their gendered interests in ways that Democratic women simply do not trust men, whether Democratic or Republican (see Anderson-Nilsson and Clayton Reference Anderson-Nilsson and Clayton2021).
Third, it is important to examine whether these results hold in different national contexts, particularly where women’s descriptive representation is even lower than in the US. We find that when coupled with exclusion, policy threat is mobilizing, but that this result is driven by women who believe that they can make a difference in politics. To feel politically efficacious, women likely need to have some baseline exposure to descriptive representatives. Women are unlikely to see politics as a viable career path if they have never (or rarely) observed women in office. Role models thus likely remain an important source of women’s ambition more broadly, particularly when women are just beginning to make inroads into political office.
Fourth, future work could assess whether similar results hold for other historically marginalized groups. Existing scholarship suggests that policy threat can trigger negative emotions that increase mobilization and political participation among Black, Latinx, and Arab Americans (Anoll and Israel-Trummel Reference Anoll and Israel-Trummel2019; Cho, Gimpel, and Wu Reference Cho, Gimpel and Wu2006; Nichols and Valdéz Reference Nichols and Valdéz2020; Scott and Collins Reference Scott and Collins2020). Anecdotal evidence likewise points to these effects. For instance, Virginia’s Danica Roem became the first openly transgender legislator to serve in any state assembly after deciding to run against an incumbent who had introduced an anti-transgender bathroom bill. Yet, as far as we know, no work considers whether policy threat coupled with descriptive underrepresentation affects political ambition for members of other marginalized groups, including racial and ethnic minorities, people with disabilities, LGBTQIA+ individuals, or those from working-class backgrounds. Our exploratory analysis also underscores the importance of adding intersectional perspectives. We find that exclusion combined with policy threat resonates with white and Black women, but not Latinas. Future studies could examine policy threats that are gendered and racialized (e.g., maternal mortality or the gender pay gap), to see whether and when racialized-gendered threats are particularly mobilizing for women of color.
Finally, although our work suggests that exclusion combined with policy threat can bolster women’s political ambition, this outcome is a small silver lining within a normatively troubling set of circumstances. Exclusion and policy threat together represent the worst-case scenario for those concerned with justice. While these conditions may inspire women to run for office—as well as spur social organizing and activism—they also mean that women face scenarios where their political exclusion results in decisions detrimental to their interests. From abortion restrictions to rapists’ parental rights and taxes on feminine products, all-male or majority-male groups are passing laws that work against justice for women, especially the most marginalized. In 2022, five out of the six Supreme Court justices that voted to overturn the landmark Roe v. Wade decision were men. This ruling gave state legislatures with overwhelmingly male membership the ability to ban abortion services for women living in their states.Footnote 14 Relying on a Year of the Woman phenomenon to close gaps in women’s political representation is a poor substitute for both the active recruitment of women candidates and more just policy-making processes.
SUPPLEMETARY MATERIAL
To view supplementary material for this article, please visit https://doi.org/10.1017/S0003055422001344.
DATA AVAILABILITY STATEMENT
Research documentation and data that support the findings of this study are openly available in the American Political Science Review Dataverse at https://doi.org/10.7910/DVN/H2JL7A.
ACKNOWLEDGMENTS
Earlier versions of this work were presented at the 2018 EGEN Conference at Vanderbilt University, the 2018 EGAP Conference at Vanderbilt University, and the 2019 EGEN Conference in Stockholm, Sweden. We are deeply grateful to Teagan Langseth-Deapolis and Georgia Anderson-Nilsson for their research assistance; to Rachel Bernhard, Kelly Dittmar, Cindy Kam, Katelyn Stauffer, Dawn Teele, and the reviewers and editors for feedback; and to Sarah McCall, Kristal Knight, Carrie Russel, and John Sides for their invaluable support of the project.
FUNDING STATEMENT
This research was funded by the Faculty Enrichment Grant at Occidental College and by the Vanderbilt Department of Political Science.
CONFLICT OF INTEREST
The authors declare no ethical issues or conflicts of interest in this research.
ETHICAL STANDARDS
The authors declare the human subjects research in this article was reviewed and approved by Vanderbilt University and Occidental College and certificate numbers are provided in the Supplementary Material. The authors affirm that this article adheres to the APSA’s Principles and Guidance on Human Subject Research.


 Open access
Comments
No Comments have been published for this article.