


Introduction
After having been regionally extirpated or reduced to very low numbers in the early 1900s, the great cormorant (Phalacrocorax carbo ssp., ‘cormorant’ from here on) started breeding in the Baltic Sea area in the late 1940s, with a marked increase of distribution and numbers from the late 1980s onwards (Lindell et al., Reference Lindell, Mellin, Musil, Przybysz and Zimmerman1995). By the 2010s, the local population was estimated to exceed 160,000 breeding pairs (Bregnballe et al., Reference Bregnballe, Lynch, Parz-Gollner, Marion, Volponi, Paquet, Carss and van Eerden2014b). Cormorants that breed in the Baltic Sea region belong to the subspecies Phalacrocorax carbo sinensis (‘sinensis’ from here on). After the breeding season, large numbers of sinensis individuals migrate southwards and leave the Baltic Sea area, but the proportion that overwinters in the southern parts is increasing and consists of birds from different breeding areas (Frederiksen et al., Reference Frederiksen, Korner-Nievergelt, Marion and Bregnballe2018).
Phalacrocorax carbo carbo (‘carbo’ from here on) is the other subspecies found in the Baltic Sea region. The breeding areas of carbo are situated along exposed coasts of the Atlantic Ocean (Marion & Le Gentil, Reference Marion and Le Gentil2006), and in 2012, the ratio of sinensis/carbo in the western Palaearctic was estimated to be 8.7 (Bregnballe et al., Reference Bregnballe, Lynch, Parz-Gollner, Volponi, Marion, Paquet, van Eerden and Carss2014a). The migration routes of carbo individuals in the Baltic Sea area are insufficiently known. However, the subspecies is considered to be a migratory visitor that passes through and stays in the area outside of the breeding season, but with individual stragglers remaining in the area outside of the migratory season. The heterogeneity of the distribution of cormorant subspecies in the Baltic Sea creates a challenge for local population management and for mitigating the cormorant–fisheries conflict. As a consequence of the increasing numbers of cormorants during the last decades, the concern of locally increasing exploitation of fish stocks by cormorants, and the simultaneous diminishing of overall fish stocks of the Baltic Sea, the need has risen to assess the ecological impacts of this avian top predator and its resource competition with fisheries (Östman et al., Reference Östman, Boström, Bergström, Andersson and Lunneryd2013; Salmi et al., Reference Salmi, Auvinen, Raitaniemi, Kurkilahti, Lilja and Maikola2015; Hansson et al., Reference Hansson, Bergström, Bonsdorff, Härkönen, Jepsen, Kautsky, Lundström, Lunneryd, Ovegård, Salmi, Sendek and Vetemaa2018). One issue is the decreasing post-smolt survival rates of reared and wild salmonids. The increased populations of cormorants and grey seals (Halichoerus grypus) in the Baltic Sea are thought to contribute to these losses (Friedland et al., Reference Friedland K, Dannewitz, Romakkaniemi, Palm, Pulkkinen, Pakarinen and Oeberst2017).
Cormorants consume mainly small-sized fish, and their main prey in the Baltic Sea area include species that humans also fish for, such as perch (Perca fluviatilis), pikeperch (Sander lucioperca) and Baltic herring (Clupea harengus membras) (Lehikoinen et al., Reference Lehikoinen, Heikinheimo and Lappalainen2011; Boström et al., Reference Boström, Östman, Bergenius and Lunneryd2012; Mustamäki et al., Reference Mustamäki, Bergström, Ådjers, Sevastik and Mattila2014; Salmi et al., Reference Salmi, Auvinen, Raitaniemi, Kurkilahti, Lilja and Maikola2015). Cormorants may also exploit other commercially valuable fish, such as salmon (Salmo salar) and sea trout (Salmo trutta) post-smolts (Boström et al., Reference Boström M, Lunneryd, Karlsson and Ragnarsson2009; Hansson et al., Reference Hansson, Bergström, Bonsdorff, Härkönen, Jepsen, Kautsky, Lundström, Lunneryd, Ovegård, Salmi, Sendek and Vetemaa2018). This dietary plasticity and opportunistic feeding behaviour could hamper the success of salmonid hatchery programmes that were intended to compensate for the habitat losses caused by hydroelectric power dams. In a previous study, coded wire tags and Carlin tags recovered from cormorant pellets suggested that cormorants only have a low predatory impact on the released salmon and sea trout (Boström et al., Reference Boström M, Lunneryd, Karlsson and Ragnarsson2009). However, a more recent study from the same area indicates that the predation by cormorants on released salmonid smolts in the river mouth can be substantial (K. Lundström, pers. comm.). In addition to the potential harm caused to fish hatcheries, large cormorant colonies may at least locally affect the populations of several native fish species as well as the structure of the ecosystem, creating conflicts between the birds and fisheries (Vetemaa et al., Reference Vetemaa, Eschbaum, Albert, Saks, Verliin, Jürgens, Kesler, Hubel, Hannesson and Saat2010; Östman et al., Reference Östman, Boström, Bergström, Andersson and Lunneryd2013; Salmi et al., Reference Salmi, Auvinen, Raitaniemi, Kurkilahti, Lilja and Maikola2015; Hansson et al., Reference Hansson, Bergström, Bonsdorff, Härkönen, Jepsen, Kautsky, Lundström, Lunneryd, Ovegård, Salmi, Sendek and Vetemaa2018). However, the effects of the cormorants on fish stocks on a larger scale have been questioned. A study covering the period 2005–2014 along Finnish coastal areas found that perch and pikeperch catches per unit of effort by gillnet showed no correlation between long-term perch and pikeperch stocks and predation by cormorants (Lehikoinen et al., Reference Lehikoinen, Heikinheimo, Lehtonen and Rusanen2017). Defining the ecological role of cormorants in the Baltic Sea area is challenging. The increase of the cormorant population has happened simultaneously with dramatic changes of ecosystem dynamics and structure due to environmental hydrographic factors, climate change, fishing intensity, eutrophication and deoxygenation (Vuorinen et al., Reference Vuorinen, Hänninen, Viitasalo, Helminen and Kuosa1998; Wasmund & Uhlig, Reference Wasmund and Uhlig2003; Casini et al., Reference Casini, Lovgren, Hjelm, Cardinale, Molinero and Kornilovs2008; Kauhala et al., Reference Kauhala, Bäcklin, Raitaniemi and Harding2017; Lind et al., Reference Lind, Huovila and Käkelä2018; Reusch et al., Reference Reusch, Dierking, Andersson, Bonsdorff, Carstensen, Casini, Czajkowski, Hasler, Hinsby, Hyytiäinen, Johannesson, Jomaa, Jormalainen, Kuosa, Kurland, Laikre, MacKenzie, Margonski, Melzner, Oesterwind, Ojaveer, Refsgaard, Sandström, Schwarz, Tonderski, Winder and Zandersen2018). Therefore, plans to locally reduce the number of cormorants, e.g. in order to reduce the predation mortality of fish, should be preceded by a study of diet composition and migration patterns, where the analysis of chemical markers, such as fatty acids (FA) or stable isotopes in birds' tissues, could be informative (Furness et al., Reference Furness, Crane, Bearhop, Garthe, Käkelä, Käkelä, Kelly, Kubetzki, Votier and Waldron2006; Barrett et al., Reference Barrett, Camphuysen, Anker-Nilssen, Chardine, Furness, Garthe, Hüppop, Leopold, Montevecchi and Veit2007).
Adipose tissue FA signatures of animals are integrated in a conservative way, reflecting dietary FAs over time (Iverson et al., Reference Iverson, Field, Bowen and Blanchard2004; Karnovsky et al., Reference Karnovsky, Hobson, Iverson and Hunt2008; Williams & Buck, Reference Williams and Buck2010) and thus carrying a diet history record of individuals. Since different fish species from different water systems have distinguishable FA profiles (Ackman, Reference Ackman, Arts and Wainman1999; Gladyshev et al., Reference Gladyshev, Lepskaya, Sushchik, Makhutova, Kalachova, Malyshevskaya and Markevich2012), the FAs incorporated into cormorant adipose tissue can provide information on both the feeding area and dietary items. This has been demonstrated to be feasible by seabird feeding experiments, where different fish diets have produced distinguishable adipose tissue FA profiles (Iverson et al., Reference Iverson, Springer and Kitaysky2007; Käkelä et al., Reference Käkelä, Käkelä, Martinez-Abrain, Sarzo, Louzao, Gerique, Villuendas, Strandberg, Furness and Oro2010; Wang et al., Reference Wang, Hollmen and Iverson2010). Since sea birds have a high metabolic rate, newly consumed dietary FAs appear in the tissues within weeks (Käkelä et al., Reference Käkelä, Furness, Kahle, Becker and Käkelä2009; Wang et al., Reference Wang, Hollmen and Iverson2010). Hence, FA profiles can be a useful tool to detect different food sources and short-term dietary changes and contribution of novel prey, such as hatchery-reared fish, provided that the FA signatures of these fish are distinctive. Baltic Sea cormorant diets have only been studied using traditional methods, i.e. morphological analysis of hard part remnants of prey fish in pellets (Lehikoinen, Reference Lehikoinen2005; Lehikoinen et al., Reference Lehikoinen, Heikinheimo and Lappalainen2011; Östman et al., Reference Östman, Boström, Bergström, Andersson and Lunneryd2013), and no studies analysing tissue FA profiles or other chemical markers have been published. To our knowledge, only two studies have assessed the diet of Phalacrocorax species using adipose tissue FA profiles (Käkelä et al., Reference Käkelä, Furness, Kelly, Strandberg, Waldron and Käkelä2007; King et al., Reference King, de Solla, Marentette, Lavoie, Kyser, Campbell, Arts and Quinn2017), and we found no previous studies on the cormorant subspecies inhabiting the Baltic Sea. Here, we study the usefulness of adipose tissue FA profiles in providing information on the diet and foraging habits of the cormorants found in different areas in the Baltic Sea in different seasons. Such information would help to identify the dietary sources used by the two subspecies over several areas and during different seasons, which could help discern seasonal and spatial ecological impacts of each subspecies and possible economic losses to local fisheries and hatchery-reared fish stocks.
The specific questions we address are: (1) Do the two subspecies, sinensis and carbo, show differences in their adipose tissue FA profiles? A general difference could be due to different foraging habits and preferred prey, or possibly different times of arriving to the area and thus differential retaining of the FA signal from a previous ocean-based diet. (2) Are there spatial and temporal differences in the foraging ecology between and within local Baltic Sea cormorant populations (and between individuals therein) that would be large enough to be revealed by analysing adipose tissue FA profiles? A clear temporal change of FA profile could indicate a prey shift. Specific FA profiles could also arise from local dietary opportunities, such as occasional easy catches of introduced fish or fishery discarded fish. FA profile changes could also be attributed to migration, especially if the FA characteristics of ocean fish are switched to those of brackish water fish, or vice versa. The preferences to migrate vs stay in the area irrespective of the season may differ between colonies. Finally, from the point of view of dietary marker development, we studied (3) which individual FAs or their structural types vary the most among the individuals sampled in different areas and seasons, and thus are the most useful in indicating dietary differences between the cormorant individuals and colonies.
Materials and methods
Collection of cormorants and sampling of adipose tissue
Cormorants (N = 94, subspecies confirmed in 77) were collected in 2013, 2016 and 2017 from the Finnish and Swedish coasts of the Baltic Sea as well as from the Åland Islands (Figure 1). The samples were collected from the bags of ongoing protection hunts, permitted by the local managing authorities (Blekinge: County Administrative Board (CAB) of Blekinge; Kalmarsund: CAB of Kalmar; Sundsvall: CAB of Västernorrland; Åland: The Government of Åland; Turku: ELY Centre for Varsinais-Suomi). In the archipelago of Turku, Finland, N = 10 cormorants were collected in August–October 2013. In Blekinge, southern Sweden, N = 29 cormorants were collected in January 2016 and in March–August 2017. At a nearby location, Kalmarsund, N = 17 cormorants were collected in June 2017. During 2017, N = 16 cormorants were also collected in the Åland Islands, Finland, in August–September, and N = 22 in Sundsvall, Sweden in June–September. See Figure 1B for more details on distribution of samples. Sex of the individuals were recorded (in some cases the sex of juvenile individuals remained unclear and thus were not reported for that location), and age was estimated based on plumage characteristics and categorized as ‘juvenile’ or ‘adult’ (the cormorants lose their juvenile plumage with pale neck and whitish belly after ~2 years and develop an adult plumage for the third year). Lacking information on subspecies and age, the specimens from Kalmarsund were only included to support the spatial comparison between cormorants collected in June 2017.
(A) Locations where cormorants where collected (Sundsvall, Åland Islands, Turku and Blekinge; total N = 77), and the additional sample of cormorants with no subspecies identification (Kalmarsund, N = 17). (B) The groups of specimens used for analyses of the spatial and temporal differences in adipose tissue fatty acid composition.

The collected samples were stored for a maximum of 3 months at −20°C before tissue subsampling. After thawing the surface of the bird's body, subcutaneous adipose tissue was sampled through an incision made medially to the knee, and for each bird a ~10 mm3 subsample was taken for FA analysis from the same standardized central location of the knee.
Morphological identification of cormorant subspecies
The carbo and the sinensis subspecies overlap morphologically to some extent, but by examining a combination of characters, it is possible to identify the individuals of each subspecies with a high degree of certainty. With fresh specimens, the most useful individual morphological character for separating the two subspecies is the angle of the gular pouch relative to the bill. The gular pouch angle is measured between the gape line (the mouth line across the facial skin below the eye, not the line between the two halves of the bill) and the rear edge of the gular pouch (the area of bare skin on the face) (Newson et al., Reference Newson, Hughes, Russell, Ekins and Sellers2004, Reference Newson, Ekins, Hughes, Russell and Sellers2005). Specimens in which this angle is less than 65° belong to the carbo subspecies, whereas specimens in which the gular pouch angle exceeds 73° belong to the sinensis subspecies (Figure 2A). In specimens where the gular pouch angle is 66–72°, this character alone does not allow for reliable subspecific identification. In such cases, the relative depth (height) and length of the bill were also measured, and sex-specific formulae were calculated, following Newson et al. (Reference Newson, Hughes, Russell, Ekins and Sellers2004, Reference Newson, Ekins, Hughes, Russell and Sellers2005). According to these formulae, male cormorants were identified as belonging to the subspecies carbo if the value for (0.92133 × bill depth) + (0.36504 × bill length) – (0.50198 × gular pouch angle degree) was equal to or greater than 4.66583. Male birds with values below these thresholds were identified as belonging to the subspecies sinensis. Female cormorants were identified as belonging to the subspecies carbo if the value for (0.87159 × bill depth) + (0.56828 × bill length) + (−0.61081 × gular pouch angle degree) was equal to or greater than 4.87236, and to the subspecies sinensis if their values were below these thresholds. Since whole carcasses of Kalmarsund birds were not transferred to laboratory, their subspecies or age could not be determined.
(A) Gular pouch angle (blue) in the great cormorant subspecies Phalacrocorax carbo sinensis and P. c. carbo. The degrees shown are from two representative adult female specimens collected in Blekinge, B001 (ssp. sinensis, left) and B005 (ssp. carbo, right). Both illustrated cormorants have subspecies-typical index values: −17.38 in the sinensis specimen and 18.23 in the carbo specimen. Drawings by Janne Granroth, modified after Newson et al. (Reference Newson, Hughes, Russell, Ekins and Sellers2004). (B) The numbers of the sinensis and carbo adult and juvenile specimens collected from Sundsvall (S), Turku archipelago (T), Åland Islands (A) and Blekinge (B) during different months. Stacked bars represent sample compositions, with the numbers of each type of specimen shown on the left side of the bar.

Of the total of 77 cormorants that were identified to the subspecies level (Figure 2A), 51 (66%) were determined to belong to the subspecies sinensis, and 26 (34%) to the subspecies carbo. At most of the sampling sites and times, the subspecies sinensis dominated, which was especially clear in the samples collected in June. The Blekinge June sample included only sinensis specimens, and in the Sundsvall June sample there were 7 sinensis specimens and only 2 carbo specimens (Figure 2B). The highest prevalence of carbo was observed in the August–September sample from the northernmost collection site, Sundsvall (10 carbo and 3 sinensis specimens). Thus, in Sundsvall the sinensis dominance in June switched to carbo dominance in August–September.
Fatty acid analysis
The subsamples of subcutaneous adipose tissue were heated under nitrogen atmosphere in methanolic 1% sulphuric acid with hexane. This procedure hydrolyses lipids and converts the liberated FAs to FA methyl esters (FAMEs), subsequently recovered in hexane (Christie, Reference Christie1993). The FAME composition was quantitatively analysed by gas chromatography (GC) coupled to a flame-ionization detector (FID) (Shimadzu GC-2010 Plus, Shimadzu Scientific Instruments, Kyoto, Japan), and the structures of the individual FAMEs were separately identified by using GC with a mass selective detector (MSD) (Shimadzu GCMS-QP2010 Ultra), recording electron impact mass spectra. Both equipment were furnished with Zebron ZB-wax capillary columns (30 m, 0.25 mm ID and film thickness 0.25 μm; Phenomenex, Torrence, CA, USA). The procedures of the quantitative FA analysis by GC-FID have been described in detail before (Käkelä et al., Reference Käkelä, Käkelä, Kahle, Becker, Kelly and Furness2005; Strandberg et al., Reference Strandberg, Käkelä, Lydersen, Kovacs, Grahl-Nielsen, Hyvärinen and Käkelä2008). Briefly, the FAMEs in hexane were injected (AOC-20s autosampler and AOC-20i autoinjector) into the GC column through the injector port at 250°C (split ratio 1/30), and carried by He (column flow 1.33 mL min−1) through the column in a temperature-programmed oven (180°C for 8 min, ramped 3°C min−1 to 210°C, which was maintained for 50 min), and finally detected by FID at 280°C. Chromatographic peak areas for the total of 57 FAMEs were manually integrated by GCsolution software (by Shimadzu) and the peak area data were converted to FA mol% profiles by using theoretical correction factors for FID (Ackman, Reference Ackman and Chow1992) and several authentic quantitative mixtures of standards (Supelco 37 Component FAME Mix, PUFA Mix 1, 2 and 3 (marine, animal and menhaden source, respectively), and Bacterial Acid Methyl Ester (BAME) Mix, all from Merck KGaA, Darmstadt, Germany). The FAs were abbreviated following the common nomenclature A:Bn-X, where A is the number of carbons, B the number of double bonds, and X the position of the first double bond calculated from the methyl end (e.g. 20:5n-3).
To obtain a measure of the variability of individual FAs in the adipose tissue of the cormorants, the relative standard deviations (RSD) for each studied FA were calculated by dividing the FA mol% standard deviations (SD) with the respective mol% means. The dietary history of the birds was also studied by using FA ratios indicative of different type of prey from different water systems (Käkelä et al., Reference Käkelä, Furness, Kelly, Strandberg, Waldron and Käkelä2007, Reference Käkelä, Käkelä, Martinez-Abrain, Sarzo, Louzao, Gerique, Villuendas, Strandberg, Furness and Oro2010; Tverin et al., Reference Tverin, Esparza-Salas, Strömberg, Tang, Kokkonen, Herrero, Kauhala, Karlsson, Tiilikainen, Vetemaa, Sinisalo, Käkelä and Lundström2019). The two FA ratios calculated were: C18 PUFA/PUFAtot (Sum[18:2n-6, 18:3n-3 and 18:4n-3]/Sum[All PUFA]) and C20–22 MUFA/MUFAtot (Sum[20:1n-11, 20:1n-9, 20:1n-7, 20:1n-5, 22:1n-11, 22:1n-9, 22:1n-7 and 24:1n-9]/Sum[All MUFA]).
Grouping samples for data comparison
For temporal comparisons the collected cormorant specimens were categorized as winter (January), spring (March, April), mid-summer (June), and late summer/autumn (August, September and October) individuals (Figure 1B). The cormorants are assumed to winter between November and February (Cramp & Simmons, Reference Cramp and Simmons1977; Fransson et al., Reference Fransson, Pettersson and Larsson2001). Spring migration mainly occurs in April (Rusanen et al., Reference Rusanen, Mikkola-Roos and Ryttäri2011) and the autumn migration between July and November (Fransson et al., Reference Fransson, Pettersson and Larsson2001), with migration routes following coast lines (Toivanen et al., Reference Toivanen, Metsänen and Lehtiniemi2014). Hence, we consider specimens collected in the southern locations of the Baltic Sea during January and March (and possibly also the two specimens from the beginning of April) as overwintering cormorants. The birds occurring on the Baltic Sea coasts in June were regarded as nesting individuals. The cormorants collected in the area during August, September and October were probably local individuals about to commence their winter migration, or overwintering individuals which had recently arrived to the Baltic Sea (Helsingin Seudun Lintutieteellinen Yhdistys Tringa ry, 2018).
Statistics
To study the seasonal, spatial and subspecies-related differences in the FA signatures of cormorants' adipose tissue, a multivariate Principal Component Analysis (PCA) was applied using Sirius 8.5 software (Pattern Recognition Systems, Bergen, Norway). The relative positions of the samples and variables were plotted using the two most important principal components (PC), and the separations between sample groups were pairwise tested for statistical significance using Soft Independent Modeling of Class Analogy (SIMCA, Wold & Sjöström, Reference Wold, Sjöström and Kowalski1977, included in Sirius 8.5) and regarding P < 0.05 as significant.
To assess spatial and temporal differences of C18 PUFA/PUFAtot and C20–22 MUFA/MUFAtot ratios, analysis of variance (ANOVA) was used. Parametric two-way ANOVA was applied for the C18 PUFA/PUFAtot and followed by Tukey HSD post hoc tests using SPSS Software (IBM SPSS Statistics, Version 26). The other data, into which ANOVA was applied, failed in the tests for normality and homoscedasticity, required for the use of parametric tests. Thus, for these a non-parametric test, Kruskal–Wallis one-way ANOVA on ranks, was used, followed by the Kolmogorov–Smirnov test for pairwise comparisons. Significance level was set at P < 0.05.
Results
No subspecies effect on the adipose tissue fatty acid profiles of Baltic Sea cormorants
Individual adipose tissue FA profiles showed considerable overlap between sinensis and carbo specimens. FA profiles also overlapped between adult and juvenile birds of both subspecies. Thus, for the most part, proportions of individual FAs did not demonstrate differences between the two subspecies, or between different age groups (Table 1, Supplementary Figure S1). The only exception was the adipose tissue samples of the sinensis juveniles, which contained trace amounts of 22:1n-11 (max 0.29 mol%). This level was significantly smaller than that of the carbo adults (max 7.22 mol% with wide range) (Kruskal–Wallis ANOVA df = 3, H = 8.346, P = 0.0394; pairwise Kolmogorov–Smirnov test P = 0.017) (Table 1, Supplementary Figure S1).
The main fatty acids expressed as mean mol% and standard deviation (SD) followed by maximum (Max) and minimum (Min) values in the adipose tissue (N = 77) taken from the knees of Phalacrocorax carbo sinensis (noted sinensis) and P. c. carbo (noted carbo) adult and juvenile (juv.) specimens collected from Sundsvall, Åland Islands, Turku and Blekinge archipelagos

The only statistically significant difference is found between sinensis juveniles and carbo adults in 22:1n-11 (P < 0.05, Kruskal–Wallis one-way ANOVA followed by the Kolmogorov–Smirnov test).
Spatial and temporal differences in FA profiles of Baltic Sea cormorants
We subjected the adipose tissue FA data to PCA in order to reveal compositional differences between specimens collected at different geographic localities and at different months and years (Figure 3). Principal component 1 (PC1) explained 34% of total variation, and in general represented (from left to right) a north–south shift in geographic sample collection (Figure 3A). The Sundsvall samples, however, ranged over most of the PC1 axis, the August–September samples being located on the left and June samples on the upper right corner of the biplot. According to SIMCA, the separations of geographic groups in this PCA (all individuals from the location irrespective of the sampling time were combined) were significant (P < 0.05) in the three pairwise comparisons where the Sundsvall sample was compared with the other three sites, Turku, Åland Islands or Blekinge, one at a time (Figure 3A, insert). The Turku, Åland Islands and Blekinge samples (irrespective of sampling time) did not differ from each other in SIMCA. The FA variables that affected sample separation the most in the PCA comparison were, respectively, 16:1n-7 (enriched in the samples on the left of the scores plot, Figure 3A, e.g. Sundsvall August–September samples), and C20–22 MUFAs (22:1n-11, 20:1n-11 and 20:1n-9 enriched in the samples in the upper right corner or on the right in Figure 3A, e.g. in most Sundsvall June samples and some Blekinge samples). In addition, saturated FAs 16:0 and 18:0 were abundant in samples in the lower right corner of the scores plot (e.g. in some Blekinge samples). Blekinge individuals were also relatively rich in the PUFAs 22:5n-3, 22:6n-3, and 20:4n-6. In this comparison of all samples, no grouping according to subspecies, sex or age was observed. Note that data from individuals collected from Kalmarsund were not included in this analysis due to missing subspecies confirmation, but, if plotted, would be placed close to Blekinge individuals (see also Figure 4A).
PCA scores (A) and loadings (B) plots of adipose tissue fatty acid profiles of cormorant specimens (N = 77) collected from four locations in the Baltic Sea area. Results of paired SIMCA-tests of the compositional differences (P < 0.05) between the geographic groups are presented in an insert in panel A. Individual cormorant samples are marked on the scores plot (A) with the key: [location with a letter][individual number][subspecies, s or c][sex, m or f][age, a or j], where: S, Sundsvall; T, Turku; A, Åland Islands; B, Blekinge; Bw, Blekinge winter 2016; s, Phalacrocorax carbo sinensis; c, P. c. carbo; m, male; f, female; a, adult; j, juvenile; NS, not significant.

PCA scores (A) and loadings (B) plot of the adipose tissue fatty acid profiles of cormorant specimens (N = 32) collected in Jun from Sundsvall (N = 9), Kalmarsund (N = 17) and Blekinge (N = 6). The subspecific identity of the Kalmarsund specimens is unknown. Results of paired SIMCA-tests of the compositional differences (P < 0.05) between the spatial groups are presented in an insert in panel A. Individual cormorant samples are marked on the scores plot (A) with the key: [location with a letter][individual number][subspecies, s or c][sex, m or f][age, a or j], where: S, Sundsvall; B, Blekinge; K, Kalmarsund; s, Phalacrocorax carbo sinensis; c, P. c. carbo; m, male; f, female; a, adult; j, juvenile; NS, not significant.
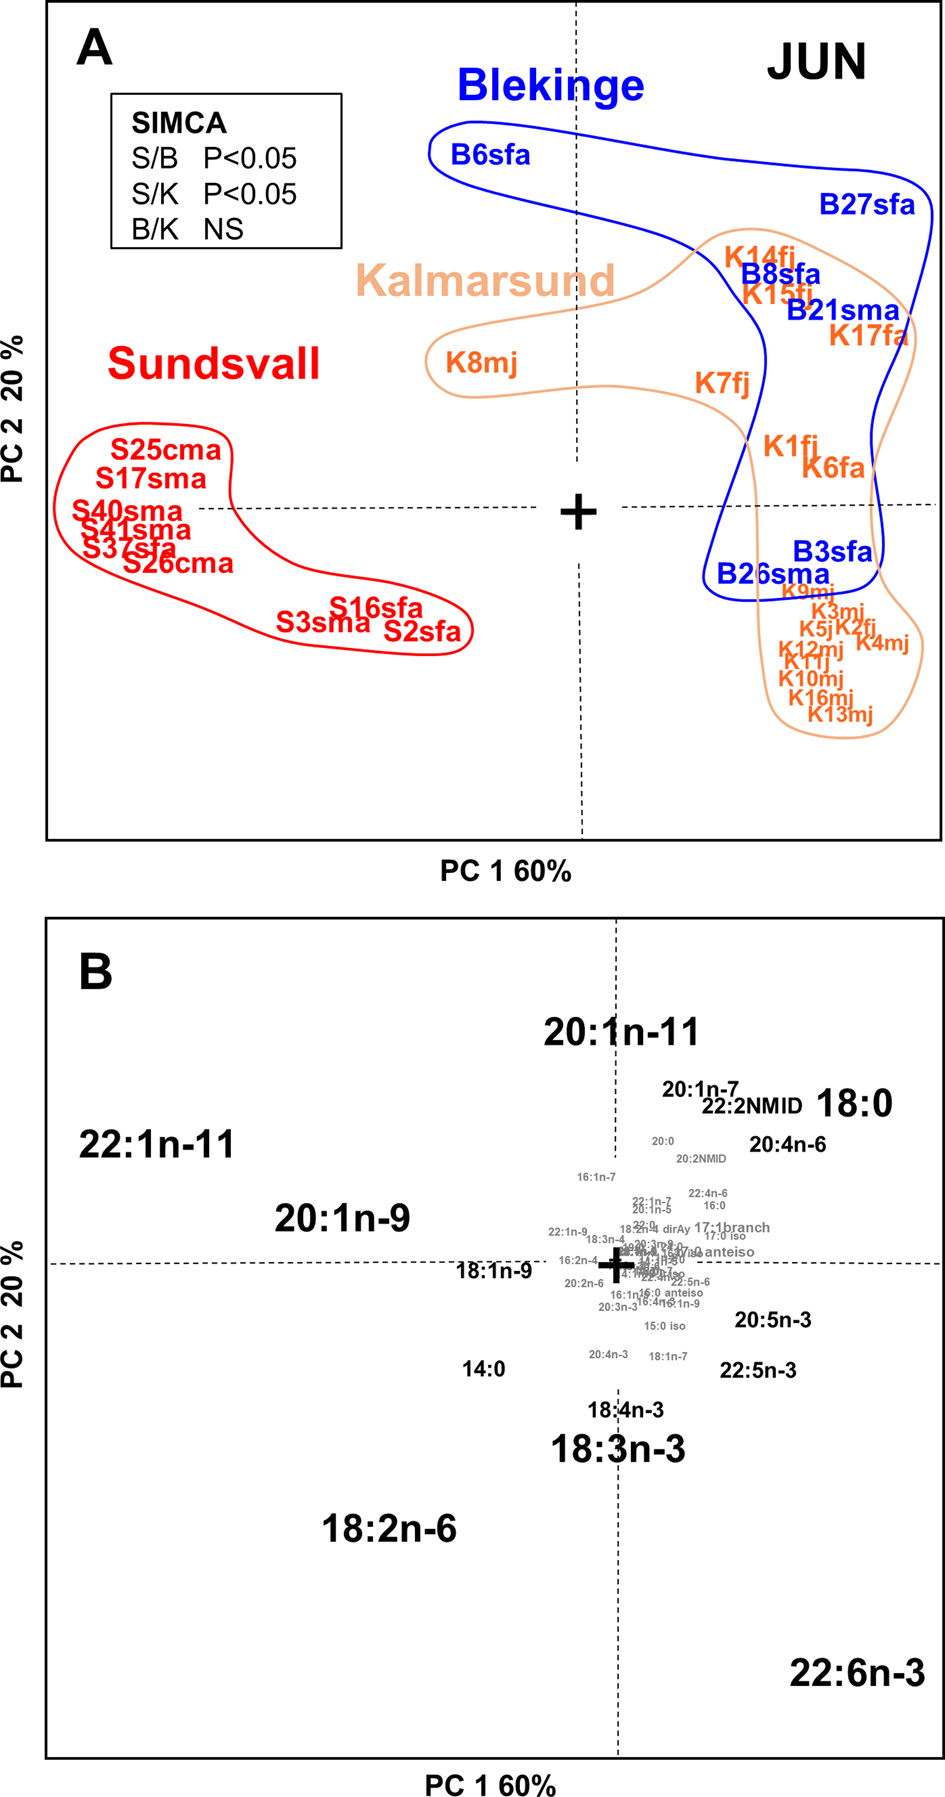
To address spatial differences in tissue FA composition, we first compared cormorants collected in June from Sundsvall (n = 9), Blekinge (n = 6), and Kalmarsund (n = 17) by PCA (Figure 4). According to SIMCA, the birds at the northernmost collection site, Sundsvall, had adipose tissue FA compositions that were statistically significantly (P < 0.05) different from those of the birds collected at the two more southern sites, Blekinge and Kalmarsund. In cormorants from Sundsvall, MUFAs 22:1n-11 and 20:1n-9 as well as the PUFA 18:2n-6 were abundant, while 22:6n-3, 20:1n-11 and 18:0 were abundant in cormorants collected from Blekinge and Kalmarsund. The FA profiles of Blekinge and Kalmarsund cormorants were similar to each other (Figure 4).
Next, we studied the spatial differences in late summer/autumn (August, September and October) by comparing cormorants from Sundsvall (N = 13), Åland Islands (N = 16), Turku (N = 10) and Blekinge (N = 6) (Figure 5). According to SIMCA, only the Sundsvall and Blekinge specimens had statistically significantly (P < 0.05) different adipose tissue FA compositions, with FAs 16:1n-7, C20–22 MUFAs and 18:0 responsible for the data variation. The results of other pairwise comparisons between different sites did not differ significantly from each other. Subspecies, sex or age did not affect the results.
PCA scores (A) and loadings (B) plot of spatial comparison of the adipose tissue fatty acid profiles of cormorant specimens (N = 45) collected in August, September and October from Sundsvall (N = 13), Åland Islands (N = 16), Turku (N = 10) and Blekinge (N = 6). Results of pairwise SIMCA-tests of the compositional differences (P < 0.05) between the spatial groups are presented in an insert in panel A. Individual cormorant samples are marked on the scores plot (A) with the key: [location with a letter][individual number][subspecies, s or c][sex, m or f][age, a or j], where: S, Sundsvall; A, Åland Islands; T, Turku archipelago; B, Blekinge; K, Kalmarsund; s, Phalacrocorax carbo sinensis; c, P. c. carbo; m, male; f, female; a, adult; j, juvenile; NS, not significant.

To address seasonal differences, we compared by PCA the FA profiles of the Sundsvall cormorants (N = 22) collected in June and August–September, and the profiles of Blekinge cormorants (N = 29) collected in January and March–August. In Sundsvall, where the birds collected in June mainly belonged to the subspecies sinensis, the FA profile variation was mainly due to C20–22 MUFAs (Supplementary Figure S2). Sundsvall birds collected in the autumn mainly belonged to the subspecies carbo; in these birds, the MUFA 16:1n-7 and n-3 PUFA 22:6n-3 FAs were abundant. SIMCA test confirmed that the FA compositions in specimens collected in June and August–September in Sundsvall were statistically significantly different (P < 0.05) from each other. Also, in Blekinge the FA composition differed between birds collected in January and June–August (Supplementary Figure S3). In cormorants collected in January, MUFAs 18:1n-9 and 16:1n-7 had high levels, while n-3 PUFAs (22:6n-3, 22:5n-3 and 20:5n-3) had relatively high percentages in cormorants collected in June–August. We detected no significant FA profile differences between the carbo and sinensis subspecies in cormorants collected from Blekinge or Sundsvall.
Fatty acid markers showing the largest individual variation and dietary source
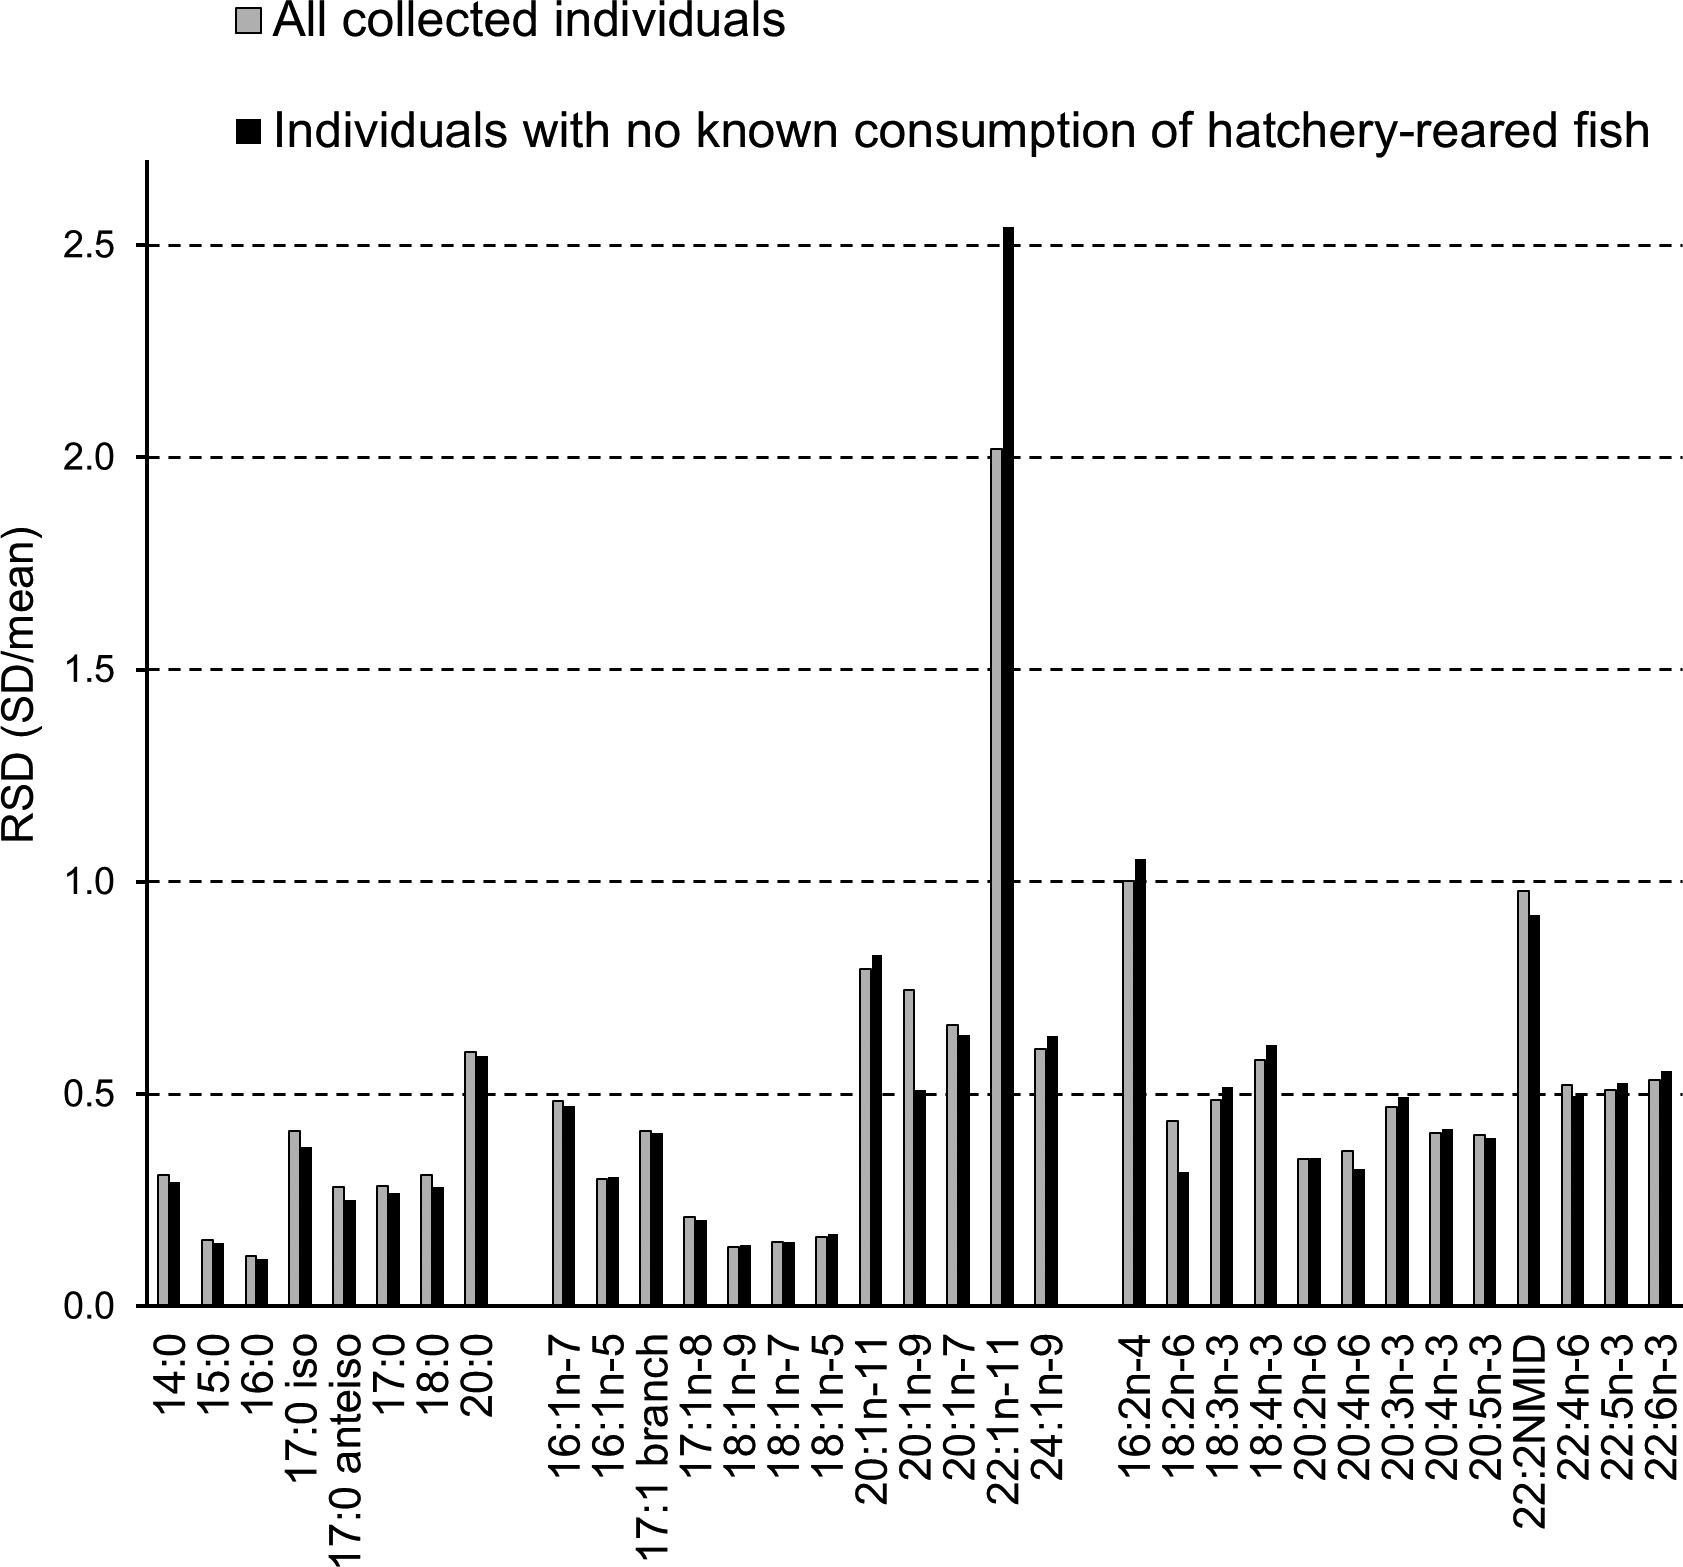
A total of 57 FAs were analysed by GC and the relative amount (mol%) of each FA in the adipose tissue of all the studied cormorant specimens varied markedly. Diet-derived FAs show the largest relative variations (e.g. Käkelä et al., Reference Käkelä, Käkelä, Martinez-Abrain, Sarzo, Louzao, Gerique, Villuendas, Strandberg, Furness and Oro2010). The largest RSD (SD/Mean) among the cormorant specimens was found for 22:1n-11, the value reaching 2.0 (Figure 6). Other C20–22 MUFAs also had high RSD, as well as three minor components of the profile 20:0, 16:2n-4 and 22:2NMID (non-methylene-interrupted diene). In addition, many PUFAs reached the 0.5 level of RSD.
The relative variation in the abundance (mol %) of the main 33 fatty acids (means exceeding 0.2 mol%) expressed as RSD ( = SD/mean) in all collected cormorants (N = 94) and in specimens not known to have consumed hatchery-reared fish (N = 85). The removal of the specimens that had potentially consumed hatchery-reared salmonids enlarged the RSD value of 22:1n-11 from 2.0 to 2.5., which was due to several individuals from the southern sampling locations also having high percentages of 22:1n-11, possibly of Atlantic origin.
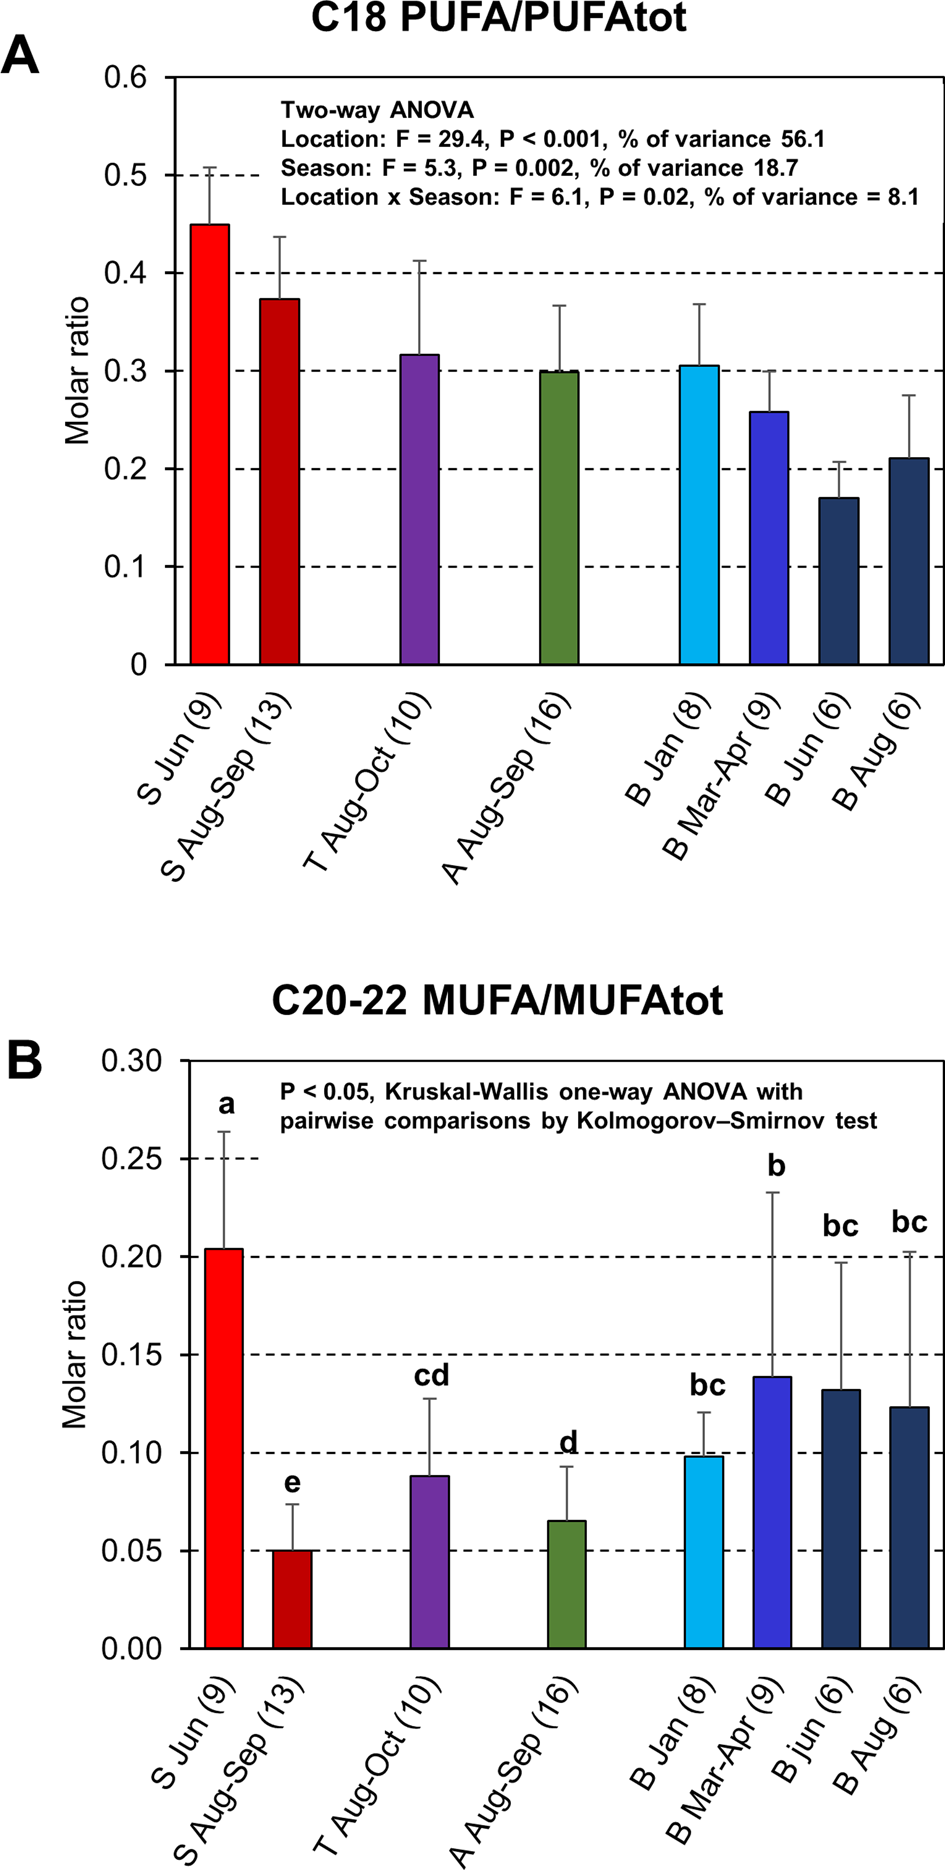
To investigate the possible contribution of freshwater prey or brackish water pelagic prey to cormorant diet, the total proportion of C18 PUFAs was normalized against total PUFAs. To investigate the oceanic influence on the diet, total proportion of C20–22 MUFAs was normalized against total MUFA (Figure 7B). The C18PUFA/PUFAtot ratio data fulfilled the assumptions of normal distribution and homoscedasticity and were thus suitable for a two-way ANOVA. The C20–22 MUFA/MUFAtot ratio data were neither normally distributed nor homoscedastic, and therefore non-parametric Kruskal–Wallis and Kolmogorov–Smirnov pairwise tests were used. Results from the two-way ANOVA showed that ratios of C18 PUFA/PUFAtot varied both due to location (F = 29.4, P < 0.001, proportion of variance = 56.1%) and season (F = 5.3, P = 0.002, proportion of variance = 18.7%), i.e. with location having the largest effect, and with a weak interaction effect between location and season (F = 6.1, P = 0.02, proportion of variance = 8.1%). The C18 PUFA/PUFAtot ratios in the cormorants decreased from Sundsvall to Blekinge, but with no statistically significant difference between samples from Turku and Åland (P = 0.9, Figure 7A). The C18 PUFA/PUFAtot ratios of the Blekinge samples decreased from January to June, and then increased again during August, whereas in the Sundsvall samples the ratio decreased from June to August–September. Statistically significant differences were, however, only found between samples from March–April and June (P = 0.03). In general, the values of C20–22 MUFA/MUFAtot were increasing from the Sundsvall samples to Blekinge samples, with one exception. The Sundsvall sample from June with sinensis dominance had on average the largest relative contents of C20–22 MUFAs (Figure 7B).
Specific fatty acid ratios (mean ± SD) in the adipose tissue of cormorants collected from Sundsvall (S), Turku archipelago (T), Åland Islands (A) and Blekinge (B). The months of collection and number of specimens included are indicated under the bars. In panel (A), a molar ratio of C18 PUFA/PUFAtot (see Materials and methods), which is an indicator of fresh water or brackish water pelagic fish in diet, is displayed with the results from two-way ANOVA of location, season and their interaction effects. In panel (B), a ratio of C20–22 MUFA/MUFAtot (see Materials and Methods), regarded as an indicator of ocean zooplankton-feeding fishes in the diet, is shown. Bars marked with no common letter differed at P < 0.05 (Kruskal–Wallis ANOVA followed by Kolmogorov–Smirnov test, P < 0.05 in both tests).
Discussion
Baltic Sea cormorant diet estimations have previously been made based on gut contents, pellets or regurgitates, which only reflect the most recent meals (Lehikoinen, Reference Lehikoinen2005; Lehikoinen et al., Reference Lehikoinen, Heikinheimo and Lappalainen2011; Östman et al., Reference Östman, Boström, Bergström, Andersson and Lunneryd2013). The approach of determining dietary differences among seabirds by using their tissue FA profiles has become common, and the method has successfully indicated both interspecific (Dahl et al., Reference Dahl, Falk-Petersen, Gabrielsen, Sargent, Hop and Millar2003; Iverson et al., Reference Iverson, Springer and Kitaysky2007; Käkelä et al., Reference Käkelä, Furness, Kelly, Strandberg, Waldron and Käkelä2007; Wold et al., Reference Wold, Jaeger, Hop, Gabrielsen and Falk-Petersen2011) and intraspecific (Käkelä et al., Reference Käkelä, Crane, Votier, Furness and Käkelä2006; Williams et al., Reference Williams, Iverson and Buck2008; Quillfeldt et al., Reference Quillfeldt, Masello, Brickle and Martin-Creuzburg2011; Owen et al., Reference Owen, Daunt, Moffat, Elston, Wanless and Thompson2013) dietary differences. In addition, captive seabirds that have been fed different experimental diets have produced distinct tissue FA profiles (Käkelä et al., Reference Käkelä, Käkelä, Kahle, Becker, Kelly and Furness2005, Reference Käkelä, Furness, Kahle, Becker and Käkelä2009, Reference Käkelä, Käkelä, Martinez-Abrain, Sarzo, Louzao, Gerique, Villuendas, Strandberg, Furness and Oro2010; Iverson et al., Reference Iverson, Springer and Kitaysky2007; Williams et al., Reference Williams, Iverson and Buck2009; Wang et al., Reference Wang, Hollmen and Iverson2010). Thus, in this study, the adipose tissue FA profiling was applied to the Baltic Sea cormorants in anticipation of finding spatial or temporal differences of ecological importance between the individuals. In the case of seabirds, the FA profile of the tissue is clearly reflecting the dietary supply of prey FAs during the last 1–2 months (Williams et al., Reference Williams, Iverson and Buck2009; Käkelä et al., Reference Käkelä, Käkelä, Martinez-Abrain, Sarzo, Louzao, Gerique, Villuendas, Strandberg, Furness and Oro2010; Wang et al., Reference Wang, Hollmen and Iverson2010). At the same time, the high metabolic rate and FA turnover in seabird tissues allow a signal of newly acquired dietary FAs to be detected in the bird's tissues already in one week (Birt-Friesen et al., Reference Birt-Friesen, Montevecchi, Cairns and Macko1989; Williams et al., Reference Williams, Iverson and Buck2009). To be able to interpret the dietary information from FA profiles, knowledge of the FA compositions in potential prey fish from potential foraging areas is needed. This is a challenge in the case of species that perform annual long-distance migrations. We have a large and representative reference data set of FA profiles in Baltic Sea fishes (Tverin et al., Reference Tverin, Esparza-Salas, Strömberg, Tang, Kokkonen, Herrero, Kauhala, Karlsson, Tiilikainen, Vetemaa, Sinisalo, Käkelä and Lundström2019; Tang et al., unpubl. data), but we have to rely on published data regarding the FA compositions of potential dietary items from the Atlantic coastal regions or from northern freshwater bodies. As facilitation to the diet assessment, the lipids of freshwater, brackish water and ocean fish provide the birds with clearly distinct habitat-specific dietary FA patterns (Ackman, Reference Ackman, Arts and Wainman1999). Bearing in mind the limitations that the FA signature of the cormorant adipose tissue may require more than a week for the signal to be detected and our shortcoming of not having a comprehensive fish FA library covering all potential foraging areas, the current study shows an absence of differences of the FA profiles between subspecies but reveals large differences in these profiles between seasons and locations.
No subspecies effect on the adipose tissue fatty acid profiles of Baltic Sea cormorants
According to our results, the two subspecies of cormorant, sinensis and carbo, cannot be distinguished based on their FA profiles (Table 1, Supplementary Figure S1). Adipose tissue FA profiles varied widely among specimens, irrespective of subspecies. Thus, according to these limited data, no indications of characteristic major differences in the foraging habits or preferred prey were found between the subspecies. Only the 22:1n-11 had significantly higher percentages in the samples of the carbo adults than in the sinensis juveniles. Since 22:1n-11 is regarded as a marker for ocean zooplanktivorous fish (Dahl et al., Reference Dahl, Falk-Petersen, Gabrielsen, Sargent, Hop and Millar2003; Dalsgaard et al., Reference Dalsgaard, St John, Kattner, Müller-Navarra and Hagen2003; Wold et al., Reference Wold, Jaeger, Hop, Gabrielsen and Falk-Petersen2011), none of the sinensis juveniles with trace amounts of 22:1n-11 had obviously been foraging outside the Baltic Sea area or consumed hatchery-reared fish with an ocean-type FA signal.
Spatial and temporal differences in FA profiles of Baltic Sea cormorants
Although we could not differentiate between subspecies based on their FA profiles, we observed significant spatial differences in FA profiles. In particular, the Sundsvall specimens were different from the other specimens sampled in Turku, Åland Islands and Blekinge (Figure 3). The Sundsvall and Blekinge samples spanning a period of several months also showed seasonal differences in the FA profiles of the birds hunted at the site. Since the subspecies probably have similar lipid and FA metabolism, these differences found in the spatial and temporal comparisons were apparently due to feeding on different prey. This prey may have been consumed recently or during the previous 1–2 months, possibly also in other foraging areas.
The large compositional difference, found in June between the cormorant samples from Sundsvall and the two southern sampling sites, Blekinge and Kalmarsund, cannot be attributed to the spatial differences of Baltic Sea fish FA composition, except for one marker, the 22:6n-3. The low relative levels of 22:6n-3 in the Sundsvall cormorant samples was in line with the low median levels of 22:6n-3 found in herrings from the northernmost Bothnian Bay (7.4%) compared with herrings collected south of the Åland Islands (11.3–12.0%) (Lind et al., Reference Lind, Huovila and Käkelä2018). Also, the sprat (Sprattus sprattus) of the southern Baltic Sea is especially rich in 22:6n-3 during spring (Keinänen et al., Reference Keinänen, Käkelä, Ritvanen, Pönni, Harjunpää, Myllylä and Vuorinen2018). Thus, the differences in cormorant adipose tissue level of 22:6n-3 may reflect spatial differences in the Baltic Sea fish. However, spatial variations in Baltic Sea fish FA profiles cannot explain the high percentages of 22:1n-11, 20:1n-9 and 18:2n-6 in Sundsvall specimens in June. For these FAs, Baltic Sea fishes show little spatial variance. For example, according to Lind et al. (Reference Lind, Huovila and Käkelä2018) the median values for northern, central and southern samples of Baltic herring varied in the latest sampling year of the study, i.e. 2009, only little: 0.10–0.12% for 22:1n-11, 0.61–0.73% for 20:1n-9 and 3.8–4.0% for 18:2n-6. Consistently, we have reported that the mol% values of 22:1n-11 of the fishes from the central Baltic Sea vary from trace level to 0.2 mol% (Tverin et al., Reference Tverin, Esparza-Salas, Strömberg, Tang, Kokkonen, Herrero, Kauhala, Karlsson, Tiilikainen, Vetemaa, Sinisalo, Käkelä and Lundström2019, Supplementary materials S1 Data), and therefore it is unlikely that the Sundsvall cormorants collected in June could have accumulated the 3–5 mol% levels of 22:1n-11 in their adipose tissue, found in the majority of these specimens, by feeding on wild Baltic Sea fish only.
Since the C20–22 MUFAs are characteristic components of pelagic ocean fish that consume copepods (Dahl et al., Reference Dahl, Falk-Petersen, Gabrielsen, Sargent, Hop and Millar2003; Wold et al., Reference Wold, Jaeger, Hop, Gabrielsen and Falk-Petersen2011), high C20–22 MUFAs could conceivably be markers from Atlantic fish that the birds consumed before migrating to the northern Baltic Sea area. North Atlantic pelagic fishes typically contain 7–20 mol% of 22:1n-11 (Käkelä et al., Reference Käkelä, Käkelä, Kahle, Becker, Kelly and Furness2005; Jensen et al., Reference Jensen, Jacobsen and Nielsen2007), and consumption of these fishes (or other Atlantic prey) resulted in 18 mol% levels of 22:1n-11 in the subcutaneous adipose tissue of the great skua (Stercorarius skua) from Shetland (Käkelä et al., Reference Käkelä, Crane, Votier, Furness and Käkelä2006), and 14 mol% levels in the tissue of the northern fulmar (Fulmarus glacialis) from an Arctic fjord (Dahl et al., Reference Dahl, Falk-Petersen, Gabrielsen, Sargent, Hop and Millar2003). These data suggest that the Sundsvall cormorants collected in June had partly been feeding on fish having a true marine pelagic FA profile. Their adipose tissue signal of 22:1n-11 was far too high to originate from wild Baltic Sea fish but also clearly lower than in the seabirds from the Atlantic.
An interesting detail in the FA profiles of these cormorants was that the 18:2n-6 (but not the other freshwater-type C18 PUFAs) was elevated together with the C20–22 MUFAs (Figures 4B and Supplementary Figure 2B). This enigmatic FA profile of the June sinensis specimens found its most probable explanation when we started to make enquiries on the conditions at the birds' collection site near the Bergeforsen hydropower plant by the river Indalsälven. On 15 June 2017, 298,300 hatchery-reared salmon and 98,200 sea trout smolts were released into the river (by Bergeforsens salmon hatchery, Vattenfall Vattenkraft AB), and the June cormorants we studied were all collected by the same river 10–11 days later. The adjacent hatchery had fed these young salmonid fish with BioMar fishmeal supplemented with fish and vegetable oils. The mixed fish used for the meal were mainly North Atlantic and South American zooplanktivorous species (e.g. blue whiting Micromesistius poutassou and sardine Sardina pilchardus from the north, and anchoveta Engraulis ringens from the south), and the proportion of Baltic Sea fish (mainly herring and sprat) was below 10% (BioMar, 2018). The feeds were also supplemented with fish oils having similarly oceanic origin, and with soybean and palm oils. The North Atlantic pelagic fishes mixed for the feed contain very high percentages of C20–22 MUFAs (~100× the Baltic Sea fish level) while the South American species contained less, although also their levels of these MUFAs were clearly higher than in the Baltic Sea fishes (~10× the Baltic Sea fish level) (Menoyo et al., Reference Menoyo, Lopez-Bote, Bautista and Obach2002; Käkelä et al., Reference Käkelä, Käkelä, Kahle, Becker, Kelly and Furness2005; Petursdottir et al., Reference Petursdottir, Falk-Petersen and Gislason2012). In soybean and palm oils the 18:2n-6 is the only PUFA component (Miller et al., Reference Miller, Nichols and Carter2008; Turchini et al., Reference Turchini, Torstensen and Ng2009). Due to hatchery feed with supplements, hatchery-reared salmon smolts were reported to contain 8 mol% 18:2n-6, more than twice the value of wild smolts (Ackman & Takeuchi, Reference Ackman and Takeuchi1986). Thus, consumption of these hatchery-reared salmon and sea trout smolts was the apparent reason for this combined abnormally strong signal of ocean-type C20–22 MUFAs and 18:2n-6. Concerning the dynamics of cormorant adipose tissue FAs, our data show that recent consumption of hatchery-reared salmonoid smolts was detected only 10 days after this new dietary resource appeared for the opportunistic cormorants.
During summer, the cormorants of each colony exploit mainly Baltic Sea fish, which thus would lessen the differences in adipose tissue FA composition, until autumn migrations could increase local heterogeneity of the adipose tissue FA profiles again. We consider first the possibility that the spatial differences found in the cormorant adipose tissue FA profiles in August–September are simply due to spatial differences in the FA composition of Baltic Sea fish, influenced by the differences in the organismal composition of the food webs in areas with different salinity and nutrient availability. Baltic herrings in the northern, middle and southern Baltic Sea were compared in a retrospective study of Lind et al. (Reference Lind, Huovila and Käkelä2018), and 16:1n-7 was the FA component that consistently had the highest values in the specimens from the northernmost sampling site Harufjärden with several nearby river mouths. Similarly, in our PCA, the high percentage of 16:1n-7 of the Sundsvall cormorant specimens from the river Indalsälven mouth placed them apart from the southern Blekinge specimens collected in August–September 2017. This suggests that locally differing prey FA compositions of Baltic Sea fish would explain a large part of the spatial difference in cormorant adipose tissue FA profiles in early autumn. Indeed, the cormorant FA compositions in these autumn samples from four locations (Sundsvall, Turku, Åland Islands and Blekinge) were relatively similar since in pairwise comparisons. Only the northernmost and southernmost, i.e. the Sundsvall and Blekinge samples, had statistically significantly different FA compositions (SIMCA, P < 0.05). The high 16:1n-7 and low ocean marker 22:1n-11 in the Sundsvall carbo specimens in autumn implies that their diets during the previous month had been fish from the northern Baltic Sea or freshwater fish from the adjacent rivers. Baltic Sea fish, especially demersal species living close to the shore, such as roach (Rutilus rutilus), European whitefish (Coregonus lavaretus) and European eelpout (Zoarces viviparus), contain high mol% of 16:1n-7 (Tverin et al., Reference Tverin, Esparza-Salas, Strömberg, Tang, Kokkonen, Herrero, Kauhala, Karlsson, Tiilikainen, Vetemaa, Sinisalo, Käkelä and Lundström2019, Supplementary materials, S1 Data). In addition, the limited published data suggest that North Scandinavian freshwater food webs do not provide fish or piscivorous birds with C20–22 MUFAs in any significant amount (Persson & Vrede, Reference Persson and Vrede2006; Milardi et al., Reference Milardi, Käkelä, Weckström and Kahilainen2016; Keva et al., Reference Keva, Tang, Käkelä, Hayden, Taipale, Harrod and Kahilainen2019). Thus, despite the assumption that early autumn carbo individuals found in the Baltic Sea area could be migratory birds from North Atlantic colonies, the FA profiles of the birds that formed our sample did not show an oceanic FA signal. This suggests that either they left the oceanic habitats for the Baltic Sea immediately after the breeding season, or they had been spending the breeding season by northern fresh waters or in the Baltic Sea area, and not utilized hatchery-reared fish. In the autumn, the clearest ocean FA signal with C20–22 MUFAs was found in one juvenile carbo individual from Blekinge.
The FA compositions of the cormorants from the central Baltic, i.e. Turku archipelago and Åland Islands, were intermediate between those of the cormorants between the northern and southern locations, which supports the view that the geographically gradually altering local fish FA composition is the main reason behind the observed gradual south–north shift in the autumn FA profiles of the Baltic Sea cormorants (Figure 5). Conceivably, the Åland Islands could function as a temporary pit-stop for cormorants during their autumn migration southward. However, the low C20–22 MUFA/MUFAtot ratio and high C18 PUFA/PUFAtot in all the specimens (mainly sinensis, juveniles and adults) collected from Åland Islands (Figure 7B) clearly indicated that these individuals had exploited a fresh/brackish water habitat and prey for a longer period of time, i.e. during the nesting season of the preceding summer.
When addressing temporal differences in the FA profiles of cormorants from the southernmost sampling location, Blekinge, it was found that the adipose tissue FA profiles of these birds were relatively similar, and only the winter 2016 and summer 2017 specimens had statistically significantly different FA profiles. The relatively stable seasonal FA profiles of the Blekinge individuals suggests continuous exploitation of similar prey in the same area. A strong ocean 22:1n-11 signal was found only in two specimens collected in the spring and two collected in the summer. This suggests that most of these individuals had spent most of the year at the southern Baltic Sea with no long-distance migrations to Atlantic coast, but, apparently, some of them either perform foraging trips to the Atlantic side, find shoals of fish coming from the Atlantic, or utilize hatchery fish. The adipose tissue of the January specimens contained smaller percentages of PUFAs than were found in the March–August specimens from this location. This could reflect negative metabolic status of the January specimens due to either poorer availability of fish prey and/or their lower nutritional value compared with the rich late summer and autumn months. When adipose tissue FAs need to be mobilized for energy, the PUFAs are hydrolysed and released most efficiently (Raclot, Reference Raclot2003). In addition, the PUFA contents (mg g−1 tissue) of Baltic herring samples from the southern Baltic Sea are at the highest level in the autumn, after which the PUFA contents largely decrease for the winter and start to increase again in the spring (Szlinder-Richert et al., Reference Szlinder-Richert, Usydus, Wyszyński and Adamczyk2010). For the other dominant pelagic fish of the area, the sprat, the highest lipid and PUFA contents were recorded during feeding season (July–October), after which the values start decreasing and reach the minima in the spawning season, which starts in March (Usydus et al., Reference Usydus, Szlifder-Richert and Adamczyk2012). Therefore, it is possible that the low PUFA percentages in the cormorant adipose tissues during winter reflect the seasonally lowered PUFA levels in the fish of the southern Baltic, and when food is scarce the FA mobilization prefers PUFAs. Since the adipose tissues of the winter specimens contained small percentages of C20–22 MUFAs, apparently Atlantic pelagic fish do not comprise any significant proportion of their early winter diet.
Fatty acids markers showing largest individual variation and dietary source
From a methodological point of view, the individual FAs that show the largest relative variation among the studied avian adipose tissue samples are the best indicators of individual diet. Based on this study, the 22:1n-11 was by far the most sensitive dietary marker in cormorants collected from the Baltic Sea area. There are several possible explanations for the high individual variability of 22:1n-11 (calculated as RSD). The first explanation is that a part of the population exploits an oceanic diet prior to migration and subsequently retains high relative concentrations of C20–22 MUFAs in their adipose tissues. This is theoretically possible as the 22:1n-11 from adipose tissue lipids hydrolyses less efficiently than most other FAs (Raclot, Reference Raclot2003), Consequently, it has a slow turnover rate, which makes the 22:1n-11 signal more persistent and is retained longer in tissues than the signals of other FAs, despite efficient use of FAs for fuel. The second explanation for high RDS value for 22:1n-11 is the occasional access to hatchery-reared salmonoid smolts raised with ocean fish meal. The smolts were possibly consumed by the June Sundsvall birds, which subsequently presented high percentages of C20–22 MUFAs and high RSD values for C20–22 MUFAs. The RSD value was even larger after removing the 9 June Sundsvall specimens from the data. This was presumably due to several specimens from the southern Blekinge sampling locations also having high percentages of 22:1n-11, which possibly originated from wild truly marine prey from the Atlantic, or, alternatively, from hatchery-reared fish. Although about 2500 sea trout smolts were reportedly released close to this southern cormorant collection area in 2017 (CAB of Blekinge), the number is much lower than the number of smolts released in the Sundsvall area in the same year. All MUFAs or SFAs longer than 20 carbons had high RSD values, and their dietary origin is likely the same. Especially interesting is the 20:1n-11 since it was reported to appear in the plasma of captive herring gulls (Larus argentatus) after consuming pelagic herring (Clupea harengus harengus) rich in 22:1n-11 (Käkelä et al., Reference Käkelä, Furness, Kahle, Becker and Käkelä2009). Since in the experiment the dietary supply of 20:1n-11 remained low, it appears that the elevated tissue 20:1n-11 was a retained product of shortened 22:1n-11.
Large RSD values for the minor FA components 16:2n-4 and 22:2 NMID observed in the cormorants in this study are possibly indicative of plankton-filtering bivalves (Irazú et al., Reference Irazú, Pollero and Brenner1984; Silina & Zhukova, Reference Silina and Zhukova2009; Lazzara et al., Reference Lazzara, Fernandes, Faria, López, Tauler and Porte2012), regarded as rare dietary items for the cormorants in the Baltic Sea. Furthermore, fish species in the Baltic Sea have relatively large variability in their relative contents of individual PUFAs (Tverin et al., Reference Tverin, Esparza-Salas, Strömberg, Tang, Kokkonen, Herrero, Kauhala, Karlsson, Tiilikainen, Vetemaa, Sinisalo, Käkelä and Lundström2019, Supplementary materials, S1 Data), which may explain their large RSD values in cormorant adipose tissue. For example, C18 PUFAs distinguish freshwater fish species or Baltic Sea species with pelagic ecology (herring, sprat and salmonids), while the highly unsaturated 22:6n-3 is abundant in fish species with a coastal predatory ecology and also in pelagic young sprat. The PUFA 20:4n-6 and MUFAs 16:1n-7 and 20:1n-7 are characteristic for the species feeding on benthic food. At the same time, the FAs that can be de novo synthesized, such as 16:0, 18:0 and 18:1n-9, had the smallest mol% RSD values in the adipose tissue of the cormorants, as found earlier for plasma RSDs of these FAs in other seabirds (Käkelä et al., Reference Käkelä, Furness, Kelly, Strandberg, Waldron and Käkelä2007, Reference Käkelä, Käkelä, Martinez-Abrain, Sarzo, Louzao, Gerique, Villuendas, Strandberg, Furness and Oro2010).
The dietary source can be revealed by individual FAs or FA ratios. The C18 PUFA/PUFAtot ratio of the cormorant adipose tissues showed a clear decreasing trend from the north to south, apparently since freshwater food web characteristics (arising from plankton) decrease towards the south along with increasing salinity (Peltomaa et al., Reference Peltomaa, Hallfors and Taipale2019). The expectation was that the ratio C20–22MUFA/MUFAtot would have shown the opposite trend, increasing values from the north to south, but in this study, two exceptions were found: the Sundsvall June sample of sinensis had high C20–22MUFA content (likely due to catching hatchery-reared salmonids), and the Blekinge specimens from March to August had very high variability of this ratio (possibly due to having fed both on Baltic Sea and Atlantic fishes). Hatchery-reared salmonids may contribute to the cormorant diet in the southernmost sampling areas, but this is more likely to be the case in the north, in the Sundsvall area, where hatchery-reared fish are released in much larger numbers.
Conclusions and future directions
The cormorant specimens collected in the Baltic Sea had a regionally differing tissue FA composition due to opportunistic feeding and locally varying availability of different prey. The sensitive FA marker 22:1n-11, found to be high in Sundsvall carbo individuals in mid-summer, is not likely to have originated from any prey items that occur naturally in the Baltic Sea. Thus, our method was able to detect that the cormorants had fed either on hatchery-reared fish raised with ocean fish meal, or on true marine fish at Atlantic locations during the few months before breeding. This provides a tool for future studies relating the individual feeding strategies and wintering and migration patterns with the breeding success of cormorants. Such potential differences in the foraging behaviour and habitat use of the birds in different colonies could predict the future fate of the colonies in different parts of the Baltic Sea (Ceia & Ramos, Reference Ceia and Ramos2015). The progressing climate change may have a large impact on the dietary choices of the cormorants, and in the future a growing proportion of the cormorants may winter in the Baltic Sea, provided that their nutritional status remains adequate for successful breeding in summer. However, if the cormorants returning in spring to the Baltic Sea area from Atlantic coasts, continental Europe or the Mediterranean area were in better physical condition for the breeding season than the individuals that overwinter in the Baltic Sea area, the populations largely comprised of overwintering individuals would probably increase slowly. For ecosystem-based management of aquatic resources it would be crucial to understand how the seabird migration patterns and increase rates of local colonies are affected by global climate change vs local factors. The latter include various anthropogenic influences, such as competition with fisheries, hunting or eutrophication, which affect the quantity, species diversity and nutritional quality of the available prey. To make correct interpretations on the complex causes and effects, such environmental studies require accurate information on the nutrition and utilized food sources of the seabirds. Cormorants are an excellent model species for such studies, since the individuals found in the area may have utilized various feeding areas, different Baltic, Atlantic, continental European or Mediterranean locations, and in each location part of the food could have been acquired from freshwater rivers, deltas or lakes. In addition, the opportunistic cormorants utilize easy catches of hatchery-reared fish.
Future studies would require collecting a comprehensive FA signature library of all potential prey species but also determining their total lipid contents, which determine the efficiency of the trophic transfer of the dietary FA signals. In addition, feeding experiments would give calibration factors converting dietary FA percentages to respective percentages in cormorant adipose tissue. These would be the prerequisites for truly quantitative FA signature analysis (QFASA, Iverson et al., Reference Iverson, Field, Bowen and Blanchard2004), further increasing the resolution power of the FA approach. Also, other chemical markers detectable from small samples of adipose tissue can be employed to supplement information from FA markers. The contribution of true freshwater prey to seabird diet may be studied by determining the molar ratio of the freshwater specific analogue of the fat-soluble vitamin A, i.e. A2 (3,4-didehydroretinol) to the marine and brackish water analogue A1 (retinol) (Käkelä et al., Reference Käkelä, Käkelä and Hyvärinen2002a, Reference Käkelä, Käkelä, Hyvärinen and Asikainen2002b).
The procedure of sampling superficial adipose tissue on the knee of the birds by biopsy is not unduly invasive, and the sampling of subcutaneous adipose tissue has not been found to harm the birds (Iverson et al., Reference Iverson, Springer and Kitaysky2007; Käkelä et al., Reference Käkelä, Käkelä, Martinez-Abrain, Sarzo, Louzao, Gerique, Villuendas, Strandberg, Furness and Oro2010; Owen et al., Reference Owen, Daunt and Wanless2010; Rocha et al., Reference Rocha, Araújo, Martinho, Ramos and Masero2016). The simple procedure of taking representative adipose tissue samples from hunted carcasses or living birds, the sensitivity of the FA markers in indicating different dietary items, and consequent promises of gaining significant ecological information, support more frequent use of FA markers in monitoring studies of migrating seabirds.
Supplementary material
The supplementary material for this article can be found at https://doi.org/10.1017/S0025315420001320
Acknowledgements
Technicians Kira Kumma and Mihajlo Lindholm are thanked for their skilful contribution to the laboratory analyses. Technician Elina Laurén is thanked for the assistance with the preparation of cormorants. We also thank all the organizations and hunters that provided us with samples from the Swedish and Finnish locations.
Financial support
This work was supported by Svenska Kulturfonden Rf (grant number 103427), Suomen Kulttuurirahasto Ry (grant number 00171108), and Oskar Öflunds stiftelse.


 Open access