


Strategies for controlling food consumption are important for weight management and the prevention of chronic health conditions like obesity and type 2 diabetes. Recently, behavioural economics has been identified as a source of strategies to help control food consumption. Behavioural economics applies theories from cognitive psychology to understand how people make decisions; according to a systematic review of behavioural interventions to promote intake of healthy foods, achieving healthy food intake at recommended levels will require stronger behavioural interventions that draw knowledge from other approaches, such as the theory of behavioural economics( Reference Bickel, Moody and Higgins 1 , Reference Thomson and Ravia 2 ). In fact, Song et al.( Reference Song, Grutzmacher and Munger 3 ) found that a nutrition programme that combined a behavioural economics approach and nutrition education led to increased consumption of healthy foods.
According to behavioural economics, decisions about which foods to eat, and how much to eat, rely on fast and automatic cognitive processes( Reference Kahneman 4 ). Previous studies have found that decisions about what and how much to eat are linked to the order or placement of food on shelves in stores( Reference Hanks, Just and Smith 5 , Reference Wilson, Just and Swigert 6 ), labelling of food items( Reference Olstad, Goonewardene and McCargar 7 ), economic incentives such as discount sales( Reference Olstad, Goonewardene and McCargar 7 ) and portion size( Reference Berkowitz, Marquart and Mykerezi 8 ). These strategies have been called ‘nudges’, implying that they are a way to push slightly or gently to get someone’s attention or prod them into action; several such strategies have a proven influence on diet and food consumption.
In terms of controlling the amount of food consumption, portion size is important. A previous study reported that intakes of total fat, saturated fat, cholesterol and sodium of customers were lower when both reduced-size and full-size entrées were offered as alternatives than when only full-size entrées were offered in a worksite cafeteria and a commercial upscale restaurant( Reference Berkowitz, Marquart and Mykerezi 8 ). Meta-analyses covering many countries clarify the effects of portion size on food consumption( Reference Zlatevska, Dubelaar and Holden 9 , Reference Hollands, Shemilt and Marteau 10 ). Although the systematic review included several studies, the only study conducted in Asia was in South Korea. Regarding differences in portion size by country, Rozin et al.( Reference Rozin, Kabnick and Pete 11 ) suggested that portion sizes in the USA were larger than in France. With respect to package size, Poelman et al.( Reference Poelman, Eyles and Dunford 12 ) suggested that substantial within- and between-country variation exists in recommended serving sizes for sweet drinks across Australia, Canada, the Netherlands and New Zealand.
Japanese people, in particular, have a characteristic food culture and manners during meals. For example, almost all Japanese eat rice every day as a staple food, and they learn at home and at school that leaving food on the plate is bad manners( 13 ). On the other hand, leaving food indicates gratitude for hospitality in China; there, it means that one ate until completely full. There is a distinct possibility that the effect of portion size on food consumption among Japanese differs from that among people in other countries in Asia and elsewhere.
The effects of previous interventions manipulating portion sizes have been only small to moderate, leading to calls for more effective interventions, according to reviews( Reference Wright and Bragge 14 , Reference Steenhuis and Poelman 15 ). To develop effective interventions involving reducing portion size, researchers have studied numerous factors and mechanisms to understand the relationship between portion size and food consumption( Reference Steenhuis and Poelman 15 – Reference Peter, Herman and Polivy 17 ). ‘Appropriateness’ is one such mechanism, which states that people interpret the portion they are served as being of an appropriate size and eat the entire portion accordingly. Another is ‘visual cues’, which posits that when more food is present, more will be consumed. Next, ‘previous experience/expectation’ states that a person’s previous experience of eating a food, and the degree of fullness previously obtained, influences the portion size selected and consumed at later times. Finally, ‘external factors’ also play a role in food consumption; these factors include the value of food for the money paid, levels of awareness and estimation bias.
Recently, there have been many studies about plate size associated with visual cues. When a circle is enclosed in a larger circle that is proximal it will be perceived as larger and when distal, smaller; this phenomenon is called the Delboeuf illusion( Reference Van Ittersum and Wansink 18 ). The Delboeuf illusion influences eating behaviours because most people use a plate at their meals, and people tend to feel a large meal in a small plate and a small meal in a large plate. Other research has demonstrated that plate size can affect satiation and expectations of satiation. Specifically, one study( Reference Peng 19 ) found that a small plate was associated with higher estimated satiation and lower estimated intake than a larger plate and suggested that this was because the portions appeared different to the eater. Other studies have also investigated the effects of plate size on food intake and fullness, but their results have been inconsistent( Reference Ayaz, Akyol and Cetin 20 – Reference Stroebele-Benschop, Dieze and Hilzendegen 25 ). According to a systematic review, the difference in food consumption between small and large plate conditions was marginally statistically significant, but effect magnitude was small because of inconsistent results( Reference Robinson, Nolan and Tudur-Smith 26 ); subgroup analysis suggested that participant characteristics (weight status), type of dish (plate or bowl), place of experiment (outside or inside a laboratory) and food type (snack or main meal) may influence these results. In other studies, sex and nationality influenced the relationship between dish size and food consumption, but there are few studies on this in Asian countries, including Japan( Reference Peng, Adam and Hautus 27 ).
Many studies have investigated behavioural economic factors on food consumption and food choice. Recently, the effects of combinations of more than two behavioural economic factors have come to be investigated. Wilson et al.( Reference Wilson, Just and Swigert 6 ) found that packaging and placement order influenced food choice. The combination of behavioural economic factors may be more effective on food consumption than single effects and have an interactive effect on food consumption.
The purpose of the present study was to address gaps in the extant literature regarding behavioural economic factors, eating behaviours and other cultural factors that can influence food consumption. More specifically, the goal was to address the respective and interactive effects of portion size and bowl size on intake and fullness among Japanese men. In Japan, the rate of obesity among men is higher than it is for women( 28 ) and white rice contributes most to total daily energy intake in the Japanese diet( 28 ). Therefore, the study targeted Japanese men and focused on rice and rice bowls.
Methods
Participants
The participants were workers at Ochanomizu University recruited through advertising leaflets and email announcements sent by faculty members at the university. Due to the nature of the study, to avoid demand characteristics, participants were not told the study objective; instead they were told that they would be taking part in a survey about flavour preferences. The true objective of the study was not told through the surveys to avoid demand characteristics. Eligible participants were men between the ages of 20 and 60 years, without any food allergies to the meals provided in the study. On the advertising leaflets and email, it was stated that the study contained four times experimental meals and questionnaires before and after meals to examine their flavour preferences. Before the experiments, the participants were informed that they could withdraw from the study at any time.
Experimental design
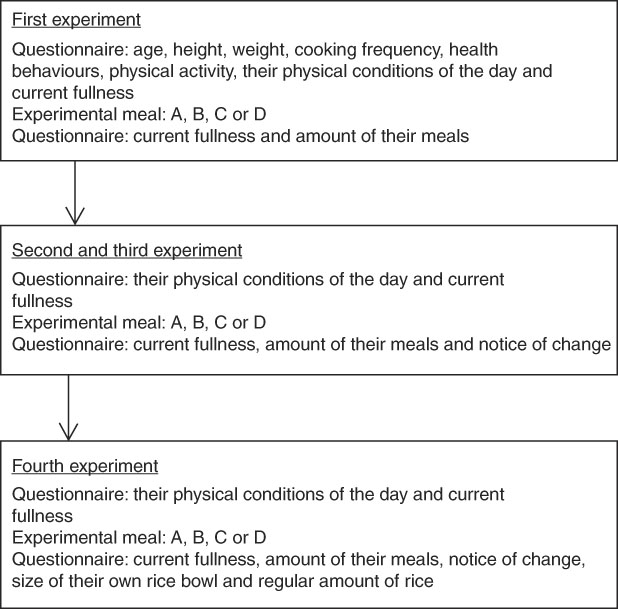
Participants ate lunch in a classroom at the university and answered questionnaires before and after the meals once per week for a period of four weeks (Fig. 1). Participants were asked to not to change their typical lifestyle habits (eating behaviours and physical activity) on the day before each study day. Experimental meals were scheduled at the same time of day each time. Participants were asked to eat the same breakfast on each study day and not to consume any foods and beverages in the hour before lunch.
Study procedure. Participants ate four different experimental meals and answered questionnaires before and after the meals, once per week, for four weeks
Each week, participants were guided to a specified table in the room and given one of the four possible meals, named A, B, C and D (Figs 2 and 3). The meal labels were not seen by participants, to disguise the purpose of the study. Participants were seated at separate tables, facing in the same direction, so that they could concentrate on their meals. Meal A contained 150 g of rice in a small rice bowl (diameter of 11·5 cm). Meal B contained 150 g of rice in a large rice bowl (diameter of 13·5 cm). Meal C contained 250 g of rice in a small rice bowl. Meal D contained 250 g of rice in a large rice bowl. The order in which participants were given the different meals (rice bowl sizes and amounts of rice) was randomly assigned to adjust for order effects, using random numbers in Microsoft® Excel. Participants were not explicitly informed of the changes in bowl size or portion size; they were later asked if they noticed any differences. In addition to the rice, participants were served the same foods and beverage in the same amounts: 120 g of deep-fried chicken (1473 kJ (352 kcal)), 50 g of tomato salad (92 kJ (22 kcal)), 100 g of coleslaw (297 kJ (71 kcal)) and 280 ml of green tea (0 kJ (0 kcal)). The total energy of the dishes except the rice was 1862 kJ (445 kcal). The amounts of rice and other foods were in accordance with the ‘Japanese Health Meal’ developed by the national Ministry of Health, Labour and Welfare( 29 ). Meals A and B were 2916 kJ (697 kcal) each; Meals C and D were 3619 kJ (865 kcal) each. Participants were instructed to eat as much of the meal as they wanted and were then permitted to obtain refills on as much rice as they wanted by raising their hand. The amount of rice participants took when getting refills was weighed. Because Japanese people tend to hesitate when it comes to refilling their bowls or leaving the table immediately after eating, the researchers encouraged the participants to not feel embarrassed and to take more rice at any time, and to feel free to leave the table when they felt that the amount of rice taken was more than they could eat. After the participants finished eating and left the classroom, the foods left over were weighed using a digital cooking scale (Tanita KD-320-WH).
The two sizes of rice bowl and two amounts of rice used in the present study. Rice bowls A and C were 11·5 cm in diameter. Rice bowls B and D were 13·5 cm in diameter. The amount of rice served in A and B was 150 g. The amount of rice served in C and D was 250 g

Experimental meal (Meal A). The experimental meal included rice, deep-fried chicken, tomato, coleslaw and green tea. The size of the rice bowl and the amount of rice changed over the four experimental meals

Measures
Before and after each experimental meal, participants answered questionnaires. The questionnaire before the first experimental meal included items on age, height, weight, cooking frequency, health behaviours (four items) and physical activity. Health behaviour items covered the following topics: whether or not the participant ate to the point of fullness, refrained from eating fatty foods, refrained from eating high-carbohydrate foods and ate a lot of vegetables. The four responses were ‘always’, ‘sometimes’, ‘rarely’ and ‘never’. Furthermore, to disguise the objective of the study, participants were asked to report their flavour preferences. Each questionnaire that was administered before meals included the participant’s physical conditions of the day. They also rated their fullness using a 100-point visual analogue scale.
Questionnaires were administered after participants consumed the meals. They rated their fullness using the 100-point visual analogue scale. They were asked at each meal ‘How much was the amount of your meal you were served?’ and answered from five responses which were ‘very little’, ‘little’, ‘appropriate’, ‘a lot’ and ‘a whole lot’. To disguise the purpose of the study, participants also rated their flavour preference for the meal using the question ‘How did it taste?’ The five responses were ‘most favourite flavour’, ‘favourite flavour’, ‘between favourite and unfavourite’, ‘unfavourite’ and ‘most unfavourite’. After the second time the participants visited the room to eat, they were asked whether they noticed differences between the first and the second experimental session, and were provided with free descriptive space to write their responses. On the fourth survey (only), after participants had consumed the meal and completed the questions (which were the same questions asked after Meals 2 and 3), they were shown a large and small rice bowl and asked to rate the size of their own bowl using the following responses: ‘smaller than the smaller rice bowl’, ‘the same size as the smaller rice bowl’, ‘between the smaller rice bowl and the larger one’, ‘the same size as the larger rice bowl’ and ‘larger than the larger rice bowl’. The average amount of rice in the participant’s rice bowl was assessed by having participants choose one of five illustrations that most closely matched their standard eating habits (respectively showing 110 g, 140 g, 165 g, 200 g and 230 g in the same size rice bowl) used by the Japanese National Health and Nutrition Survey( 30 ).
Statistical analysis
Sample size was calculated using G*Power 3.1.9.2 software( Reference Faul, Erdfelder and Buchner 31 ) for two-way repeated-measures ANOVA between and within factors and for within–between interactions. A power analysis calculation indicated that with two factors and two levels, for power of 0·8 and effect size (f) of 0·25, described as medium by Cohen( Reference Cohen 32 ), at least seventeen participants were required to conduct experimental meals four times each.
Fullness was calculated by subtracting fullness before the meal from fullness after the meal. Repeated-measures ANOVA was used to investigate effects and interactions between portion size and bowl size on food intake and fullness. All analyses were conducted using the statistical software package IBM SPSS Statistics for Windows, version 19.0. Statistical significance was set at P<0·05.
Results
Complete study data were obtained from twenty-one participants. The characteristics of participants are shown in Table 1. Five participants (24 %) were overweight based on their BMI (BMI≥25·0 kg/m2). As noted above, participants were allowed to refill only with rice; it was refilled five times over the total of eighty-four meals. The number of times rice remained was two; other dishes were never left unfinished. The mean fullness before the meal across four meals was 26·0 (sd 12·8) and after the meal, 86·1 (sd 6·2). The mean fullness before and after for Meal A (small rice bowl, small amount of rice served) was 27·1 (sd 17·0) and 84·3 (sd 6·8), respectively. For Meal B (large rice bowl, small amount of rice served), it was 28·8 (sd 17·1) and 84·3 (sd 7·5), respectively; for Meal C (small rice bowl, large amount of rice served), 20·7 (sd 13·4) and 88·3 (sd 7·5), respectively; and for Meal D (large rice bowl, large amount of rice served), 27·4 (sd 19·9) and 87·6 (sd 8·9), respectively.
Characteristics of the participating Japanese men (n 21), September to October 2017
* The number and rate of participants who answered ‘always’ or ‘sometimes’.
Responses on whether amounts were appropriate are shown in Table 2. About 80 % of participants responded that the amounts of tomato, coleslaw and chicken were appropriate, while about half the participants responded that the amount of rice (250 g in Meals C and D) was ‘a whole lot’ or ‘a lot’.
Perception of the amount of each dish among the sample of Japanese men (n 21), September to October 2017
Rice A to D, number of observations=21; tomato salad, coleslaw and deep-fried chicken, number of observations=84.
Overall, fourteen of the participants (67 %) reported that they noticed changes in the amount of rice that they were given across the four study sessions. For fifteen of the participants, the amount of rice given in the meals decreased from the first to the last study session. Twelve of these participants (80 %) reported that they noticed this decrease in the amount of rice. For sixteen of the participants, in contrast, the amount of rice increased from the first to the last meal; nine of these participants (56 %) reported that they noticed an increase in the amount of rice. None of the participants reported noticing a change in the size of their rice bowl.
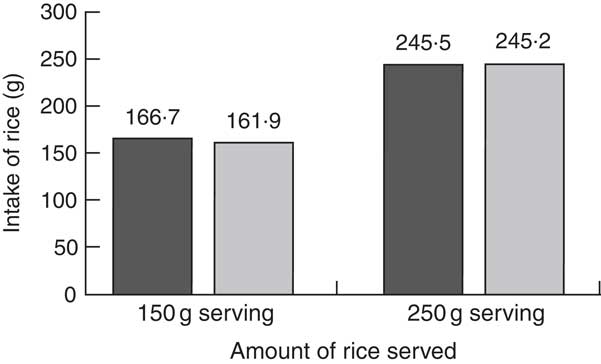
The amount of rice served had a significant main effect on intake of rice during the meal (F (1,20)=83, P<0·001; Fig. 4), whereas bowl size did not (F (1,20)=0·36, P=0·555). The mean intake of rice was 166·7 (sd 45·0) g when 150 g of rice was served in a small rice bowl, 161·9 (sd 37·6) g when 150 g was served in a large rice bowl, 245·5 (sd 20·7) g when 250 g was served in a small rice bowl and 245·2 (sd 22·0) g when 250 g was served in a large rice bowl. There was no significant interaction between the amount of rice served and the size of the rice bowl on the intake of rice (F (1,20)=0·28, P=0·601). As for mean energy intake from the meals (overall), that with the 150 g serving in the small bowl amounted to 3033 kJ (725 kcal), that with 150 g in a large rice bowl was 3000 kJ (717 kcal), that with 250 g in a small rice bowl was 3586 kJ (857 kcal) and that with 250 g in a large rice bowl was 3586 kJ (857 kcal).
Intake of rice from the four experimental meals by the sample of Japanese men (n 21), September to October 2017. The amount of rice served had a significant main effect on intake of rice in the meal (P<0·001). The main effect of bowl size (![]() , small;
, small; ![]() , large) and the interaction of the amount of rice served and bowl size on intake were not significant
, large) and the interaction of the amount of rice served and bowl size on intake were not significant
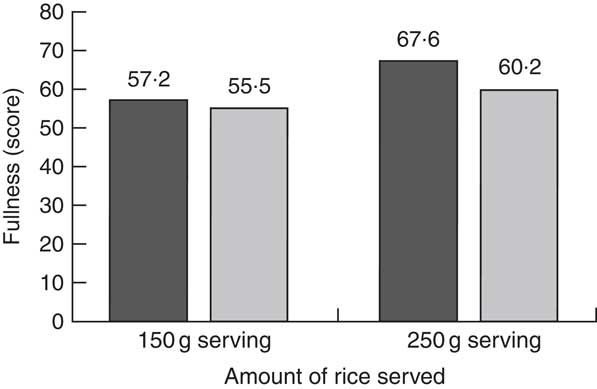
The amount of rice served had a significant main effect on fullness (F (1,20)=8·0, P=0·010; Fig. 5), whereas bowl size did not (F (1,20)=2·2, P=0·155). Mean fullness was 57·2 (sd 17·2) when 150 g of rice was served in a small bowl, 55·5 (sd 16·8) with 150 g of rice in a large bowl, 67·6 (sd 16·2) with 250 g in a small bowl and 60·2 (sd 17·7) with 250 g in a large bowl. The interaction between the amount of rice served and the size of the rice bowl on rice intake was not statistically significant (F (1,20)=1·7, P=0·207).
Fullness rating of the four experimental meals by the sample of Japanese men (n 21), September to October 2017. The amount of rice served had a significant main effect on fullness (P<0·001). The main effect of bowl size (![]() , small;
, small; ![]() , large) and the interaction of the amount of rice served and bowl size on fullness were not significant.
, large) and the interaction of the amount of rice served and bowl size on fullness were not significant.
Discussion
The results of the present study suggest that the amount of rice served affected rice intake and self-rated fullness among Japanese men. However, neither the main effects of bowl size on intake and fullness nor those of interactions between amount of rice served and bowl size on intake and fullness were significant. More than half of participants noticed a change in the amount of rice during the study, but no participants noticed the change in the size of the rice bowl.
The intake and fullness of participants increased when they were served larger portion sizes; this result is consistent with previous studies( Reference Berkowitz, Marquart and Mykerezi 8 – Reference Hollands, Shemilt and Marteau 10 , Reference Wright and Bragge 14 , Reference Steenhuis and Poelman 15 ) and suggests that individuals are likely to overeat if they are served more food. More than half of participants answered that their regular amount of rice was less than 150 g, but only a few people left their rice when they were served 250 g rice. There are cultural considerations to take into account here, since it is considered poor table manners in Japan to leave part of a meal unfinished( 13 ). Tradition has it that there are seven gods in a grain of rice in Japan, so many Japanese people feel guilty leaving rice. In addition, the Japanese value mottainai, an ancient Buddhist term from Japan that means respect for surrounding resources, not wasting resources and using them with a sense of gratitude. The current study may help understand the significance of the amount of food served and its ability to control one’s meals, worldwide and particularly in Japan. While the study adds to the literature, however, additional research is needed to better understand the effects of portion size on intake and fullness among Japanese individuals.
Previous studies have reported no consistent effects of bowl size on food intake( Reference Ayaz, Akyol and Cetin 20 – Reference Robinson, Nolan and Tudur-Smith 26 ) and our results align with this previous research, while suggesting that the effect of portion size was larger than the effect of bowl size in Japanese men. In Japan, people sometimes share meals from large plates and each eats using a small plate. Previous studies suggest that serving behaviour has a direct influence on plate size( Reference Van Ittersum and Wansink 18 , Reference Wansink, van Ittersum and Painter 33 ). The interactive effects of portion size and plate size on serving behaviour also need research.
The interactions between portion size and bowl size on intake and fullness were not significant. Across the experimental meals, fullness was highest when the larger portion size was provided in the smaller rice bowl and lowest when the smaller portion size was provided in the larger rice bowl. This interaction may be borne out in future studies with larger samples sizes and/or larger differences in portion size and bowl size. In this regard, it is possible that the present study was susceptible to type II error due to the small sample size. However, this can nevertheless be considered an appropriate pilot investigation of this phenomenon; particularly the fact that participants did not notice the change in bowl size should be helpful for future researchers.
The present study has several additional limitations. First, participants ate their meals in the classroom, which was different from the contexts in which most people would generally eat their meals. In a real-world setting, many people socialize while eating and this may divert their attention from the food and portion sizes. As such, future research would do well to investigate these behaviours in more natural settings. Another limitation is that the study focused only on men and only on consumption of one specific food (rice); there may be effects of different dishes. Future research investigating these patterns in Japanese women and/or with other types of food is needed. Third, another limitation is in the size(s) of the portions and dishes used. In the present study, only a few participants refilled their bowl or left any rice. The smaller amount of rice served may not be small enough to elicit refill, while the large amount may be not large enough to need to leave some. Thus, future study should use less than 150 g and more than 250 g rice. In a related point, previous studies have used larger dishes( Reference Robinson, Sheen and Harrold 22 – Reference Shah, Schroeder and Winn 24 , Reference Peng, Adam and Hautus 27 ); it is possible that larger difference in bowl size may lead to greater effect of bowl size on intake amount.
Conclusions
The present study suggests that the portion size of rice had effects on intake and fullness ratings among Japanese men; it was the first study of the effects of portion size and bowl size on intake and fullness among Japanese men. Although the main effects of bowl size and the interactions between portion size and bowl size were not clear in the study, they may perhaps be seen with larger sample sizes and/or different populations and foods. Further research should clarify the effects of portion size, bowl size and their interaction to better understand strategies for controlling food consumption.
Acknowledgements
Financial support: This study was supported by JSPS KAKENHI (grant number JP 17H00713). JSPS KAKENHI is a public research fund and had no role in the design, analysis or writing of this article. Conflict of interest: None. Authorship: M.S. designed the study, analysed the data and wrote the initial draft of the manuscript. R.A. assisted in designing the study and critically reviewed the manuscript. Both authors contributed to data collection and interpretation, and approved the final version of the manuscript and any revised version. Ethics of human subject participation: This study was conducted according to the guidelines laid down in the Declaration of Helsinki and all procedures involving human subjects were approved by the Ethics Committee of Ochanomizu University (accepted number: 2017-9). Written informed consent was obtained from all subjects.


