


1 Introduction
This paper presents new acoustic data on the production of the word-final laryngeal contrast by speakers of Polish. Polish is one of many languages reported to eliminate final voice contrasts by means of a phonological rule of word-final obstruent devoicing. Nevertheless, in Polish and other languages, small but systematic phonetic differences have been identified between voiceless and devoiced obstruents (Dinnsen & Charles-Luce Reference Dinnsen and Charles-Luce1984, Port & O'Dell Reference Port and O'Dell1985, Slowiaczek & Dinnsen Reference Slowiaczek and Dinnsen1985); the latter are assumed to be underlyingly voiced on the basis of morphologically related forms. Differences have been observed in the following phonetic parameters: duration of the preceding vowel, duration of the stop closure, duration of noise burst/frication and duration of voicing during stop closure/frication. The phenomenon is commonly referred to as incomplete neutralisation.
Early work documenting incomplete neutralisation challenged established views on the nature of phonological rules, and sparked a heated debate about the methodological validity of the findings on the one hand (Fourakis & Iverson Reference Fourakis and Iverson1984, Jassem & Richter Reference Jassem and Richter1989) and the value of traditions in phonological theory on the other (Manaster-Ramer Reference Manaster Ramer1996, Port Reference Port1996, Port & Leary Reference Port and Leary2005). Many scholars criticised early reports of incomplete neutralisation on the basis of methodological issues such as the influence of orthography or participants’ knowledge of other languages, and their provocative interpretation of the implications of incomplete neutralisation for phonological theory. Incomplete neutralisation sceptics have, for the most part, used the methodological critiques as justification for leaving incomplete neutralisation data out of phonological analyses (see e.g. Cyran Reference Cyran2017 on Polish). Thus, with a few exceptions (Ernestus & Baayen Reference Ernestus, Baayen, Goldstein, Whalen and Best2006, Reference Ernestus, Baayen, van de Weijer and van der Torre2007, van Oostendorp Reference Oostendorp and Marc van2008), phonological theory has been slow to incorporate the empirical findings. The present study has both empirical and theoretical objectives related to these issues.
Our empirical goal is to provide new data on the question of laryngeal neutralisation in Polish, while addressing the most common objections of those who have been critical of incomplete neutralisation studies. For this reason, our experiment is modelled on a study of German by Roettger et al. (Reference Roettger, Winter, Grawunder, Kirby and Grice2014), in which obstruent-final nonce words are elicited in a word-formation task using auditory stimuli, thus mitigating the possible influence of orthography. Additionally, our study is carried out with functionally monolingual Polish speakers residing in Poland. A common critique of incomplete neutralisation studies is that they often do not control for the possible influence of other languages speakers may have knowledge of, especially English, in which the final laryngeal contrast is robustly maintained. Indeed, most of the early reports of incomplete neutralisation came from experiments carried out in North America. Such an objection cannot be raised in the case of our experiment. Finally, since the methods of our experiment on Polish are modelled on a study of German, an additional corollary of our empirical goals is a comparison of the two languages, raising questions about the place of incomplete neutralisation within the wider context of laryngeal typology. German is an ‘aspiration’ language (e.g. Iverson & Salmons Reference Iverson and Salmons1995), while Polish is a ‘voicing’ language (e.g. Keating Reference Keating1980). To our knowledge, previous work on incomplete neutralisation has not considered whether incomplete neutralisation effects may differ as a function of the laryngeal system. Empirical findings suggestive of such differences will be summarised in §2.
Our theoretical goal is to present a new and conciliatory phonological perspective on the problem of incomplete neutralisation. Up to this point, the incomplete neutralisation debate has unfortunately been quite polarised, with both theoretical arguments and empirical research aimed at supporting a position that is either ‘for’ or ‘against’ the phenomenon. As a consequence of this polarisation, a number of important issues have not been adequately addressed. In addition to the issue of laryngeal typology mentioned above, we also consider the phonetic locus of incomplete neutralisation effects (i.e. preceding vowel duration vs. obstruent-internal cues), and the likelihood of contrast as a function of speaker and item. In our study, we compare the likelihood and magnitude of incomplete neutralisation effects in both vowel duration and closure duration, and quantify by-speaker and by-item variation using a Bayesian approach. The phonological interpretation of our data will be provided within the Onset Prominence representational framework (e.g. Schwartz Reference Schwartz2013, Reference Schwartz2016, Reference Schwartz2017). Due to the relative timing of laryngeal features with respect to Onset Prominence's obstruent-internal structures, the framework makes typological predictions about cross-language differences in incomplete neutralisation effects. Since the predicted differences are compatible both with our data from Polish and with studies from other languages, we suggest that direct cross-language comparison should be a priority for future research on incomplete neutralisation.
In the early incomplete neutralisation literature there was a recurring motif in which phoneticians suggested that incomplete neutralisation called into question the foundations of phonological theory (see Port Reference Port1996, Port & Leary Reference Port and Leary2005). The response from some phonologists was defensive (e.g. Manaster-Ramer Reference Manaster Ramer1996): incomplete neutralisation was seen as a threat to theoretical phonology. The reason for this is that, according to traditional generative models, if a phonological rule produces a voiceless consonant as its output, then phonetics has no way of knowing that the consonant was underlyingly voiced. In our view, however, the idea that incomplete neutralisation should be problematic for phonological theory is paradoxical. Incomplete neutralisation data clearly suggest a phonological interpretation – a contrast between categories is maintained – so it could easily be argued that incomplete neutralisation actually reinforces the foundations of phonological theory, provided that phonological theory is able to express it. Therefore, the theoretical discussion in this paper considers just what those contrasting categories are, their origins, how they can be reconciled with findings of incomplete neutralisation and whether incomplete neutralisation is the same phenomenon in the various languages in which it has been observed.
This paper will proceed as follows. §2 provides a summary of previous phonetic studies of incomplete neutralisation, discussing methodological considerations and possible typological differences in the implementation of incomplete neutralisation effects. §3 presents the acoustic study, and §4 provides an Onset Prominence account of final laryngeal neutralisation, after a brief look at other phonological perspectives on the problem.
2 Acoustic studies of final devoicing
In the 1980s, a series of phonetic studies examined the phonetic realisation of final devoicing in a number of languages in which it is reported, including German (e.g. Port & O'Dell Reference Port and O'Dell1985), Catalan (Dinnsen & Charles-Luce Reference Dinnsen and Charles-Luce1984) and Polish (Slowiaczek & Dinnsen Reference Slowiaczek and Dinnsen1985). Each of these studies was carried out at North American phonetics laboratories, and analysed recordings of up to ten speakers reading minimal pairs embedded in carrier phrases. In all of these experiments, small differences in the measured acoustic parameters revealed effects of underlying voicing. Follow-up studies on perception revealed that the phonetic differences were audible to listeners in all of the languages reported above (Port & O'Dell Reference Port and O'Dell1985, Slowiaczek & Szymanska Reference Slowiaczek and Szymanska1989). As a result, these authors questioned the status of phonological rules of final devoicing.
Turning to the production of final obstruents in Polish, in Slowiaczek & Dinnsen's study vowels preceding voiced obstruents were approximately 10% longer than vowels before voiceless consonants. Slowiaczek & Dinnsen also observed a mean 13 ms increase in closure voicing duration in underlying voiced labial stops relative to underlying voiceless labial stops. Jassem & Richter (Reference Jassem and Richter1989) identify a number of methodological problems with Slowiaczek & Dinnsen's study. First, they note that the speakers, although born in Poland, were all living in North America and could be claimed to be sensitive to the final laryngeal contrast in English. Second, the fact that the speech was elicited from a reading task may have opened the door to effects of orthography, particularly in the case of minimal pairs that might be expected to give rise to hypercorrect pronunciation. Finally, they note that the intervocalic context of one of the carrier phrases should be expected to yield voicing in southern and western dialect areas. Indeed, Tieszen (Reference Tieszen1997) found regional differences in the realisation of final obstruents.
To address these methodological problems, Jassem & Richter (Reference Jassem and Richter1989) ran a study with four speakers from a single dialect area, performing dialogue tasks designed to elicit voiceless vs. devoiced items without orthographic interference. They observed that vowels on average were about 4 ms longer before underlying voiced consonants, and that the voiced consonants were about 4 ms shorter. Their statistical tests revealed these differences to be non-significant, and listeners in their perception test performed poorly, so they concluded that there were no grounds to reject traditional descriptions of neutralisation. Jassem & Richter's conclusion, combined with the comparable results of Fourakis & Iverson (Reference Fourakis and Iverson1984) for German, and the fact that the weakest incomplete neutralisation effects in the early studies were found in Catalan, in which the underlying voice contrast is not preserved in the orthography, were taken as evidence against incomplete neutralisation. Notably, in studies describing incomplete neutralisation, the potential confound of orthography had yet to be dealt with. Additionally, Kopkallı's (Reference Kopkallı1993) study revealed no evidence of incomplete neutralisation for stops in Turkish, another language whose spelling system reflects final devoicing. Therefore, at the end of the 20th century, the controversy surrounding incomplete neutralisation had yet to be resolved.
In the early years of the 21st century, phoneticians continued to document incomplete neutralisation effects in a number of languages. Warner et al. (Reference Warner, Jongman, Sereno and Kemps2004) recorded 15 speakers of Dutch reading word lists containing minimal pairs, and observed that, when the final consonant was underlyingly voiced, preceding vowels were on average 3.5 ms longer and bursts following phonologically long vowels 9 ms shorter. Ernestus & Baayen (Reference Ernestus, Baayen, Goldstein, Whalen and Best2006, Reference Ernestus, Baayen, van de Weijer and van der Torre2007) found additional evidence of incomplete neutralisation in Dutch. In both of these studies, one speaker's productions differed in the expected direction for obstruent-internal cues (longer bursts for underlying voiceless consonants in both studies, more closure voicing in underlying voiced consonants in the 2006 study), and listeners showed sensitivity to these effects in perception tasks. Incomplete neutralisation in Russian was studied by Dmitrieva et al. (Reference Dmitrieva, Jongman and Sereno2010), Shrager (Reference Shrager2012) and Kharlamov (Reference Kharlamov2014). These studies found that the underlying voice contrast was maintained, more robustly in the duration of release bursts and frication than in the preceding vowel. Interestingly, Kharlamov found a difference between read items and those induced by a picture-naming task. Incomplete neutralisation effects were more dramatic in the former, suggesting an effect of orthography in this language. In an attempt to offset the effects of orthography, Roettger et al. (Reference Roettger, Winter, Grawunder, Kirby and Grice2014) ran an experiment with 16 speakers of German performing a task based on auditory presentation of contrasting nonce words with intervocalic stops – the elicited singular forms contained underlying voiced and voiceless items putatively neutralised by final devoicing. In their study, vowels were estimated to be 8.6 ms longer before devoiced stops than before voiceless ones. This finding was replicated in a later study (Roettger & Baer-Henney Reference Roettger and Baer-Henney2019). Finally, returning to Polish, a study by Strycharczuk (Reference Strycharczuk2012a) of Polish word-final obstruent–sonorant clusters showed contrast maintenance in both closure voicing and closure duration, despite earlier claims that sonorants are ‘transparent’ to final devoicing. Whereas earlier phonological accounts of Polish posit that words like kadr ‘cadre (gen.pl)’ show neutralising final devoicing, Strycharczuk's study showed a contrast between words like kadr and wiatr ‘wind’.Footnote 1
Table I summarises a selection of incomplete neutralisation production studies from a number of different languages. Scholars sceptical of incomplete neutralisation may suggest that issues such as where the study was carried out and the task employed in the experiments have an impact on the assumed reliability of the results. In particular, except in Catalan and Turkish, in which final devoicing is reflected in the spelling, studies based on reading tasks may be questioned because of the possible influence of orthography. Meanwhile, studies carried out in North America may have been impacted by speakers’ immersion in an English-speaking environment. Some information is also given about the particular phonetic cues in which the incomplete neutralisation effects were observed.
A selection of acoustic studies of final devoicing.
An examination of Table I suggests potential differences across languages that may be related to laryngeal typology. Roettger et al.'s (Reference Roettger, Winter, Grawunder, Kirby and Grice2014) results from German appear to constitute the most reliable incomplete neutralisation effects across all of the languages shown here, since their experiment used a non-reading task and was carried out in Germany. Their study has also been replicated (Roettger & Baer-Henney Reference Roettger and Baer-Henney2019). For all of the other languages, questions may be raised about how findings of incomplete neutralisation may be interpreted, due to reading tasks and possible orthographic influence, a small number of speakers or possible influence of other languages such as English.
A second pattern is that in voicing languages (Dutch, Polish, Russian, Catalan, Bulgarian), incomplete neutralisation effects appear to be concentrated to a greater extent in obstruent-internal cues (closure duration, closure voicing, noise bursts) than in the duration of the preceding vowel. Warner et al. (Reference Warner, Jongman, Sereno and Kemps2004) observed incomplete neutralisation effects in vowel duration in Dutch, but the magnitude of this effect was quite small (3.5 ms). For burst duration in the context after long vowels, they observed a difference of 9 ms in the expected direction. Ernestus & Baayen's perceptual findings from Dutch were based on stimuli showing differences in closure voicing and/or burst duration, but not vowel duration. Another interesting finding is that of Dmitrieva et al. (Reference Dmitrieva, Jongman and Sereno2010), which included two groups of Russian speakers in an attempt to account for possible effects of L2 English. Monolingual speakers recorded in Russia showed incomplete neutralisation effects for closure and burst duration, while the Russian speakers with proficiency in English recorded in North America also showed an effect for vowel duration. This finding may presumably be attributable to contact with English, in which pre-fortis clipping is responsible for a robust vowel duration contrast that cues laryngeal categories word-finally (Port & Dalby Reference Port and Dalby1982).
Taken together, the results summarised in Table I suggest that laryngeal typology may play a role in the phonetic implementation of incomplete neutralisation effects. First of all, there is some indication that contrast maintenance is less reliable in voicing languages.Footnote 2 Further, it appears that the relative contribution of vowel duration and obstruent-internal cues to incomplete neutralisation effects differs as a function of laryngeal system. Vowel duration appears to play a greater role in maintaining contrast in aspiration languages. In voicing languages, effects are more likely in obstruent-internal cues. To investigate these possible patterns, our study of incomplete neutralisation in Polish was carried out with monolingual speakers in Poland, using Roettger et al.'s (Reference Roettger, Winter, Grawunder, Kirby and Grice2014) methodology, which minimises the effects of orthography, and comparing vowel duration with closure duration.
3 Acoustic study of incomplete neutralisation in Polish
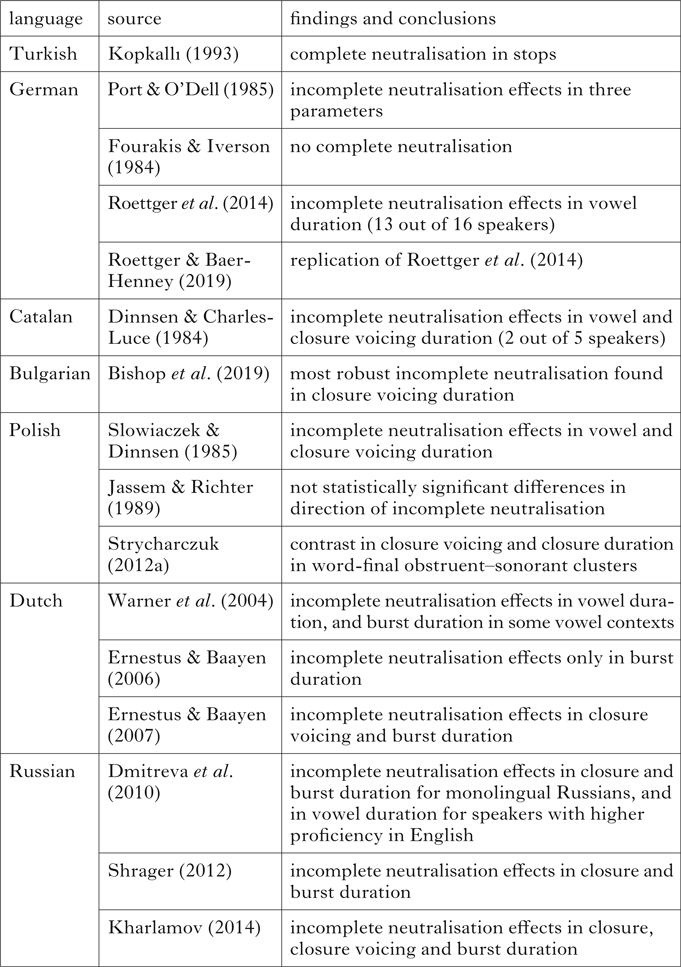
This section will describe our acoustic phonetic experiment on word-final devoicing in Polish. In our study, we take up the research questions in (1).
-
(1)

3.1 Background on the realisation of voice contrasts in Polish
Before proceeding with our study of final devoicing, it is worth providing some background on how Polish implements its laryngeal contrast in other positions. With regard to initial position, as mentioned above, Polish is classified as a voicing language, with prevoicing in its initial voiced stops, and short-lag VOT in its voiceless stops (e.g. Keating Reference Keating1980, Malisz & Żygis Reference Malisz and Żygis2015, Schwartz et al. Reference Schwartz, Wojtkowiak and Brzoza2019). The presence of prevoicing in initial voiced stops is generally quite consistent for monolingual speakers, but is somewhat less widespread in the L1 of proficient Polish speakers of English (see Schwartz Reference Schwartz2020). At the same time, there is some evidence that the short-lag VOT of voiceless stops is somewhat longer than short-lag stops in other languages (Keating Reference Keating1980, Schwartz et al. Reference Schwartz, Wojtkowiak and Brzoza2019). Schwartz et al. (Reference Schwartz, Wojtkowiak and Brzoza2019) also document effects of word-initial voicing contrasts on F0 (cf. Ohde Reference Ohde1984, Kirby & Ladd Reference Kirby and Robert Ladd2016) and F1 at vowel onset (cf. Stevens & Klatt Reference Stevens and Klatt1974).
Also relevant to the present study is the realisation of voicing contrasts in intervocalic position. A particularly controversial point has been whether Polish exhibits a ‘voicing effect’, by which vowels are longer before voiced consonants (cf. Chen Reference Chen1970) and voiced consonants themselves are shorter. In Keating's (Reference Keating1980) experiments, no such effect was observed for stops – there was significant overlap in both vowel durations and closure durations, while the contrast was implemented primarily with closure voicing. Malisz (Reference Malisz2013) reported no effect of voicing on stops for vowel duration, but she did observe one for consonant duration. At the same time, Malisz found a significant voicing effect on both vowel and consonant duration for intervocalic fricatives. Finally, Coretta (Reference Coretta2019) observed small effects for both vowel and consonant duration for Polish stops, although these effects were apparently smaller than those he observed in Italian. In sum, the available evidence suggests that Polish has rather modest voicing effects in intervocalic position compared to many other languages, particularly with regard to vowel duration. The relative contribution of underlying voicing to vowel duration as opposed to closure duration is investigated in our experiment on final devoicing in Polish.
3.2 Participants
Fifteen functionally monolingual native speakers of Polish participated in the experiment. While they reported some experience with foreign languages – mostly Russian and German – which they had studied in school, they claimed not to be proficient in any of them. We were especially careful not to include speakers with more than elementary proficiency in English, French or any language with uncontroversial final laryngeal contrasts. This is as close as we could get to ‘monolingual’ speakers of Polish, as foreign language classes in Poland are obligatory from primary school onwards. The participants were all females between the ages of 19 and 53 (mean = 30, SD = 8.42), who had lived their entire lives in Poland. Participants reported no speech or hearing impairments, and had never undergone any form of phonetic training.
3.3 Materials
The dataset used in the present study consisted of 23 pairs of nonce words obeying Polish phonotactic patterns. The words were elicited in a hypothetical singular form ending in an underlying voiced or voiceless stop. Examples of such pairs include szeb–szep /ʂɛb–ʂɛp/ and glag–glak /glag–glak/. Nouns of this phonological shape in Polish typically have plural endings in either /ɨ/ or /i/ (the latter after dorsal consonants), which for the examples above would yield szeby–szepy /ʂɛbɨ–ʂɛpɨ/ and glagi–glaki /glagi–glaki/. The plural forms from which the singular forms may be derived are given in Appendix A.Footnote 3 With 15 speakers and 23 pairs, 690 items were recorded in total. 34 tokens had to be eliminated due to hesitations, errors or technical issues with the recordings. When a token was removed, the whole pair for that speaker had to be eliminated. These reductions left a total of 622 items (311 pairs) for analysis.
The hypothetical plural forms were placed in a carrier sentence, and were recorded by a female native speaker of Polish to serve as audio stimuli. The stimuli were annotated in Praat (Boersma & Weenink Reference Boersma and Weenink2018) to obtain durational measures of the intervocalic voiced and voiceless consonants in the nonce plural forms, with the goal of plugging these measures, or, more precisely, the within-pair differences between voiced and voiceless items, into our statistical analyses as predictors.
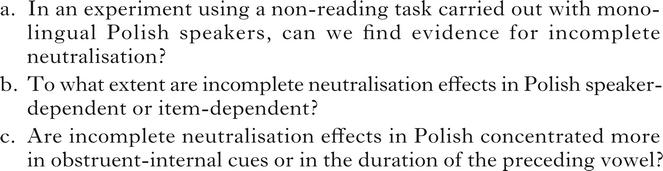
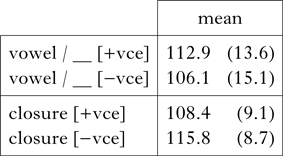
The measures for vowel duration and closure duration of all the individual stimulus items are given in Appendix A. The mean vowel and closure durations of the stimuli are shown in Table II.
Mean vowel and closure durations (ms) of plural stimuli with intervocalic stops. SDs are given in parentheses.
3.4 Procedure
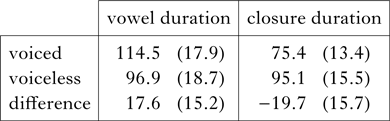
Participants heard the recording of the carrier containing the plural form of the nonce word, after which their task was to produce a different carrier phrase containing the singular form. Item elicitation proceeded as in (2).
-
(2)
Note that the target word appeared phrase-finally. This choice was motivated by the need to ensure that final devoicing would apply consistently. Phrase-medially in Polish, the initial sound of the following word frequently affects the laryngeal realisation of final obstruents.
The stimuli were presented, without fillers, using a PowerPoint presentation in a pseudo-randomised order – the same order for each participant. On average, the members of the minimal pairs were separated by an average of 7.8 slides (SD = 2.19). The degree of slide separation was skewed somewhat, since, except for the final pair (kryby–krypy), which appeared on the last two slides of the PowerPoint, all pairs were separated by a minimum of five slides. Trial number interacting with underlying voicing was included in the statistical models (as Trial_z), to account for any possible learning effects in the task. It was centred and standardised (by dividing by one standard deviation).
The recordings were carried out in a quiet room by the third author, a native speaker of Polish. The instructions were given in Polish. The stimulus recordings and carrier phrase for the participants were presented using PowerPoint. The PowerPoint slides played the stimuli while displaying the carrier phrases, with blanks in the place of the nonce words. After hearing the first carrier containing the plural nonce word, the participants read the second carrier phrase, which was displayed in a larger font size, ending with the singular form created by them on the spot. The experimenter made sure that the participants understood the instructions, which were displayed on a slide at the beginning of the presentation. Recordings were made directly onto a laptop computer, using a high-quality head-mounted AKG microphone connected to a Tascam USB audio interface.
Annotation of the recordings was done manually in Praat by the third author. Acoustic measurements were extracted using a Praat script. Vowel duration and closure duration were marked.Footnote 4 Vowels were measured from the onset of formant structure after consonant release (when no sonorant consonant preceded the vowel) up to the point at which F2 and F3 were no longer visible. Sonorants preceding the vowel (e.g. [l] in mlub) or following it (e.g. [r] in durt) were not included in vowel duration measurements. Exclusions of sonorant consonants were made on the basis of the amplitude envelope in the waveform. Closure was measured from the point at which F2 and F3 of the vowel were not visible up to the onset of the release burst of the final plosive.
In an effort to ensure consistency and reliability of the acoustic measures, the first author independently annotated five items from each speaker, a total of 75 items and 150 measurements, slightly more than 10% of the total. The mean discrepancy between the two annotators across both vowel and closure duration was 0.9 ms (SD = 7). Bayesian linear mixed-effects models were run for each of the acoustic measures in the items marked by both annotators, with an Annotator × Underlying_voicing interaction term as a predictor, and random intercepts for speaker and item. The analyses revealed only small inter-annotator differences in the probability of observing incomplete neutralisation effects (0.69 vs. 0.64 for vowel duration; 0.93 vs. 0.99 for closure duration).
3.5 Modelling
We fitted two Bayesian linear mixed-effects models to the individual acoustic measures. A Bayesian analysis offers several advantages. First, it is very well-suited to investigating by-speaker and by-item variation. It allows the calculation of probabilities of specific hypotheses directly from posterior samples, with the uncertainty around effects quantified with easily interpretable credible intervals (cf. Morey et al. Reference Morey, Hoekstra, Rouder, Lee and Wagenmakers2016). Here specifically, we can calculate the probability of the hypothesis that vowel duration is longer (in Model 1) and closure duration shorter (in Model 2) before underlyingly voiced consonants than before underlyingly voiceless consonants, both in the entire datasets and for individual speakers and item pairs. Second, it is less problematic to analyse related datasets in the Bayesian framework than it is in the frequentist framework, as the potential dangers of multiple testing are not amplified by the calculation of p-values (for this and related problems of Null Hypothesis Significance Testing, see, for example, Cumming Reference Cumming2013 and Kruschke & Liddell Reference Kruschke and Liddell2018). Finally, fitting Bayesian models allows us to construct a theoretically justified random-effect architecture, including random slopes. The inclusion of random slopes in frequentist models often results in these models not converging, as the algorithmic processes they rely on to estimate variance-covariance matrices often fail. As a result, random slopes, though theoretically justified, are often left out, which leads to models that do not generalise well (cf. Barr et al. Reference Barr, Levy, Scheepers and Tily2013). In the Bayesian framework, variance-covariance matrices can be estimated more easily by the specification of priors, and the model architecture is motivated by theoretical considerations rather than by practical limitations (Vasishth et al. Reference Vasishth, Nicenboim, Beckman, Li and Kong2018). We fitted the models using the Stan modelling language (Carpenter et al. Reference Bob, Gelman, Hoffman, Lee, Goodrich, Betancourt, Brubaker, Guo, Li and Riddell2017) and the brms package (Bürkner Reference Bürkner2017) in R (R Core Team 2020). We relate the analysis to our hypotheses by means of parameter inference (cf. Franke & Roettger Reference Franke and Roettger2019).
The first model we present had vowel duration as the response variable. Our key predictor was Voicing, indicating whether the coda consonant corresponded to a voiced or voiceless consonant in the plural form (binary categorical variable with levels ‘voiced’ and ‘voiceless’, treatment coded with ‘voiceless’ as reference). As indicated earlier, Trial_z (trial number, centred and standardised by dividing by one standard deviation) and its interaction with Voicing were included in the model. On its own, Trial_z quantifies the overall change in the produced durations as participants progress through the study. An interaction of Trial_z with Voicing would capture an increase in the degree of contrast over the course of the experiment. To account for the potential influence of the place of articulation of the coda consonant on vowel duration, we included Coda_place as a predictor (categorical predictor with three levels: ‘coronal’, ‘dorsal’ and ‘labial’). To account for the potential influence of vowel quality on vowel duration, we included Vowel_quality as a predictor (categorical predictor with four levels: ‘a’, ‘ɛ’, ‘u’ and ‘ɨ’). Both Coda_place and Vowel_quality were sum-coded, so that the intercept reflects the value of vowel duration when the influence of Coda_place and Vowel_quality are factored out.
To control for the possible influence of the acoustic properties of the stimuli, and in particular the within-pair differences between the voiced and voiceless items in the nonce plurals that elicited the participants’ productions of singular forms, we included a Stimulus_vowel_duration variable. This is a continuous variable quantifying the durational difference between the two members of each pair as produced by the speaker who recorded the stimuli, centred for each pair and standardised by dividing by one standard deviation. We treated Vowel_quality, Coda_place and Stimulus_vowel_duration as control variables, which were included in the model only to quantify the variation they induced, and are not discussed further. Since both speaker-specific and item-specific variation in vowel duration may be expected, by-speaker and by-item (i.e. by-pair) random intercepts were included. Additionally, by-speaker and by-item random slopes for the variable of key theoretical interest, i.e. Voicing, were included. This was done to quantify the variation in the extent to which underlying voicing affects vowel duration for different speakers and different item pairs respectively. The formula used to model vowel duration is presented in (3).
-
(3)
The model of closure duration was analogous to the model of vowel duration presented above, with the following two differences. First, the response variable was closure duration. Second, among the control variables, Stimulus_vowel_duration was replaced with Stimulus_closure_duration, a continuous variable quantifying the difference in closure duration between the two members of each pair, centred for each pair, and standardised by dividing by one standard deviation. The formula used to model closure duration is presented in (4).
-
(4)
We used regularising Gaussian priors (μ = 0, σ = 50) for regression coefficients (cf. Roettger & Baer-Henney Reference Roettger and Baer-Henney2019), and an LKJ(2) prior (cf. Vasishth et al. Reference Vasishth, Nicenboim, Beckman, Li and Kong2018) for correlation coefficients in interaction models (the latter has been shown to pre-empt convergence issues). We used the following brms default priors, whose means and standard deviations were estimated by the brm() function, and based on the data: (i) truncated student's t-distribution priors for the intercept (i.e. mean vowel duration before voiceless consonants for Trial_z held at 0 in Model 1 (v = 3, μ = 106, σ = 27), mean closure duration of voiceless stops for Trial_z held at 0 in Model 2 (v = 3, μ = 109, σ = 21)) and (ii) for standard deviations of random effects and standard deviation of the likelihood function: a truncated Student's t-distribution (Model 1: v = 3, μ = 0, σ = 27; Model 2 v = 3, μ = 0, σ = 21). Model fitting consisted of four chains, each with 2000 iterations, including 1000 warm-ups, giving a total of 4000 post-warm-up samples.
3.6 Results
3.6.1 Overview of results
Table III presents overall mean vowel and closure durations as a function of underlying voicing, along with standard deviations. The mean differences are in the expected direction for both acoustic measures, but are less than 10 ms (6.8 ms for vowel duration, ―7.4 ms for closure duration). Note also that the standard deviations are larger for vowel duration than closure duration.
Overall mean vowel and closure durations (ms). SDs are given in parentheses.
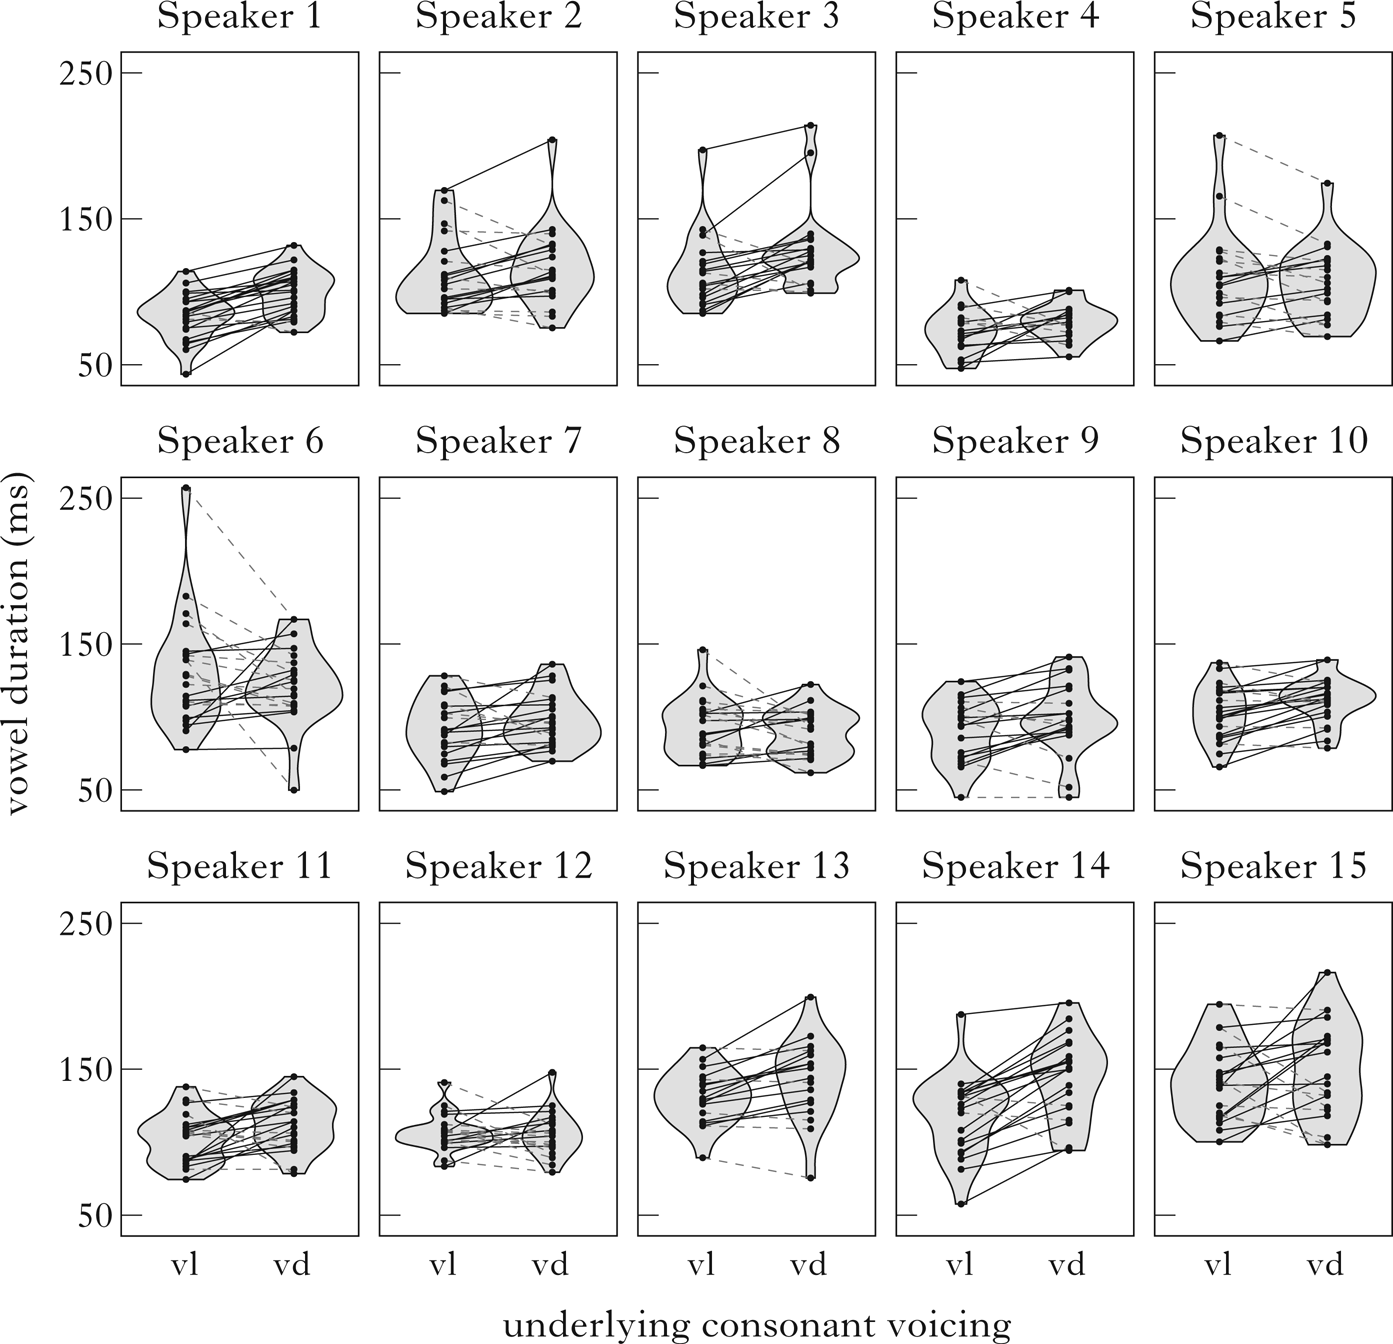
Figures 1 and 2 present violin plots of the vowel duration and closure duration results respectively. These plots are supplemented by true–false lines, which indicate whether a given pair of items for a given speaker showed a phonetic difference in the expected direction. The means for each pair (collapsed across speakers) are given in Appendix B.
Violin plots of vowel duration by speaker by underlying voicing. Each dot is one observation. Solid black lines (which go up from left to right) indicate pairs in which the vowel was longer preceding the underlying voiced consonant (true); dashed grey lines (which go down from left to right) indicate the reverse (false).
Violin plots of closure duration by speaker by underlying voicing. Each dot is one observation. Solid black lines indicate pairs in which the closure was shorter for the underlying voiced consonant (true); dashed grey lines indicate the reverse (false).
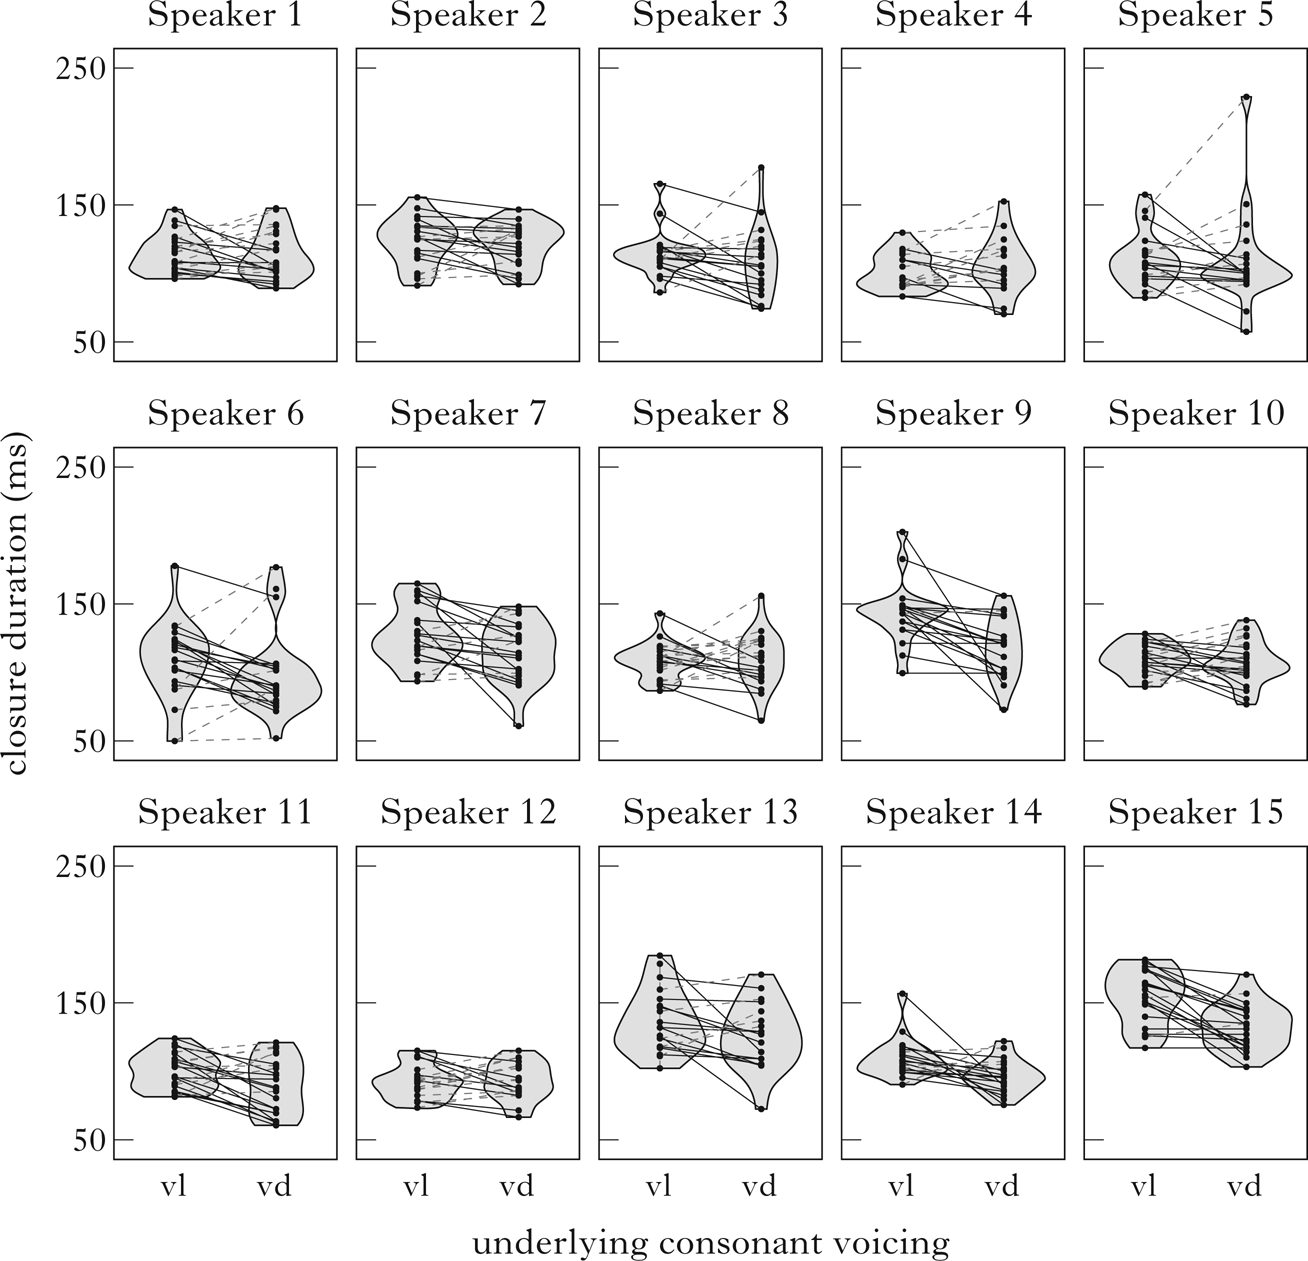
Visual inspection of Fig. 1 reveals variability in the consistency of the vowel duration contrast across speakers. Some speakers (e.g. Speakers 1 and 14) exhibit expected vowel duration differences in a large majority of pairs, as shown by the preponderance of solid true bars. For others (e.g. Speakers 5 and 6), the contrast is less consistent, and their productions show a large number of dashed false bars. Ten out of fifteen speakers produced longer vowel durations before devoiced consonants in at least 60% of the pairs.
Figure 2 displays variability in the consistency of closure duration contrast across speakers. Some speakers (e.g. Speakers 9 and 15) exhibit expected closure duration differences in a large majority of pairs, as evidenced by the large preponderance of true bars. For others (e.g. Speakers 4 and 8), the contrast is less consistent. Nine out of fifteen speakers produced longer closure durations before voiceless consonants in at least 60% of the pairs.
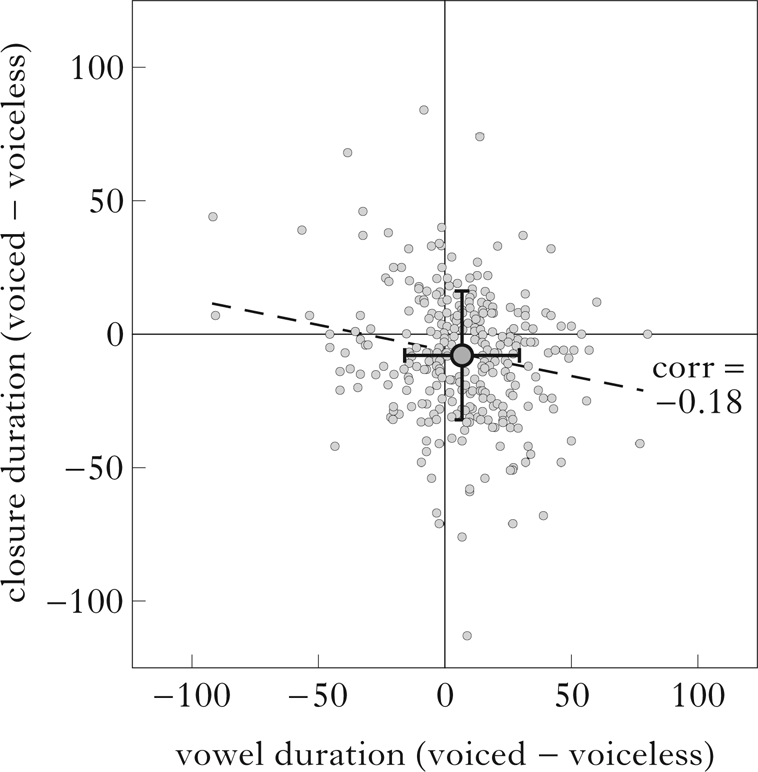
Figure 3 presents a scatter plot of within-pair (devoiced–voiceless) differences in a two-dimensional space representing vowel duration on the x-axis and closure duration on the y-axis. In this space, the lower right quadrant contains ‘double true’ items, those with phonetic differences in the expected duration for both of the analysed acoustic measures. The mean of the entire space is located in the lower right quadrant, although the standard deviations also include some ‘double false’ items. Overall, 127 pairs are located in the lower right quadrant, 41.5% of the total. The figure also shows a slight negative correlation between the two acoustic measures. The negative correlation suggests that if a speaker makes a larger closure duration difference, then the magnitude of the vowel duration difference tends to be somewhat smaller.Footnote 5
Within-pair differences (ms) in vowel duration (x-axis) and closure duration (y-axis). Each grey dot is one pair. The larger circle indicates the mean; its error bars indicate one standard deviation.
3.6.2 Results of the linear models
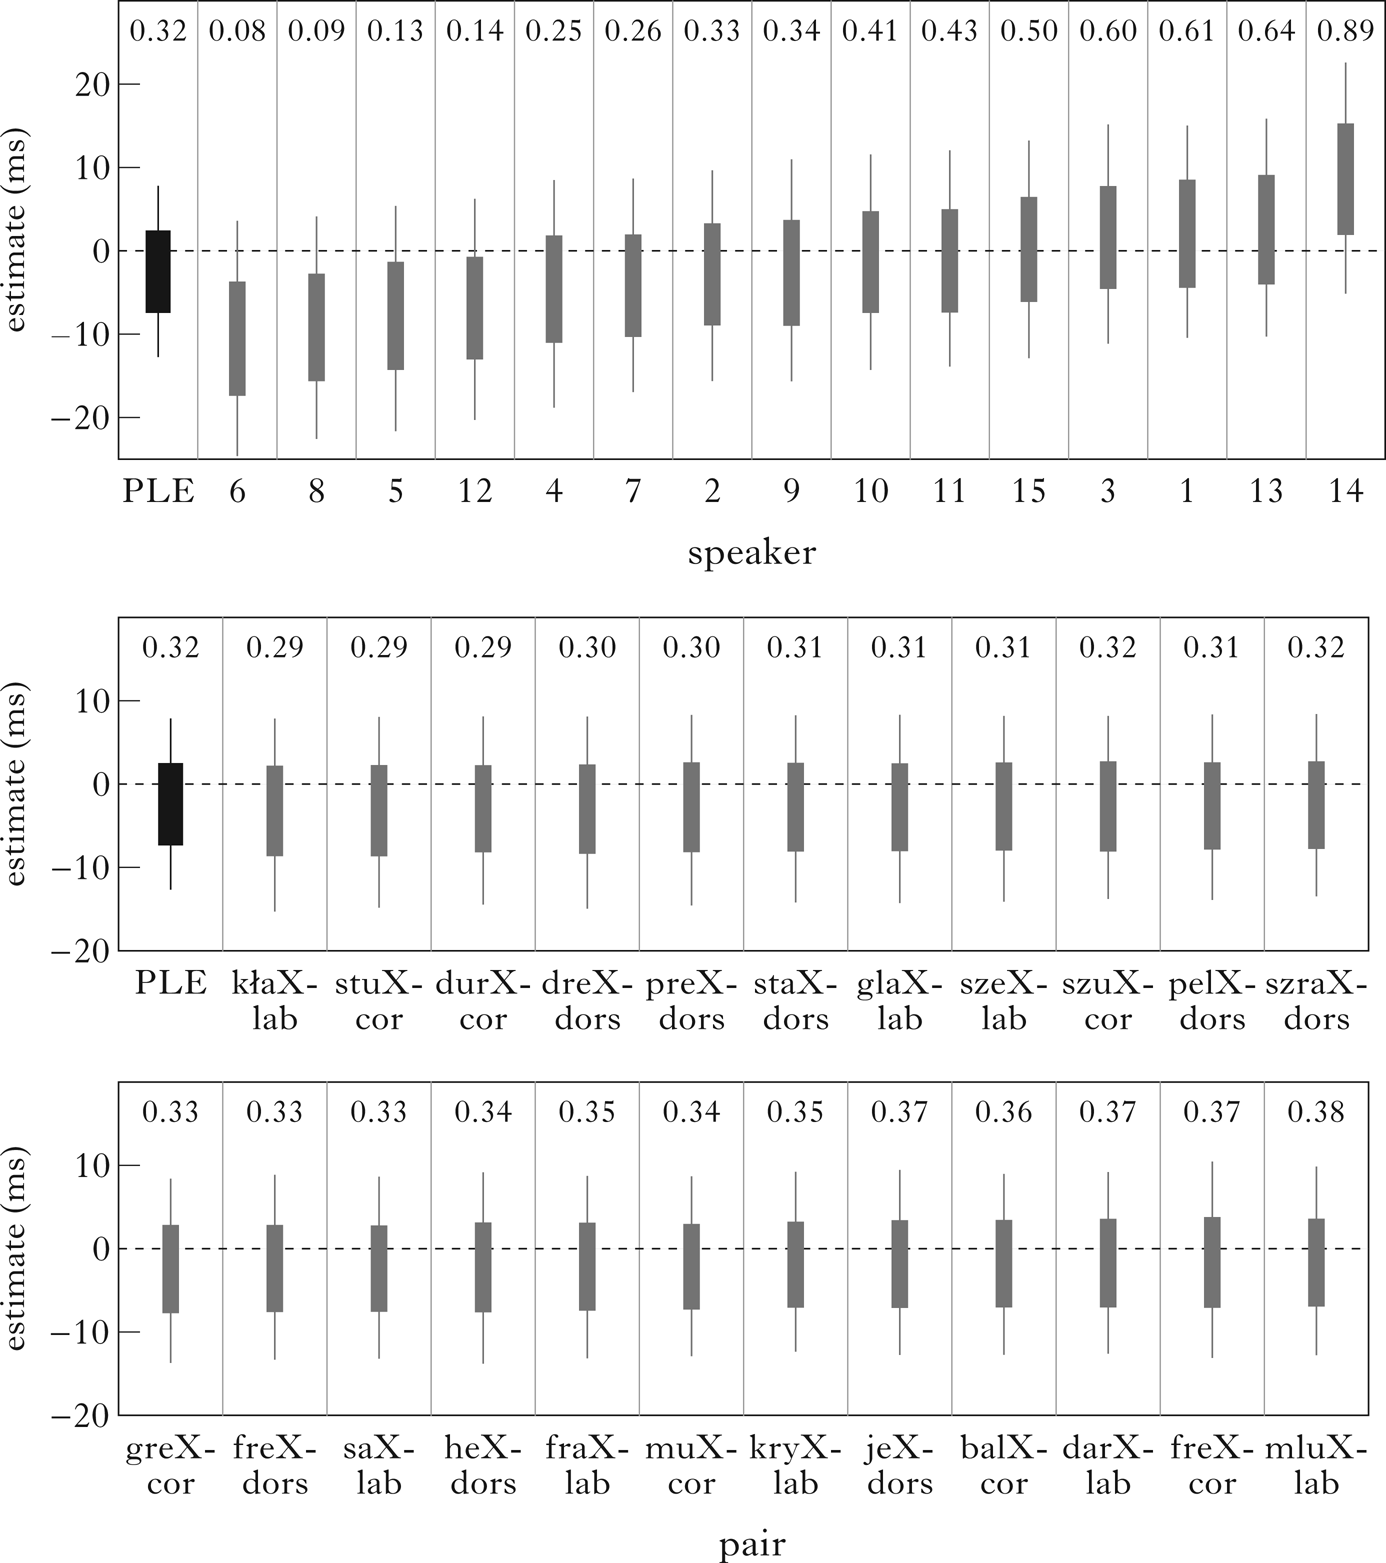
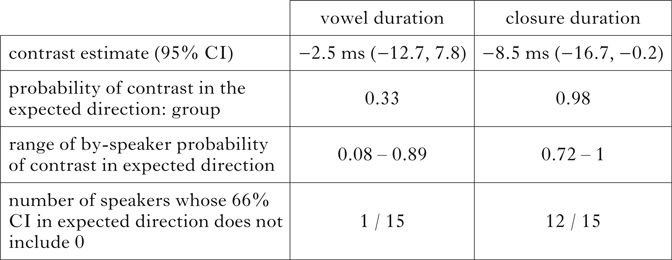
Following the convention of Roettger & Baer-Henney (Reference Roettger and Baer-Henney2019: 10), we take evidence for a voicing effect to be compelling if the 95% credible interval of the difference between voiced and voiceless productions E(μvd ― μvl) does not ‘by a reasonably clear margin’ (Roettger & Baer-Henney Reference Roettger and Baer-Henney2019: 10) include 0, and if the probability that the difference between voiced and voiceless productions is greater than zero P(δ > 0) is close to 1. For Trial_z held at 0, that is halfway through the experiment, vowels before voiced consonants were, unexpectedly, predicted to be somewhat shorter (E(μvd) = 111, 95% CI = (98, 119)) than before voiceless consonants (E(μvl) = 113, 95% CI = (101, 121)).Footnote 6 The evidence for any effect of voicing, however, is not compelling: it is estimated at ―2.5ms (E(μvd ― μvl) = ―2.5, CI = (―13, 8)), and the credible interval includes 0. The probability, given the model, the priors and the data, that the true difference is smaller than zero is P(δ < 0) = 0.68 (and so the probability that the difference goes in the expected direction is 0.32).
Figure 4 shows by-speaker and by-pair estimates of the model. As is evident in the figure, there is variation across both speakers and pairs with respect to the influence of underlying voicing on vowel duration. However, the variation appears to be more dramatic with respect to speaker over pair. Speaker-based probabilities of contrast in the expected direction ranged from 0.08 to 0.89, with no speakers showing a probability of contrast of 0.95 or higher, and only one speaker with a 66% CI that was entirely above 0. Variation across pairs ranged from 0.29 to 0.38 probability of contrast in the expected direction.
By-speaker (top) and by-pair (bottom) estimates (posteriors of random-effect levels) of differences in vowel duration between underlyingly voiced and voiceless consonants. Boxes show 66% credible intervals, while whiskers denote 95% credible intervals. Labels show probabilities, given our model, priors and the data, that the actual differences are greater than 0. The leftmost line in each plot, labelled ‘PLE’, is the population-level estimate (for Trial_z held at 0). In the by-pair labels, X represents the pair of underlying values for voicing in the final stops.
We also fitted a model to closure duration, with a fixed- and random-effect architecture that was nearly identical to that of the model of vowel duration described above. The only difference between the closure duration and vowel duration models lies in the variable quantifying the influence of the acoustics of the stimuli: instead of Stimulus_vowel_duration, this model included Stimulus_closure_duration, calculated analogously to Stimulus_vowel_duration.
Overall, for Trial_z held at 0, closure duration in voiced consonants was shorter (E(μvd) = 108, CI = (100, 116)) than in voiceless consonants (E(μvl) = 117, CI = (105, 129)). Although the evidence for the effect of voicing on closure duration is stronger than for the effect of voicing on vowel duration, the evidence for the former is not compelling by the criteria we specified: the difference is estimated at 8.5ms (E(μvd ― μvl) = ―16.7, CI = (―16.7, ―0.2)). While the 95% credible interval does not include 0, a value of 0.2 ms does not constitute a ‘reasonably clear margin’. At the same time, the probability that the true difference is less than zero, given our model, priors and the data, is P(δ > 0) = 0.98. This finding may be interpreted as evidence that the underlying voicing contrast in Polish is preserved in final position, and realised in the phonetic parameter of closure duration.
Figure 5 shows by-speaker and by-pair estimates of the model. Speaker-based probabilities of contrast in the expected direction ranged from 0.72 to 1, with five speakers showing a probability above 0.95, and twelve speakers whose 66% CI was entirely below 0. Variation across pairs ranged from 0.82 to 0.98 probability of contrast in the expected direction.Footnote 7
By-speaker (top) and by-pair (bottom) estimates (posteriors of random-effect levels) of differences in closure duration between underlyingly voiced and voiceless consonants. Boxes show 66% credible intervals, while whiskers denote 95% credible intervals. Labels show probabilities, given our model, priors and the data that the actual differences are less than 0. The leftmost line in each plot, labelled ‘PLE’, is the population-level estimate (for Trial_z held at 0).
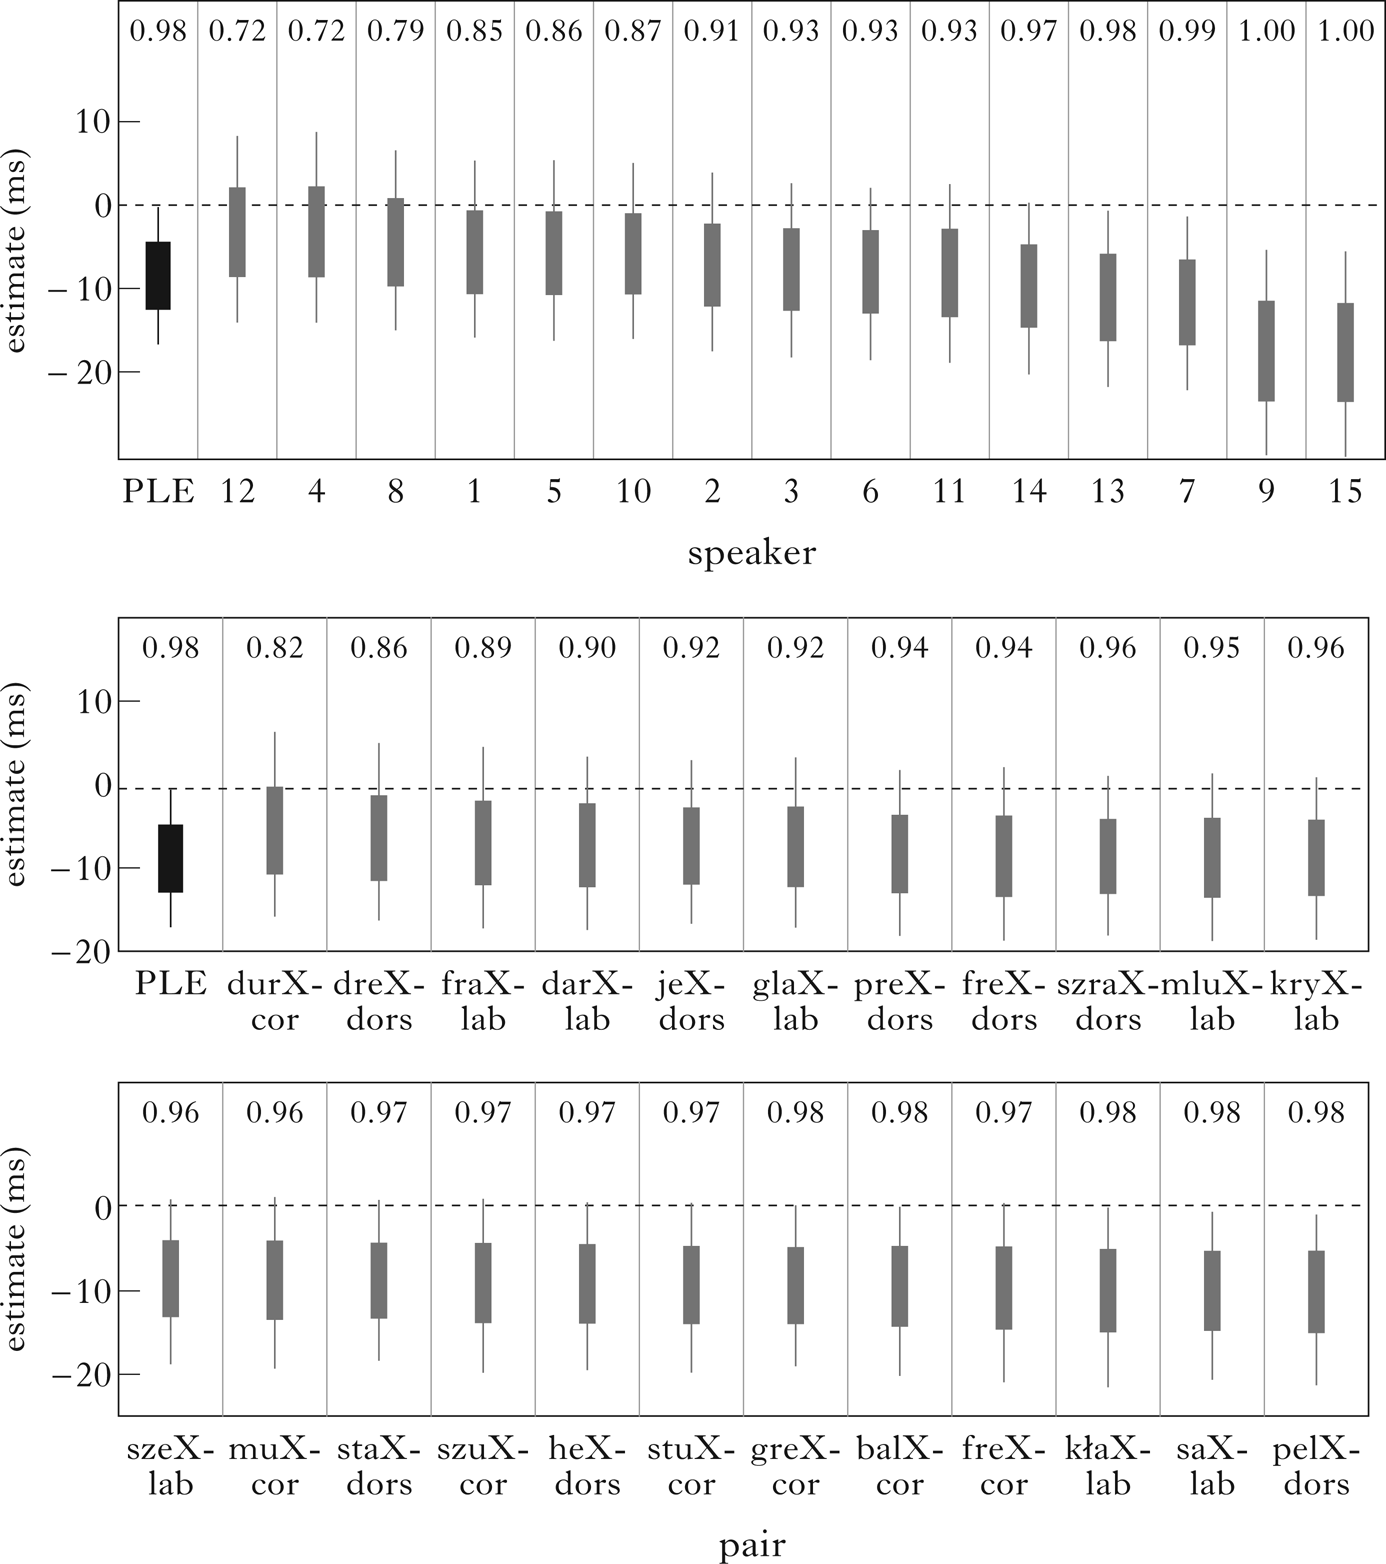
Table IV summarises the results of the linear models. It is clear that there is evidence for incomplete neutralisation in Polish, realised in terms of closure duration but not vowel duration.
Summary of linear models including by-speaker variation.
3.7 Discussion
Our experiment on incomplete neutralisation in Polish was modelled on Roettger et al.'s (Reference Roettger, Winter, Grawunder, Kirby and Grice2014) study on incomplete neutralisation in German, and our discussion will start by considering our experiment against the background of their work.Footnote 8 On the whole, our results are compatible with those of Roettger et al. There is evidence for incomplete neutralisation in Polish, as there is in German, even when the confounding factor of orthography is mitigated using a word-formation task rather than a reading task. Nevertheless, some differences may be identified. With regard to vowel duration, there was an effect in German (8.6 ms, as reported by Roettger et al. Reference Roettger, Winter, Grawunder, Kirby and Grice2014), but not in Polish (estimate is negative, as shown in Table IV). As far as individual variation is concerned, the expected effect of underlying voicing on vowel duration was also quite consistent in German (contrast for 14 of 16 speakers reported by Roettger et al. Reference Roettger, Winter, Grawunder, Kirby and Grice2014), but in Polish only one of 15 speakers showed an effect (66% CI completely above zero) in the expected direction. Roettger et al. (Reference Roettger, Winter, Grawunder, Kirby and Grice2014) do not report on closure duration in German. In Polish, our model estimates underlyingly voiceless closures to be 8.5 ms longer than underlyingly voiced closures, with a population-level probability of contrast of 0.98. As far as individual results are concerned, twelve of our 15 speakers showed an effect (66% CI completely below zero) for closure duration.
The fundamental picture that emerges from our results is that final neutralisation in Polish is optional, showing a good deal of variability across speakers, as well is in the magnitude of contrast. The degree of interspeaker variation is visible in the violin plots in Figs 1 and 2, with a large number of both true and false lines across a majority of speakers. This is also apparent in the results of the linear models summarised in Figs 4 and 5, with the likelihood of contrast in the expected direction as a function of speaker ranging from 0.08 to 1. Finally, the count of double true items from Fig. 3 revealed that 41.5% of the devoiced–voiceless pairs showed the expected phonetic differences simultaneously in both of the analysed acoustic parameters.
We also found that variability was greater across speakers than across items. This result has implications for approaches in which morphological analogy and frequency effects play a role in explaining incomplete neutralisation effects. In their studies on incomplete neutralisation effects in Dutch, Ernestus & Baayen (Reference Ernestus, Baayen, Goldstein, Whalen and Best2006, Reference Ernestus, Baayen, van de Weijer and van der Torre2007) observed that item-based differences in the degree of contrast vs. neutralisation were dependent on the amount of analogical support in a paradigm. Considering the relatively uniform nature of the item-based variation that we found, our results appear at first glance to be incompatible with an analogical account, which would presumably predict more dramatic by-item variability.
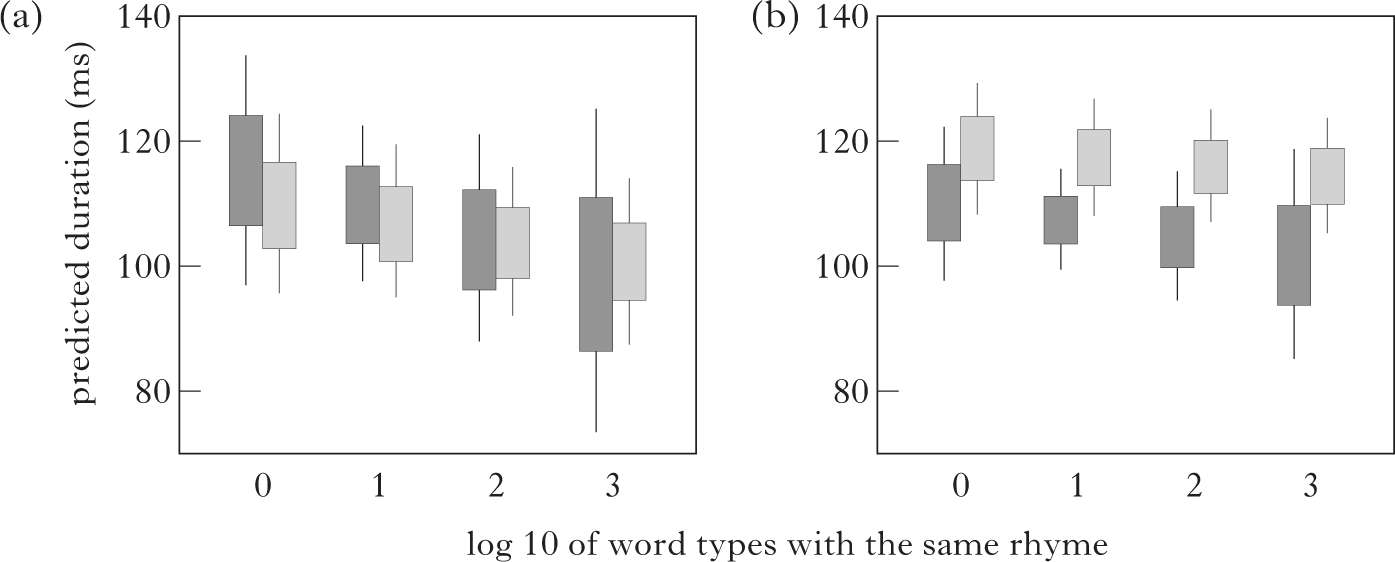
Since our study involved nonce words, we could not of course directly check the level of available analogical support for the paradigm. To examine the possibility of analogical effects, we investigated the frequency of the Polish rhymes that matched the phonological shape of the experimental items, and ran additional analyses. The frequency measure was based on the Log10 transformed number of word-forms for each rhyme in the SUBTLEX-PL database (Mandera et al. Reference Mandera, Keuleers, Wodnecka and Brysbaert2015); it was included as a continuous predictor Log_rhyme_count (range = (0, 3.29), mean = 1.57, SD = 0.75) with a regularising Gaussian prior (μ = 0, σ = 50). To quantify the degree to which analogical support might enhance the voicing contrast, an interaction term of Log_rhyme_count with Voicing was also included.
Figures 6a and b reveal the effects of rhymal frequency on the degree of voicing contrast for vowel duration and closure duration respectively. The paired bars represent selected representative values of the log frequency measure. Visual inspection of the figures reveals that rhymal frequency contribute to the degree of contrast for closure duration, but not vowel duration. This asymmetry suggests that analogy cannot be the only source of incomplete neutralisation, since a purely analogical approach would seemingly predict parallel effects across both acoustic parameters, especially given Coretta's (Reference Coretta2019) finding of voicing-induced differences for both vowel and consonant duration in intervocalic position, and the fact that our intervocalic stimuli showed differences in both measures (see Table II). Therefore, in addition to analogy, we suggest that an explanation for our results must lie somewhere within the realm of phonological representations.
Estimated closure duration as a function of an interaction between number of word types with a given rhyme (base 10 logarithm, selected values of 0, 1, 2 and 3 plotted) and underlying voicing of the final obstruent. Boxes denote 66% credible intervals, while whiskers show 95% credible intervals.
4 Incomplete neutralisation and its phonological interpretation
The empirical picture that has emerged from our study (§3), as well as from other production studies in the incomplete neutralisation literature (§2), suggests the following generalisations. First, in voicing languages such as Polish, contrast appears to be optional and less reliable than it is in German. Second, in voicing languages, the relative contribution of obstruent-internal cues to preceding vowel duration to incomplete neutralisation effects is greater than in it is in German. Although further research is necessary to confirm the empirical validity of these generalisations, we feel there is sufficient evidence to consider what they might mean for phonological theory. In what follows, we compare phonological perspectives on incomplete neutralisation, opting for an approach in which subsegmental structure can be linked to laryngeal typology to explain implementational differences in incomplete neutralisation effects.
4.1 Rule-based generative phonology
In the tradition of generative phonology (e.g. Chomsky & Halle Reference Chomsky and Halle1968), final devoicing is a phonological rule that results in the complete neutralisation of laryngeal contrasts. A textbook formulation of this rule using binary feature specifications is given in (5).
-
(5)
In the representational systems employed in generative phonology, two strategies for representing obstruents in two-series systems are popular, binary [+voice] vs. [―voice] or privative [voice]/[spread glottis] vs. ∅ (see e.g. Beckman et al. Reference Beckman, Jessen and Ringen2013). Rules of final devoicing, regardless of the system adopted (binary vs. privative), are assumed to change one category to the other, and generative tradition would demand that final devoiced obstruents be transcribed with the same symbols as voiceless obstruents. Such transcriptions are still the norm in phonological descriptions, and in Catalan final devoicing is even reflected in the orthography.
In early studies discussing the incomplete neutralisation results within the rule-based generative tradition, rules of ‘phonetic implementation’ were considered as a possible solution. For example, Slowiaczek & Dinnsen (Reference Slowiaczek and Dinnsen1985) discuss the implications of a rule that they formulate, given here as (6), which is posited to explain one of their speaker's results for closure duration when the final obstruent precedes a word-initial vowel.
-
(6)
The rule in (6) effectively states that shortening of closure duration before initial vowels (as opposed to initial consonants which were also included in their data) is greater when the consonant is underlyingly voiced. Crucially, it is noted that such a rule must precede a phonological (or lexical) rule of final devoicing of the type given in (5). This ordering, as pointed out by Slowiaczek & Dinnsen, goes against the assumption of Lexical Phonology that phonetic implementation rules are postlexical (Kiparsky Reference Kiparsky1982). Another issue that these authors raise is that incorporating incomplete neutralisation into rule-based approaches would apparently require two final devoicing rules, one lexical to account for alternations, and one postlexical. In sum, the authors of early incomplete neutralisation studies attempted to analyse incomplete neutralisation using the frameworks that were popular at the time, but concluded that the exercise was misguided.
Beyond the questions of rule duplication and ordering, a traditional generative approach based on phonetic implementation would apparently require stipulations to explain incomplete neutralisation differences as a function of laryngeal typology, with regard to the reliability of contrast, as well as to cue-based implementational differences in incomplete neutralisation effects.
4.2 An Optimality Theory approach
Noting that incomplete neutralisation-based critiques of generative phonology argue against a simplistic and outdated phonological approach, van Oostendorp (Reference Oostendorp and Marc van2008) employs more recently developed phonological machinery to explain incomplete neutralisation. The key to van Oostendorp's approach is a hypothesised two-way relationship between phonological inputs and phonetic outputs. Stated briefly, underlying representations in the input project features that may or may not be pronounced in the output. An obstruent in which the feature [voice] is projected but not pronounced is thus phonologically distinct from both voiced and voiceless obstruents, and may be phonetically distinct as well. In this way, van Oostendorp posits a three-way contrast between voiced, voiceless and devoiced. The realisation of final obstruents depends on the relative ranking of a Reciprocity constraint that demands faithful input–output relations and a FinalDevoicing constraint against pronounced [voice] in final position. The ranking FinalDevoicing ⪢ Reciprocity generates incompletely devoiced obstruents in final devoicing languages. The opposite ranking is posited for languages which have uncontroversial word-final laryngeal contrast, but may show phonetic devoicing.
One issue that van Oostendorp's paper does not address directly is how complete neutralisation could be accounted for. Considering the apparent optional nature of final contrast in Polish that we observed in our study, this should be a desirable goal. Van Oostendorp, however, accounts only for ‘incomplete devoicing’. To explain complete neutralisation, van Oostendorp's approach would presumably require an additional constraint against projected [voice], which would be satisfied when final devoicing results in complete neutralisation. Alternatively, he might simply stipulate that the language-specific phonetic component determines whether devoicing is neutralising or not. These strategies, however, provoke the same objection as rule-based approaches: they would require an undesirable duplication of the same basic constraint against final voiced obstruents. In addition, van Oostendorp's approach appears to make no predictions about either incomplete neutralisation as a function of laryngeal typology or cue-based implementational differences in incomplete neutralisation effects.
4.3 Incomplete neutralisation by analogy
A non-generative approach to explaining incomplete neutralisation effects is offered by Ernestus & Baayen (Reference Ernestus, Baayen, Goldstein, Whalen and Best2006, Reference Ernestus, Baayen, van de Weijer and van der Torre2007) in papers describing incomplete neutralisation effects in the results of perception tasks in Dutch. These authors attribute incomplete neutralisation effects to intra-paradigmatic relations in the mental lexicon. The essence of their approach is the claim that the mental lexicon does not contain underlying phonological forms, but rather includes all morphologically related forms of a given word. In the case of alternating obstruents, knowledge of a word's paradigm helps the speaker interpret its voicing. In this approach, final laryngeal contrast is the result of analogy with non-final cases in which the phonetic distinction is more robust. Ernestus & Baayen (Reference Ernestus, Baayen, Goldstein, Whalen and Best2006) explain this by discussing the example of the Dutch words verwijd [vɛrʋɛit] ‘widen’ and verwijt [vɛrʋɛit] ‘reproach’. The claim is that in producing verwijd, speakers also activate words from the same paradigm with an uncontroversially voiced /d/ (e.g. verwijden [vɛrʋɛidən]). This leads to a more /d/-like realisation of the final stop.
An important contribution of Ernestus & Baayen's work is that it explains how non-phonological factors inherent in analogy can affect phonetic implementation. Such effects are well-documented in the experimental literature. What is less clear in this approach is whether and how complete neutralisation is possible. Since presumably speakers are always aware of morphological paradigms, they should not produce the ‘wrong’ final consonant, so the analogical approach appears to predict that contrast should be consistently maintained.
4.4 Optional neutralisation in the Onset Prominence model
A third approach to putatively neutralised voice contrasts in Polish is proposed by Schwartz & Arndt (Reference Schwartz and Arndt2018) within the Onset Prominence representational framework (for thorough introductions to Onset Prominence, see Schwartz Reference Schwartz2013, Reference Schwartz2016, Reference Schwartz2017).Footnote 9 The key postulate of the Onset Prominence model is that obstruents are prosodic entities that encode manner of articulation (cf. Steriade Reference Steriade, Huffman and Krakow1993), providing docking points for featural specifications denoting place of articulation and laryngeal properties. This is visualised as a hierarchical tree structure whose nodes are abstracted away from phonetic events inherent in the production of a stop–vowel CV sequence, the most common ‘syllable’ type across languages. The prevocalic ‘onset’ position is thus taken as the source of the default or ‘unmarked’ realisation of a consonant – a fact that is reflected in the name of the framework.
In (7a), we see the Onset Prominence representational hierarchy, and in (b) manner categories of ‘segmental’ structures deriving from it. The top level of the hierarchy is Closure (C), derived from the closed phase of stops (and nasals). Below Closure is aperiodic Noise (N), associated with release bursts, aspiration and frication. One level down from the Noise node, the Vocalic Onset (VO) node derives from the CV transition, the initial portion of postconsonantal vowels that typically contains acoustic cues to the consonant's identity. The Vocalic Target (VT) lies at the bottom of the structure.
-
(7)
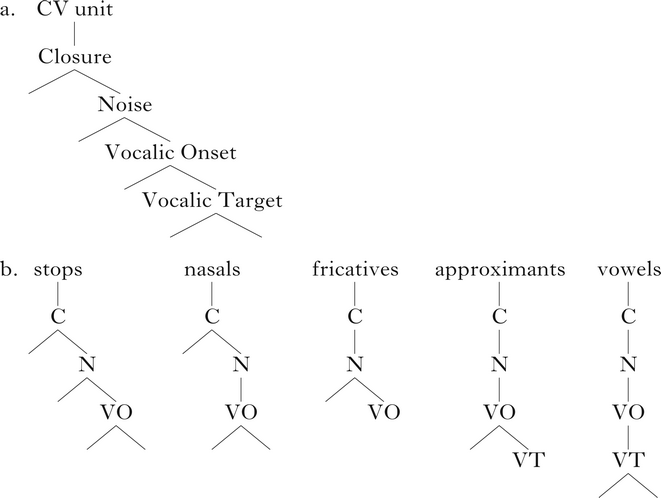
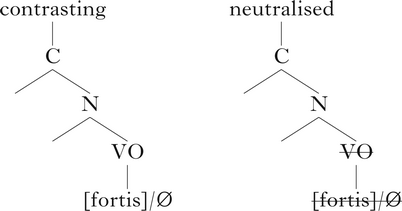
The crucial aspect of the structures in (7) is that ‘segmental’ representations are extracted directly from the CV unit, so segments and prosodic constituents are comprised of the same representational materials. Under this view, ‘onset’ position is built directly into the default representation of consonants, encoded as structural nodes that are higher than those of vowels that follow. Crucial for Onset Prominence is the status of the VO node.Footnote 10 Since it is VO that defines the ‘onset’ status of an obstruent, an important consideration is what becomes of VO when the obstruent is not followed by a vowel. We will return to this issue below.
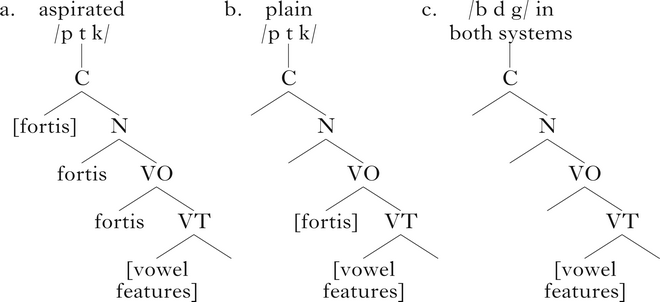
Before considering the fate of laryngeal contrast in final position, we must first consider the Onset Prominence perspective on laryngeal typology in two-series systems (Schwartz Reference Schwartz2017, Reference Schwartz2020). Two-series systems have been a subject of long-standing debate for phonological theory between those in favour of binary [voice] specifications (Keating Reference Keating1980, Wetzels & Mascaró Reference Wetzels and Mascaró2001, Bennett & Rose Reference Bennett and Rose2017), for whom both voicing and voicelessness may be targeted by phonological processes, and laryngeal ‘realists’ (e.g. Lombardi Reference Lombardi1991, Honeybone Reference Honeybone, van Oostendorp and van de Weijer2005, Beckman et al. Reference Beckman, Jessen and Ringen2013), who treat short-lag stops as phonologically unspecified, while positing privative [voice] in voicing languages and [spread glottis] in aspiration languages. This debate pits the merits of capturing the VOT typology, which is the raison d’être of laryngeal realism, against evidence of phonologically active voicelessness in voicing languages.
The Onset Prominence approach attempts to reconcile this debate, incorporating phonologically active voicelessness in voicing languages, while also encoding the VOT distinction between short-lag and aspirated stops. (8) provides Onset Prominence representations of stop–vowel sequences in voicing and aspiration languages. In aspiration languages, a privative [fortis] specification is assigned at the Closure level and ‘trickles’ down the structure, as in (a) (Schwartz Reference Schwartz2016: 45). Its presence at the Noise level is responsible for aspiration. The trickling mechanism reflects phonetic causality between articulation and acoustics; a privative [fortis] feature timed with stop closure has acoustic effects on the following noise and CV transition. In voicing languages, the [fortis] specification is attached to the VO node, leaving the Noise node unspecified and yielding plain voiceless stops (b). For voiced stops, the representation in (c) is the same in the two systems – there is no laryngeal specification. Note that in representations such as (8), feature specifications are enclosed within square brackets only at the highest level at which they appear in the tree, i.e. the level at which they are assigned (see Schwartz (Reference Schwartz2016: 44–45). For discussion about the use of [fortis] instead of [voice], as well as evidence in favour of this postulate, see Schwartz (Reference Schwartz2017, Reference Schwartz2020).
-
(8)
While the origins of Onset Prominence consonant representations are based on ‘onset’ position, for the purposes of our study we must examine what happens to these structures in final position. In short, there is a mismatch between the basic or ‘unmarked’ version of the Onset Prominence hierarchy, which is based on a CV sequence, and final positions in which no vowel follows the consonant. This is seen in (9), which shows final stops in voicing languages such as Polish. Mismatches between the signal and default representations are captured in the Onset Prominence model as unary nodes (Schwartz Reference Schwartz2016: 43), which may be subject to listener-induced adjustments (cf. Ohala Reference Ohala, Masek, Hendrick and Miller1981) to the structural representation. Thus, for a final stop, speakers may optionally reconstruct the VO node, or eliminate it. This is shown in (9). When the node is eliminated, the result is neutralisation. When it is preserved, contrast is maintained, but the phonetic magnitude of the contrast is typically small, since the contrasting specifications are housed on a unary rather than a binary node (Schwartz Reference Schwartz2016: 43).Footnote 11
-
(9)
In examining the representations in (9), it is reasonable to ask about the possible factors that may govern the choice of variant. For a more familiar analogous situation, one might consider an optional allophonic process such as the suppression of final stop release in English. We may assume that both released and unreleased variants are available in English speakers’ phonological inventories – one is a default variant that may be produced in all positions, while the distribution of the other is restricted. A similar principle may be assumed to govern the choice between final stops specified for VO and those lacking the VO node. The structure with VO is a base that may be produced in any position, while the structure without VO is an ‘allophone’ that is limited to final position. Another point about the representations in (9) is that they do not imply any tripartite predictions, since morphological or lexical considerations may be assumed to rule out the ‘wrong’ laryngeal specification when the VO-specified structure is produced. Rather, speakers are faced with a binary choice between structures that express contrast and structures that do not. Likewise, laryngeal specification in English does not induce a tripartite choice among unreleased, voiced and voiceless stops.
Finally, it is worth noting that the ambiguity inherent in the representations in (9) is predictive of the variation across speakers that was observed in our results. Rather than starting with a single representation to which a rule of final devoicing applies, Onset Prominence postulates that speakers of Polish choose between two representations for final obstruents, one that expresses contrast and one that does not. Assuming that two representations should give rise to more variability than one, the representations may be claimed to contribute to variation, along with other factors included in our study, such as vowel quality, consonant place and rhymal frequency effects. In support of this suggestion, we may note that Onset Prominence would predict more variability in final position, where speakers have a choice of representations with or without VO, than in prevocalic positions, where VO is always present. This prediction is compatible with empirical findings from initial position discussed in §3.1, which show that very little variation has been observed with regard to whether prevoicing appears in Polish voiced stops.
4.4.1 Laryngeal typology and incomplete neutralisation effects
Returning to the Onset Prominence comparison of voicing and aspiration systems shown in (8), we arrive at typological predictions with regard to the fate of final obstruents. This is shown in (10), which compares final stops in Polish as opposed to German. In (a) we see contrasting (with VO) vs. neutralised (without VO) structures in Polish, and in (b) German final stops with or without the VO node. The levels in the Onset Prominence hierarchy
-
(10)
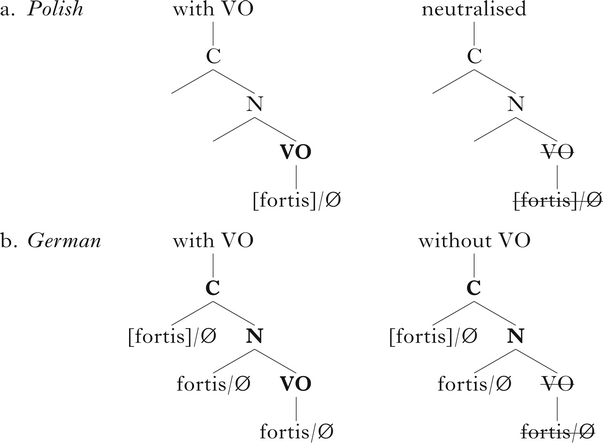
at which laryngeal contrast is represented are in bold. Note that contrast is posited in both of the German trees, but only one of the Polish trees.
The representations in (10) suggest that the consequences of final devoicing are ontologically different in voicing and aspiration languages. Crucially, the effects of eliminating the VO node on the ability to express contrast in the two languages are different. In German and other aspiration languages, regardless of whether VO is preserved, contrast is maintained at the Closure and Noise levels. In Polish, as discussed above, when VO is eliminated there is neutralisation. Note that in neither system does Onset Prominence posit a phonological rule of final devoicing. Rather, the phonological adjustment is whether VO is eliminated or not – devoicing is simply a phonetic by-product of final position. In other words, the familiar aerodynamic voicing constraint is a phonetic force that is not encoded in the phonology of either Polish or German (cf. Ohala Reference Ohala, Lee and Zee2011).
More generally, the typological difference outlined in (10) makes predictions for cross-language study of incomplete neutralisation that we feel warrant further experimental attention. The first prediction is that final laryngeal contrast in aspiration languages is posited to be the default, and final devoicing should not be expected to be neutralising. In German, as shown in (10), neutralisation would only be possible through the addition of a [fortis] feature on underlying voiced stops (Auslautverhärtung) or the removal of the [fortis] feature from underlying voiceless stops. Neutralisation in German would therefore require a more dramatic representational change than neutralisation in Polish, a phonological ‘rule’ either adding or removing a feature specification, while contrast is an ‘unmarked’ case that does not involve any representational shift. In Polish, neutralisation is the result of an optional ‘allophone’ lacking VO, while incomplete neutralisation results from production of the default form. Thus (10) would lead us to expect that German should have more robust incomplete neutralisation effects, i.e. show a more reliable contrast, than voicing languages such as Polish. This prediction is consistent with the findings of our study, as well as the larger empirical picture that may be gleaned from Table I.
In this connection, a more far-reaching typological prediction falls out from (10): phonological claims of final laryngeal neutralisation in two-series systems should be rare in aspiration languages.Footnote 12 Indeed, most of the languages reported to neutralise final voice contrasts are those whose initial contrast is based on voicing. We are aware of only two languages with aspiration that have been claimed to have neutralising final devoicing. One of these is German, discussed above, while the other is Turkish. Although Turkish has been described as having aspirated initial voiceless stops, it differs from German in that its voiced stops are typically produced with prevoicing. At the same time, VOT values of Turkish initial voiceless stops are lower than those described for German and English (Kallestinova Reference Kallestinova2004, Öğüt et al. Reference Öğüt, Kiliç, Engin and Midilli2006). Thus its laryngeal system is clearly different from that of German. Notably, Kopkallı (Reference Kopkallı1993) reports that neutralisation of stops in the language is phonetically complete, a finding consistent with the Onset Prominence predictions for voicing languages.Footnote 13 Examining this prediction for a wider selection of languages, we consulted Blevins (Reference Blevins2004), who provides a typological investigation of final laryngeal neutralisation. For two-series systems, this investigation mentions only a couple of dialects of Mongolian as aspiration languages with final neutralisation. However, for these dialects, instrumental study has revealed non-neutralisation, with a contrast based on preaspiration (Karlsson & Svantesson Reference Karlsson and Svantesson2011).
A final prediction of the representations in (10) is that incomplete neutralisation effects should be centred on different cues in voicing and aspiration languages. In the Onset Prominence representations in (10), we see that the locus of laryngeal contrasts in voicing languages is lower in the stop's structure, at the VO level, than it is in aspiration languages. In the production of VC sequences, lower in the final consonant's structure implies later in the production of the sequence. As a result, incomplete neutralisation effects in voicing languages are predicted to be more robust in the consonant itself than in the preceding vowel. Some preliminary evidence for this prediction was discussed in §2, while the results of our study on Polish provide further support. This representational postulate may also be related to the somewhat modest ‘voicing effect’ of intervocalic obstruents on preceding vowels that has been described in Polish, as discussed in §3.1.Footnote 14
4.4.2 Reconciling the paradox of incomplete neutralisation
Research on incomplete neutralisation exposes a striking paradox inherent in competing approaches to the relationship between phonetics and phonology. On the one hand, observing incomplete neutralisation requires careful phonetic study of rather subtle phonetic details. For mainstream generative theorists, explaining minute differences in acoustic measures falls outside the domain of phonology. Generative solutions to the problem of incomplete neutralisation, such as phonetic implementation rules of the type proposed in (6), or opaque relations between projected and pronounced feature specifications, may allow us to model incomplete neutralisation effects. However, such strategies are stipulative, and lack the power to explain the origins of the observed differences. On the other hand, contrast maintenance in incomplete neutralisation situations seemingly reinforces the existence of underlying phonological categories, presenting a conceptual challenge to exemplar- or analogy-based approaches, which encode phonetic details but resist positing abstract phonological representations.
The Onset Prominence model allows us to reconcile this paradox. The observed phonetic differences are derived from abstract categorical representations encoding subsegmental structure. However, this is not achieved through a blanket strategy of incorporating phonetic details into phonological representations. Rather, Onset Prominence reconsiders the role of the segment for modelling the relationship between phonetics and phonology. The segment (or skeletal position) in Onset Prominence is not a universal primitive of phonological representation, which is a problematic approach to the phonetics–phonology interface that Ladd (Reference Ladd, Goldsmith, Riggle and Yu2011) dubs ‘phone idealisation’. Rather, linearisation of phonological units in Onset Prominence emerges from a single hierarchical structure that is larger than a single segment, yet is constructed from subsegmental phonetic events. Once subsegmental structure is posited as phonological, we are free to draw a clear boundary that separates phonetics and phonology, and gain a new perspective on how certain ‘phonetic details’ can behave in a phonological manner.


 Open access