CHD is a major cause of death in industrialised countries. Hyperglycaemia, even below diabetic values, plays a role in the development of CHD(Reference Coutinho, Gerstein and Wang1). Attention has been focused on dietary carbohydrates, a major contributor of postprandial glycaemia, as a risk factor for CHD. Carbohydrates that induce high postprandial blood glucose may increase the risk of CHD(Reference Ludwig2). The glycaemic index (GI) is a measure that ranks foods on the basis of the blood glucose response that they produce upon ingestion(Reference Venn and Green3). The glycaemic load (GL) takes into account, in addition to the GI, the amount of carbohydrates consumed.
Inconsistent findings on the role of dietary GI, GL and carbohydrate intake in CHD risk have been published. A recent meta-analysis of eight prospective cohort studies concluded that a high dietary GI and GL increased the risk of CHD in women but not in men(Reference Dong, Zhang and Wang4). On the contrary, a later cohort study found that a higher GL and carbohydrate intake was associated with an increased CHD risk in men but not in women(Reference Burger, Beulens and Boer5). Some findings have suggested that replacing SFA with high-GI carbohydrates, but not with low- or medium-GI carbohydrates, would associate with an increased risk of myocardial infarction (MI)(Reference Jakobsen, Dethlefsen and Joensen6). No association between replacing total carbohydrates and SFA with each other, and CHD or MI has been reported(Reference Jakobsen, Dethlefsen and Joensen6–Reference Siri-Tarino, Sun and Hu8). In a pooled analysis of eleven cohort studies, a positive association has been reported between replacing SFA with carbohydrates and the risk of coronary events but not of coronary deaths(Reference Jakobsen, O'Reilly and Heitmann9). Replacing carbohydrates with trans-fatty acids (TFA) has been associated with an increased CHD risk and replacing carbohydrates with PUFA or with MUFA has been associated with a decreased CHD risk(Reference Hu, Stampfer and Manson7).
We examined, in a large cohort of men, the associations of dietary GI and GL, replacing higher-GI carbohydrates with lower-GI carbohydrates and replacing fat (total, SFA, TFA, MUFA and PUFA) with total, low-, medium- and high-GI carbohydrates, and CHD risk.
Materials and methods
The Alpha-Tocopherol, Beta-Carotene Cancer Prevention Study
The Alpha-Tocopherol, Beta-Carotene Cancer Prevention (ATBC) Study was a randomised, double-blind, placebo-controlled primary prevention trial that tested whether supplementation with α-tocopherol, β-carotene or both would reduce the incidence of lung cancer and other cancers(10). A total of 29 133 Finnish male smokers were recruited between 1985 and 1988 from the total male population aged between 50 and 69 years in south-western Finland (n 290 406). The ATBC Study was conducted according to the guidelines laid down in the Declaration of Helsinki and was approved by the institutional review boards of the National Public Health Institute of Finland and the United States National Cancer Institute. Written informed consent was obtained from all subjects.
At baseline, participants completed a demographic, general medical, physical activity and smoking history questionnaire. Height, weight and blood pressure were measured by specially trained nurses. A fasting venous sample was collected and stored at − 70°C. Serum total cholesterol concentration and HDL-cholesterol were determined enzymatically (CHOD-PAP method; Boehringer Mannheim).
Dietary assessment
The diet over the previous 12 months was assessed at baseline using a self-administered FFQ including 276 foods and mixed dishes(Reference Pietinen, Hartman and Haapa11). In addition to the structured foods and dishes, the subjects could report the consumption of foods not listed in the FFQ. The FFQ was used with a picture booklet of 122 photographs of foods, each with three to five different portion sizes, to estimate the usual portion size of foods. During the first baseline visit, each subject received the FFQ to be completed at home. At the second baseline visit, 2 weeks later, subjects returned the FFQ, which were reviewed and completed with the help of a trained nurse. Thereafter, a senior nutritionist reviewed the FFQ for the final approval. In all, the FFQ of 27 111 participants (93 %) was satisfactorily completed.
The dietary method was validated before implementing the ATBC Study(Reference Pietinen, Hartman and Haapa11). The energy-adjusted correlations between the FFQ and 24 d food records were 0·55 for total carbohydrates and 0·72 for dietary fibre. For the total fat intake, the correlation was 0·39, for saturated fat 0·62, for trans-fat 0·61, for monounsaturated fat 0·38 and for polyunsaturated fat 0·69. The intraclass correlations in the reproducibility study were 0·70 for total carbohydrates, 0·64 for total fat and 0·60–0·73 for the different fatty acids.
Calculation of the intake of nutrients and dietary glycaemic index and glycaemic load
Nutrient intakes were calculated using the national food composition database and nutrient intake calculation software at the National Institute for Health and Welfare, Finland (formerly the National Public Health Institute)(Reference Reinivuo, Hirvonen and Ovaskainen12). The GI database (glucose as the reference food) was compiled using GI values measured in the laboratory of the National Institute for Health and Welfare and GI values published in the literature(Reference Similä, Valsta and Virtanen13). Dietary GL was calculated by summing the products of the carbohydrate amount of each food consumed multiplied by its GI divided by 100. Dietary GI was calculated by dividing the dietary GL by the total carbohydrate amount and then multiplied by 100. Intakes of energy-yielding nutrients were calculated as a percentage of total energy intake (E%) and intakes of low-, medium- and high-GI carbohydrates were calculated as follows: carbohydrates from foods with a GI ≤ 55 comprised low-GI carbohydrates, carbohydrates from foods with a GI of 56–69 comprised medium-GI carbohydrates and carbohydrates from foods with a GI ≥ 70 comprised high-GI carbohydrates(Reference Venn and Green3). Dietary GL and intake of fibre were energy-adjusted using the residual method(Reference Willett, Howe and Kushi14).
Assessment of CHD
The CHD endpoint, first acute non-fatal MI or CHD death, was identified from the National Hospital Discharge Register and the National Register of Causes of Death through the unique personal identity number assigned to each Finnish citizen. Both registers use the codes of the International Classification of Diseases (ICD). The first MI during a follow-up was identified with ICD-9 code 410 (used until 1996) or ICD-10 codes I21–I23, and CHD death included all deaths coded 410–414 (ICD-9) or I20–I25 (ICD-10).
We excluded subjects who did not complete the FFQ satisfactorily and subjects with a history of MI, angina pectoris, claudication, stroke and diabetes at baseline. Thus, the final cohort comprised 21 955 men, of whom 4379 incident CHD cases (2377 non-fatal MI and 2002 CHD deaths) were identified during a 19-year follow-up.
Statistical analysis
Baseline characteristics and dietary intakes were calculated in quintiles of dietary GI and carbohydrate intake. Person-time of follow-up from the enrolment to the date of CHD event or death from any other cause or the end of the follow-up (31 December 2004), whichever came first, was computed. Cox regression proportional hazards modelling was used to estimate the relative risks (RR) and 95 % CI for the incident CHD event. The proportional hazards assumption was tested using Schoenfeld residuals with no evidence of non-proportional hazards.
Potential confounders and main determinants of CHD were included as covariates in Cox regression models. The basic model (model 1) was adjusted for age and intervention group (supplementation during the original trial). The multivariate model (model 2) was further adjusted for smoking (years of smoking and number of cigarettes smoked daily), BMI, leisure-time physical activity, serum total cholesterol and HDL-cholesterol, blood pressure (systolic and diastolic) and intakes of energy and alcohol. Model 2 was further adjusted for dietary total fat, protein, Mg and K. As blood lipids and blood pressure may be in the causal pathway between carbohydrates and CHD, we also conducted multivariate analyses removing them as covariates and found only minor changes in risk estimates.
Multivariate nutrient density models(Reference Hu, Stampfer and Rimm15) were applied to examine the associations between isoenergetic substitutions (2 E%) of macronutrients and CHD risk. These analyses involved replacing higher-GI carbohydrates with lower-GI carbohydrates and replacing total fat and fatty acids (SFA, TFA, MUFA and PUFA) with carbohydrates. The carbohydrate variable (total, low-, medium- or high-GI carbohydrates) was included, as E%, as the exposure variable and the model was adjusted for total energy intake and for other energy-yielding nutrients (protein, alcohol and fat divided into SFA, TFA, MUFA and PUFA), as E%, except the nutrient to be replaced. When examining separately the replacements of fats with low-, medium- and high-GI carbohydrates, the three carbohydrate variables were included in the model, one as the exposure variable and two others as adjusting variables, in turn. The RR of the model can be interpreted as the effect of replacing the energy-yielding nutrient(s) excluded from the model with carbohydrates.
The linear regression model including age, intervention group and each food ingredient group was fit to detect the food groups that explained most of the inter-individual variation in dietary GI. The associations between the ingredient groups explaining more than 1 % of the variation and the risk of CHD were assessed in a Cox regression model adjusted for age and intervention group.
Dietary fibre(Reference Ulmius, Johansson and Onning16) and alcohol(Reference Hätönen, Virtamo and Eriksson17) influence the postprandial glucose response and BMI may modify the association between the GI and acute MI(Reference Mursu, Virtanen and Rissanen18). Therefore, the effect modification of BMI, fibre intake and alcohol consumption (below and above the median) on the association between dietary GI and the replacement of total fat and fatty acids with total carbohydrates and CHD risk was tested using the likelihood ratio test by comparing the model with the interaction term of the possible effect modifier and the exposure variable with the model without it.
Tests for linearity of trend were performed using the Wald test by treating the median values of each quartile as continuous variables. All P values are two-sided. Analyses were carried out with STATA software (version 9; Stata Corporation).
Results
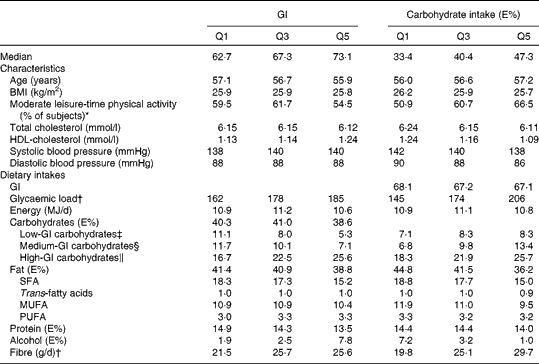
The median dietary GI was 67·3 and intake of carbohydrates 40·4 E%. On average, subjects with a higher GI were younger and had a higher serum HDL-cholesterol concentration (Table 1). With an increasing GI, the intake of SFA and protein decreased and the intake of alcohol and fibre increased. Subjects with a higher carbohydrate intake were older and more physically active during leisure time and had a lower BMI, serum total and HDL-cholesterol and blood pressure. With an increasing carbohydrate intake, the intake of SFA, MUFA and alcohol decreased and the intake of fibre increased.
Baseline characteristics and dietary intakes (medians) by the lowest, middle and highest quintiles (Q) of dietary glycaemic index (GI) and carbohydrate intake (n 21 955)

E%, percentage of total energy intake.
* Leisure-time physical activity classified as light or moderate.
† Energy-adjusted using the residual method.
‡ Carbohydrates from foods with a GI ≤ 55.
§ Carbohydrates from foods with a GI of 56–69.
∥ Carbohydrates from foods with a GI ≥ 70.
The total carbohydrate intake correlated negatively with the total fat intake (Spearman's correlation coefficient − 0·57), as well as with SFA+TFA and MUFA intakes (Spearman's correlation coefficient − 0·34 and − 0·53, respectively). The total carbohydrate intake did not correlate with PUFA intake (correlation coefficient − 0·02). Intakes of high-GI and medium-GI carbohydrates had weaker correlations with fat intakes than total carbohydrates, from 0·08 to − 0·32. The intake of low-GI carbohydrates correlated only weakly with fat intakes from 0·04 to − 0·10.
Dietary glycaemic index, glycaemic load and the replacement of higher-glycaemic-index carbohydrates with lower-glycaemic-index carbohydrates
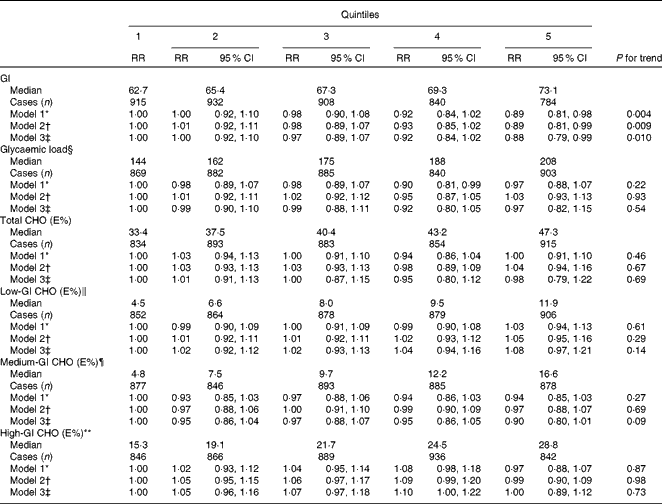
Dietary GI was inversely associated with the risk of CHD in the multivariate model adjusted for age, intervention group, smoking, BMI, physical activity, blood pressure, serum total and HLD-cholesterol and intakes of energy and alcohol: RR in the highest v. lowest quintile was 0·89 (95 % CI 0·81, 0·99, P for trend = 0·009; Table 2). Dietary GL was not associated with CHD risk. The intakes of total, low-, medium- or high-GI carbohydrates were also not associated with CHD risk. Further adjustment for dietary total fat, protein, Mg and K did not change the associations significantly.
Risk of CHD in quintiles of dietary glycaemic index (GI), glycaemic load and intakes of total, low-, medium- and high-GI carbohydrates as a percentage of total energy intake (Relative risks (RR) and 95 % confidence intervals, n 21 955)
CHO, carbohydrates; E%, percentage of total energy intake.
* Model 1: adjusted for age and intervention group.
† Model 2: adjusted for age, intervention group, smoking, BMI, physical activity, serum total and HDL-cholesterol, blood pressure and intakes of energy and alcohol.
‡ Model 3: adjusted for age, intervention group, smoking, BMI, physical activity, serum total and HDL-cholesterol, blood pressure and intakes of energy, alcohol, total fat, protein, Mg and K.
§ Energy-adjusted using the residual method.
∥ Carbohydrates from foods with a GI ≤ 55.
¶ Carbohydrates from foods with a GI of 56–69.
** Carbohydrates from foods with a GI ≥ 70.
The replacement of high-GI carbohydrates with an isoenergetic amount of medium- or low-GI carbohydrates or the replacement of medium-GI carbohydrates with low-GI carbohydrates was not associated with CHD risk. Multivariate RR in the highest v. lowest quintile was 0·94 (95 % CI 0·84, 1·05, P for trend = 0·41) for the replacement of high-GI carbohydrates with medium-GI carbohydrates, 1·05 (95 % CI 0·95, 1·17, P for trend = 0·31) for the replacement of high-GI carbohydrates with low-GI carbohydrates and 1·07 (95 % CI 0·95, 1·21, P for trend = 0·27) for the replacement of medium-GI carbohydrates with low-GI carbohydrates.
The inter-individual variation in dietary GI of the present study was explained mainly by beer (43 %) and milk (22 %) (Table 3). The other foods explained clearly less of the variation (fruits and berries 6 %, sugars 5 %, yogurt and ice cream 4 %, rye 3 % and sugar-sweetened berry juices, sweets, fruit juices, roots, potatoes and coffee 1–2 % each). A positive association was observed between the consumption of milk and CHD risk (RR for increasing quintiles 1·00, 1·11, 1·19, 1·23 and 1·22, P for trend < 0·001) and an inverse association of the consumption of fruits and berries (RR for increasing quintiles 1·00, 1·01, 0·95, 0·84 and 0·92, P for trend = 0·005) and the consumption of roots (RR for increasing quintiles 1·00, 0·96, 0·86, 0·88 and 0·78, P for trend < 0·001) with CHD risk.
Contribution of the food ingredient groups to inter-individual variations in dietary glycaemic index and association between the consumption of each ingredient group and the risk of CHD* (Relative risks (RR) and 95 % confidence intervals, n 21 955)

* Ingredient groups contributing at least 1 % to variation included, adjusted for age and intervention group, model R 2 0·78.
† RR for an increase of 100 g of food or 200 g of beverage.
‡ Liquid, non-sugared milk products.
Replacement of fat with carbohydrates
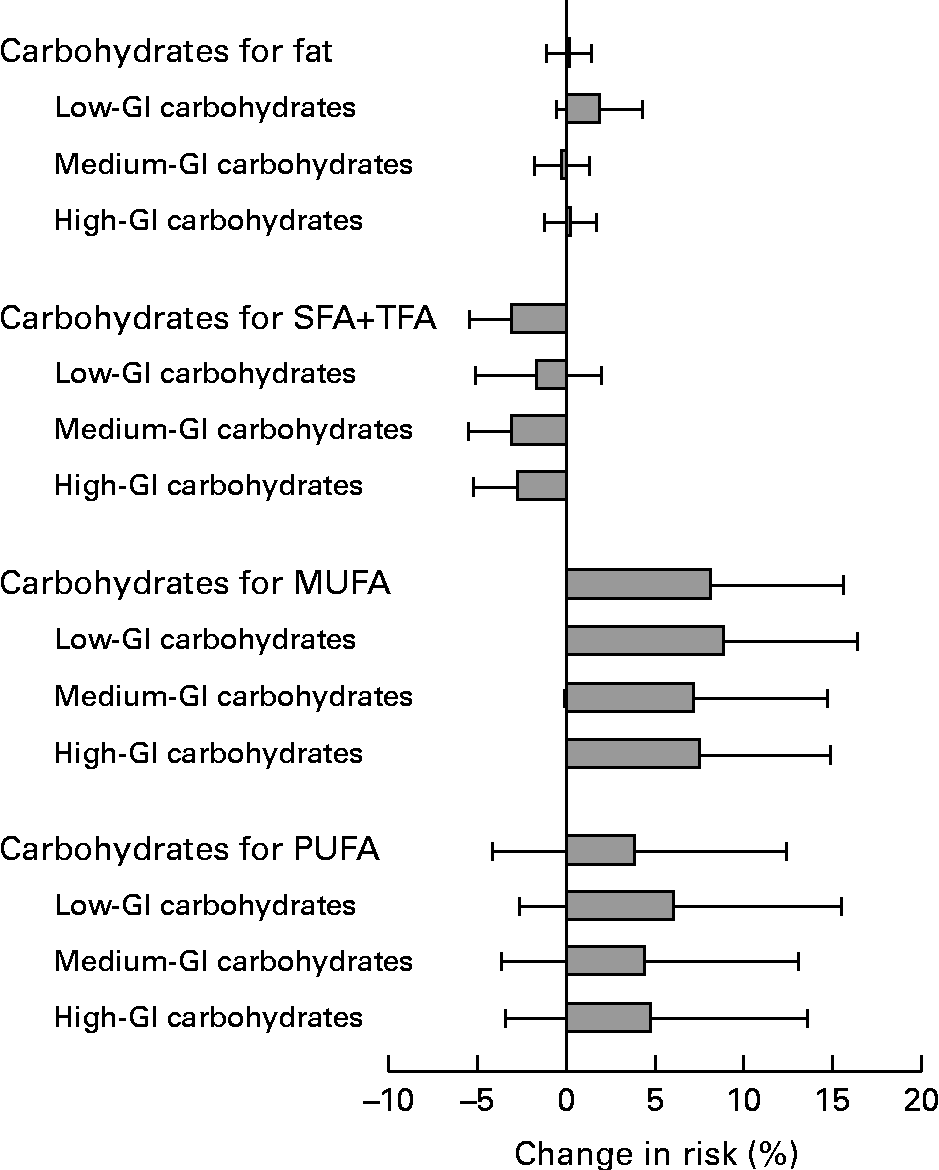
Carbohydrate (total; low-, medium- and high-GI carbohydrates) substitution for total fat was not associated with CHD risk (Fig. 1). The replacement of 2 E% SFA and TFA with total, medium- and high-GI carbohydrates was associated with a decreased CHD risk (multivariate RR 0·97 (95 % CI 0·94, 0·99), 0·97 (95 % CI 0·94, 0·99) and 0·97 (95 % CI 0·95, 0·999), respectively). The replacement of SFA and TFA with low-GI carbohydrates was not associated with CHD risk. When the replacement of SFA or TFA with carbohydrates was tested separately, both were inversely associated with CHD risk, but the associations were not significant.
Changes in the relative risk (and 95 % CI) of CHD (n 4379 cases) when 2 % of energy from total fat, SFA and trans-fatty acids (SFA+TFA), MUFA and PUFA were replaced with total, low-, medium- or high-glycaemic-index (GI) carbohydrates (n 21 955). Low-GI carbohydrates, carbohydrates from foods with a GI ≤ 55; medium-GI carbohydrates, carbohydrates from foods with a GI of 56–69; high-GI carbohydrates, carbohydrates from foods with a GI ≥ 70. Adjusted for age, intervention group, smoking, BMI, physical activity, serum total and HDL-cholesterol, blood pressure, total energy, and protein, alcohol and carbohydrate and fat subgroups as a percentage of energy (E%) (in each model, the nutrient to be replaced was left out and the model was adjusted for non-substitutive nutrients).
The replacement of MUFA with total, low- or high-GI carbohydrates was associated with an increased risk (multivariate RR 1·08 (95 % CI 1·01, 1·16), 1·09 (95 % CI 1·02, 1·16) and 1·08 (95 % CI 1·01, 1·15), respectively; Fig. 1). A positive association between replacing MUFA with medium-GI carbohydrates and CHD risk was borderline significant (multivariate RR 1·07, 95 % CI 1·00, 1·15). The replacement of PUFA with carbohydrates was associated with an increased risk, but the associations were not significant.
Effect modification
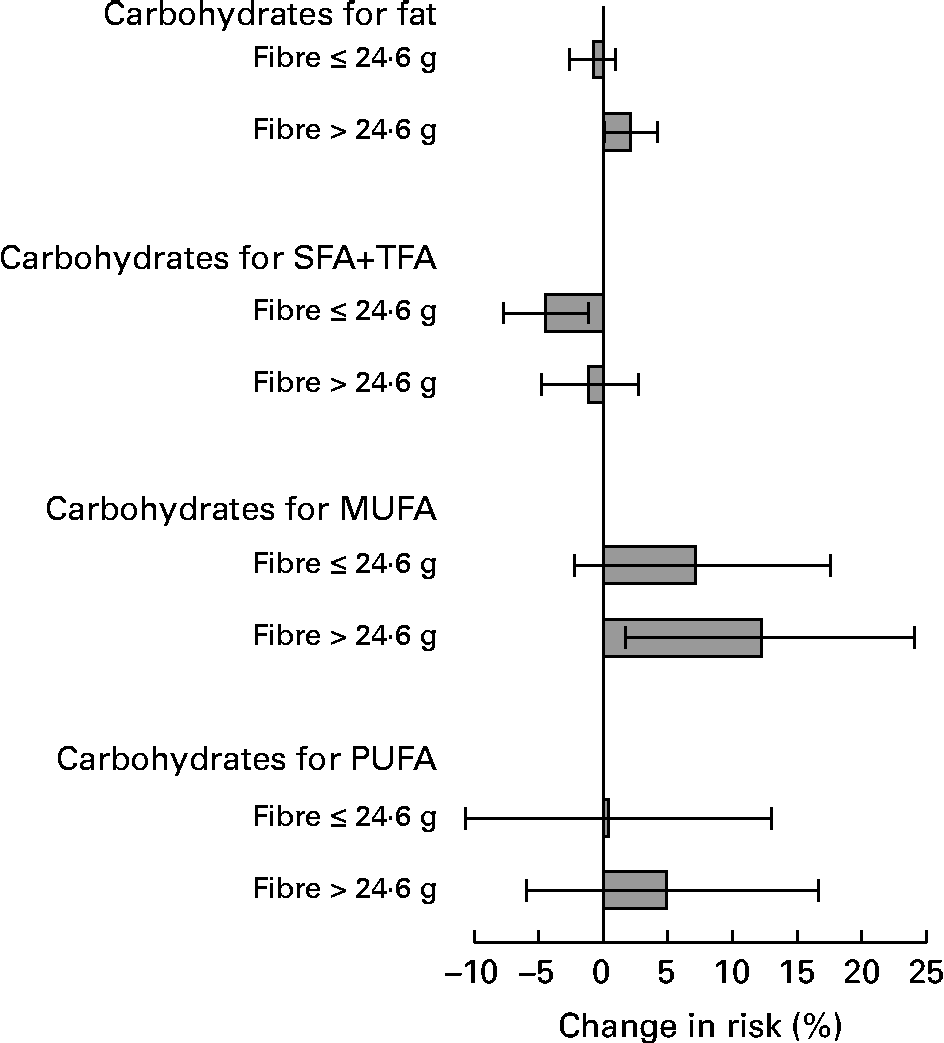
In the stratified analyses, dietary GI was inversely associated with CHD risk among the subjects with a higher fibre intake (>24·6 g/d; multivariate RR in the highest v. lowest quintile 0·84, 95 % CI 0·72, 0·98; P for trend = 0·006), but not among the subjects with a lower fibre intake ( ≤ 24·6 g/d; RR 0·98, 95 % CI 0·84, 1·14; P for trend = 0·61) (P for interaction = 0·005). Fibre intake also modified significantly the associations between the replacement of total fat, SFA and TFA, MUFA and PUFA with carbohydrates and the risk of CHD (Fig. 2). No effect modification of BMI and alcohol consumption was evident.
Changes in the relative risk (and 95 % CI) of CHD when 2 % of energy from total fat, SFA and trans-fatty acids (SFA+TFA), MUFA and PUFA were replaced with total carbohydrates, stratified by fibre intake (median fibre intake 24·6 g/d). P value for interaction was 0·02 for the replacement of total fat and fatty acids each. Adjusted for age, intervention group, smoking, BMI, physical activity, serum total and HDL-cholesterol, blood pressure, total energy, and protein, alcohol and fat subgroups as a percentage of energy (E%) (in each model, the nutrient to be replaced was left out and the model was adjusted for non-substitutive nutrients).
Discussion
In the present prospective cohort study, dietary GI was inversely associated with CHD risk, but the GL had no association. Previous findings have been inconsistent: a recent meta-analysis of eight, mainly European, prospective cohort studies has suggested that higher dietary GI and GL were not associated with an increased risk of CHD in men, although a positive association was found in women(Reference Dong, Zhang and Wang4), while a later Dutch cohort study has suggested a positive association of the GL in men but not in women and no association of the GI in both sex(Reference Burger, Beulens and Boer5). An inverse association between dietary GI and heart disease has been reported in men in one cohort study(Reference Grau, Tetens and Bjornsbo19). Residual confounding is a possible explanation for differences between men and women: consumption of foods that influence dietary GI and also have other properties which influence CHD risk may differ between men and women. Such foods may be, for example, fruits, having a low GI and associated with a decreased CHD risk(Reference Dauchet, Amouyel and Hercberg20). In the present study population, consumption of fruits and berries and consumption of roots were inversely associated with CHD risk, but had only a minor contribution to the inter-individual variation in dietary GI (fruits and berries 6 % and roots 2 %). Instead, consumption of milk, a low-GI food, contributed substantially to the inter-individual variation in dietary GI (22 %). Milk consumption associated positively with CHD risk in the present study population where consumption of high-fat milk was high. This explained the inverse association between dietary GI and CHD risk: further adjustment for milk consumption removed the association. The former study that reported an inverse association between dietary GI and heart disease also reported the correlation of milk with a low overall GI(Reference Grau, Tetens and Bjornsbo19).
The average dietary GI was higher than that reported in other studies(Reference Burger, Beulens and Boer5, Reference Mursu, Virtanen and Rissanen18, Reference Sieri, Krogh and Berrino21). In the present study, the main food ingredient sources of dietary GI (equals to sources of the GL) were cereals, potatoes, and sugar and sweets(Reference Similä, Valsta and Virtanen13). Thus, the reason for the higher dietary GI may be the low consumption of low-GI foods such as fruits and the high consumption of high-GI foods such as cereals (prepared mainly from milled flour), potatoes and beer(Reference Genkinger, Spiegelman and Anderson22–Reference Park, Hunter and Spiegelman24).
No association between the total carbohydrate intake and CHD risk was found in the present study. Previous findings from cohort studies have been inconsistent: a positive association has been reported in men(Reference Burger, Beulens and Boer5) and in women(Reference Sieri, Krogh and Berrino21) as well as no association in men(Reference Mursu, Virtanen and Rissanen18, Reference Sieri, Krogh and Berrino21) and in women(Reference Burger, Beulens and Boer5, Reference Liu, Willett and Stampfer25). The present finding of no association between the intake of low-, medium- or high-GI carbohydrates and CHD risk was in accordance with a previous cohort study reporting no association between low- or high-GI carbohydrate intake and CHD risk in men (association of medium-GI carbohydrates was not reported)(Reference Sieri, Krogh and Berrino21). Thus far, only a few studies have separately reported the associations of intakes of low-, medium- and high-GI carbohydrates and the risk of CHD. Reporting them in addition to the associations of dietary GI and GL could clarify the inconsistent findings of the role of GI in the risk of disease.
We also analysed the associations between the replacement of higher-GI carbohydrates with lower-GI carbohydrates and CHD risk, but no associations were found. This finding does not support the hypothesis that carbohydrates that induce a rapid postprandial elevation in blood glucose may have more detrimental effects on the risk of CHD compared with carbohydrates that elevate blood glucose less and more slowly. However, foods that contribute to the GI can be very different across populations and their other properties affecting the risk of CHD may mask the potential effect of the GI.
No association between carbohydrate substitution for total fat and CHD risk was found in the present study and in a previous cohort study(Reference Hu, Stampfer and Manson7). The result is also in line with the outcome from a dietary intervention study designed to reduce total fat intake and increase the intakes of vegetables, fruits and grains where the intervention, without the focus on specific fats, had no influence on the risk of CHD(Reference Howard, Van Horn and Hsia26). The replacement of SFA and TFA with total carbohydrates was associated with a decreased CHD risk in the present study. When the replacement of SFA or TFA with carbohydrates was tested separately, both were inversely associated with CHD risk, but the associations were not significant. However, in the present study population, the main source of both SFA and TFA was dairy products, and thus reducing SFA intake will lead to a simultaneous decrease in TFA intake. Therefore, we analysed the combined replacement of SFA and TFA. No association between replacing SFA and total carbohydrates has been reported in other studies(Reference Jakobsen, Dethlefsen and Joensen6–Reference Siri-Tarino, Sun and Hu8). Instead, replacing TFA with carbohydrates has been associated with a decreased CHD risk(Reference Hu, Stampfer and Manson7). In a pooled analysis of eleven cohort studies, a positive association has been reported between replacing SFA with carbohydrates and the risk of coronary events but not coronary deaths(Reference Jakobsen, O'Reilly and Heitmann9).
Some findings have suggested that replacing SFA with high-GI carbohydrates, but not with low- or medium-GI carbohydrates, would associate with an increased risk of MI(Reference Jakobsen, Dethlefsen and Joensen6). However, the present findings did not support this: the replacement of SFA and TFA with medium- or high-GI carbohydrates was significantly and with low-GI carbohydrates non-significantly associated with a decreased CHD risk. It is noteworthy, however, that food sources of SFA and TFA and low-GI carbohydrates overlap in the present study population since high-fat milk products, consumed in abundance by the men, contribute to these both.
The replacement of MUFA with carbohydrates was associated with an increased CHD risk. The replacement of PUFA with carbohydrates was associated with an increased risk too, but the associations were not significant. Previously, replacing unsaturated fatty acids with carbohydrates has been associated with an increased CHD risk: for PUFA, a significant association has been reported and for MUFA a borderline significant association(Reference Hu, Stampfer and Manson7). Intakes of both MUFA and PUFA were lower in the present study population compared with the former study.
In the present study population, fibre intake (mainly cereal fibre) may have mitigated the potential disadvantages of a high GI since some of the high-GI foods were major sources of cereal fibre, and fibre intake increased with increasing dietary GI, GL and high-GI carbohydrate intake(Reference Similä, Valsta and Kontto27), and, on the other hand, fibre intake was inversely associated with CHD risk(Reference Pietinen, Rimm and Korhonen28). Since fibre was a central nutrient related to carbohydrate intake, we did not adjust for it to avoid overadjustment. Effect modification of fibre intake suggested that the inverse association between dietary GI and CHD risk was modified by fibre intake: dietary GI was inversely associated with CHD risk among the subjects with a higher fibre intake, but not among the subjects with a lower fibre intake. Increasing carbohydrate intake at the expense of SFA and TFA was beneficial among the subjects with a lower fibre intake, whereas increasing carbohydrate intake at the expense of MUFA and PUFA tended to be more harmful among the subjects with a higher fibre intake. We do not have any obvious explanation for these interactions. Due to many comparisons, the possibility of chance cannot be ruled out either.
One strength of the present study was its prospective cohort design, which minimised recall and selection biases. On the other hand, although the background and dietary data allowed adjustment for many dietary and non-dietary potential confounders, we cannot entirely rule out the possibility of residual or unmeasured confounding. The diet was assessed at baseline and data on possible changes thereafter were not available. This involves the potential for measurement error and may have attenuated the associations towards unity. We retrieved incident CHD cases from national registers. In a validity study, 94 % of the diagnoses of the major coronary events in the registers were reviewed as true major coronary events defined by strict criteria(Reference Rapola, Virtamo and Korhonen29). As the participants comprised male smokers, the results cannot be directly generalised to females or non-smokers.
We conclude that, in the present study population of middle-aged male smokers, dietary GI was inversely associated with the risk of CHD, whereas the GL had no association. The replacement of higher-GI carbohydrates with lower-GI carbohydrates was not associated with CHD risk either. The replacement of SFA and TFA with carbohydrates was associated with a decreased risk and that of MUFA with carbohydrates was associated with an increased risk. The associations with CHD risk did not depend on the GI of the substituting carbohydrates, but depended on which kind of fatty acids was replaced. Thus, the present study suggests that dietary recommendations should focus more on the fatty acid composition of the diet than on the GI of carbohydrates.
Acknowledgements
The ATBC Study was supported by the US Public Health Service contracts (N01-CN-45165, N01-RC-45035 and N01-RC-37004) from the National Cancer Institute. The present study was supported by the Academy of Finland (grants no. 111420 and 141005), the Juho Vainio Foundation and the Finnish Foundation for Cardiovascular Research. None of the authors had any personal or financial conflicts of interest. M. E. S., L. M. V. and J. V. contributed to the conception and design of the study. M. E. S. and J. P. K. performed the statistical analysis. M. E. S. wrote the manuscript. All authors participated in the critical revision of the manuscript.