

CVD are the leading cause of death worldwide, accounting for approximately 30 % of lives lost each year( 1 ). Overweight and obesity, unhealthy diet and dyslipidaemia are modifiable risk factors( Reference Mendis, Puska and Norrving 2 ). From a nutrition perspective, excessive intakes of energy, non-stearic SFA and industrially produced trans-fatty acids (TFA) should be avoided( Reference Mozaffarian, Aro and Willett 3 , 4 ). These fatty acids increase serum LDL and total cholesterol, important risk factors in the development of atherosclerosis( Reference Mozaffarian, Aro and Willett 3 , 4 ). Convincing evidence supports substituting SFA with cis-polyunsaturated fats to decrease CVD risk( 4 – Reference Hooper, Martin and Abdelhamid 7 ).
Voluntary front-of-pack summary indicator (FOP-SI) food labelling programmes, such as the Nordic Keyhole( 8 ) and the Tick in Australia and New Zealand( 9 , 10 ), offer food industry a marketing incentive to engage in the development of healthier food products. The non-profit National Heart Foundation (NHF) of New Zealand introduced the Tick Programme in 1991. Independent experts regularly review the nutrient criteria for sixty-two food categories and independent laboratories assess product adherence. Licensed products display the Tick logo on their label, implying health endorsement. Thus, in addition to promoting manufacturer reformulation, FOP-SI symbols are simple, interpretative aids for consumers to identify food products with a healthier nutrient profile( Reference Smith, Stephen and Dombrow 11 , Reference Vyth, Steenhuis and Brandt 12 ).
FOP-SI programmes should be evaluated regularly for their nutritional impact. Recently, the credibility of North American FOP-SI programmes has been questioned( Reference Emrich, Qi and Cohen 13 ); however, programmes may vary in effectiveness. Most evaluations of specific FOP-SI programmes assessed a single nutrient( Reference Young and Swinburn 14 – Reference Dummer 16 ). To the best of our knowledge, Vyth et al. published the only study evaluating a FOP-SI programme across multiple nutrients, as well as assessing SFA and TFA( Reference Vyth, Steenhuis and Roodenburg 17 ). This Choices Programme evaluation relied solely on manufacturer self-reported data.
Our current understanding of the Tick’s nutritional impact is limited and manufacturer perceptions of this programme have not been formally investigated. While it is assumed that manufacturers engage in healthier product development due to the perceived marketing opportunity the Tick provides, evidence is lacking. Marketing evaluations of the Tick tend to assess consumer perceptions and self-reported use of the logo( 18 ), but this evidence may be insufficient for commercial decision making.
The present research aimed to evaluate the nutritional impact of the Tick Programme by assessing nutrient changes to the purchased food supply and comparing the nutritional quality of Tick v. non-Tick products (nutrients specified in Table 1). Factors influencing food manufacturer decisions to develop healthier products and to participate in the Tick Programme were also explored.
Tick nutrient criteria for selected food categories

TFA, trans-fatty acids (industrially made and natural).
* Tick criteria specify maximum limit.
† Tick criteria specify minimum level.
‡ Dairy and soya products.
§ Any food product that is presented as a quick-and-easy alternative to a home-prepared meal and is based on a recipe rather than being a single meal ingredient.
Methods
This mixed methods, observational study used cross-sectional and change over time data to evaluate the nutritional impact of a subset of newly licensed Tick products.
Food category and product selection
Tick product analysis was limited to five food categories considered to be major sources of SFA in the New Zealand diet (Table 1). Similar to Nordic countries( 19 ), New Zealand adults and children have a mean SFA intake of 13–14 % of total energy( 20 , 21 ), which exceeds the 10 % population recommendation( 4 , 19 ). Most of this SFA comes from dairy products, potato products, margarine, baked goods and meat/poultry( 20 , 21 ).
Findings from New Zealand’s Children and Adult Nutrition Surveys were used to identify thirteen food groups contributing at least 4 % of SFA intake to the New Zealand diet( 20 , 21 ). Equivalent Tick food categories with an SFA criterion were prioritised based on number of eligible products; there were no eligible potato products or baked goods. Three Tick food categories (Milk, Plain Meat and Plain Poultry) were unavailable for selection as government regulations dictated low-fat milk content and the Tick Programme approved butchery cuts of meat (not product batches). Consequently, five Tick food categories were selected (the food categories and nutrients monitored for Tick compliance are specified in Table 1).
To capture recent activities, products in selected food categories had to be either newly formulated (not pre-existing) or reformulated and registered with the Tick Programme between 1 January 2011 and 31 December 2013. Products were excluded if no sales data were available (n 3).
Nutrient content and sales data collection
To quantify changes in Tick nutrients (Table 1), the following product information was required:
-
1. nutrient content (per 100 g) pre- and post-reformulation or as formulated;
-
2. proxy baseline nutrient content (per 100 g) for newly formulated products; and
-
3. New Zealand sales in weight (kg) from the Tick licensing date (after 1 January 2011) to 31 December 2013.
Product nutrient content and sales data were collected from various sources. The NHF database contained an independent laboratory report of each product’s nutrient content (per 100 g) at the time of licensing. Product manufacturers (n 11) were approached for pre-reformulation nutrient content and product sales data. Manufacturers were offered individualised results as an incentive to complete the product-specific questionnaire emailed to them. Follow-up contact was made by telephone (one week later) and email (three and six weeks after the initial email).
Six manufacturers of twelve eligible products did not supply required questionnaire data, so it was sourced elsewhere. Two products with additional records in the NHF database dated prior to 2011 were assumed reformulated and nutrient values from their previous laboratory report were used as pre-reformulation values. The remaining ten products were classified as new products. Supermarket sales data were purchased from Nielsen Ltd, a market research company. NHF licensing information was used to estimate the start date for reformulated product sales.
Unlike reformulated products, there are no baseline nutrient values for new products. Therefore, a proxy baseline value was estimated using non-Tick products. Five major supermarkets in Auckland, New Zealand were visited in August 2014. Non-Tick products matching Tick product type were identified and their nutrient information panel was photographed (297 products in total). These data were used to calculate the average nutrient content of non-Tick products similar to each Tick product.
However, manufacturers are not required to report some Tick nutrients (TFA, fibre and calcium) on the nutrient information panel( 22 ), which limited analysis of affected formulated products. Data were available for only two baseline proxies: calcium in fresh yoghurts and TFA in edible oil spreads. Most of the non-Tick fresh yoghurt product labels (89 %) reported calcium per 100 g, allowing analysis. For edible oil spreads, the mean TFA content of seventeen edible oil spread products was calculated using data from a 2009 New South Wales Food Authority report( 23 ).
Calculations for nutrient changes to the purchased food supply
For each product, the change in Tick nutrient values (current nutrient content (g/kg) minus previous nutrient content (g/kg)) was multiplied by sales volume (kg). As noted previously, the proxy baseline value for new products was based on the average nutrient content of similar non-Tick products. Figures were summed (e.g. total SFA change) or averaged (e.g. average SFA content) for reporting purposes only. Ranges were also provided.
Manufacturer interviews
Manufacturers of eligible products (n 11) were also invited to take part in a 30 min semi-structured interview. Open-ended questions were used to explore factors driving their decisions to develop products with less SFA and their perceptions of the Tick Programme.
The audio-recorded interviews were transcribed verbatim and checked for accuracy. The first and last authors independently performed a thematic analysis of these transcripts( Reference Braun and Clarke 24 , Reference Bradley, Curry and Devers 25 ), before discussing and agreeing on emerging themes. Amended themes were subsequently reviewed against the data to check for accuracy and then the final themes were defined.
Results
Participants
Six of eleven food manufacturers provided questionnaire data, accounting for 73 % of eligible products (n 33). Manufacturer characteristics are shown in Table 2. Of the four manufacturers interviewed, companies 1 and 2 produced a range of food and beverage products and had in-house nutrition expertise, whereas companies 3 and 4 had a more specialist product range.
Characteristics of food manufacturers (of forty-five Tick products), New Zealand, 2011–2013

NZ, New Zealand; Q, Questionnaire; I, Interview.
* Product(s) in questionnaire and/or discussed during interview(s).
† 1, interviewed in March or April 2014; 2, interviewed in August or September 2014.
Nutrient changes to the purchased food supply
Forty-five eligible products were analysed, accounting for 31 % of all Tick products in the five selected food categories on 4 November 2014. The majority of eligible products (69 %) were newly formulated. Time in market ranged from 1 to 36 months (Table 3).
Nutrient changes to the purchased food supply from forty-five eligible Tick products, New Zealand, 2011–2013

R, reformulated; F, formulated; TFA, trans-fatty acids; NA, not available.
* For formulated products the baseline reference value was the average nutrient content of similar non-Tick products: Margarines or Dairy blends; Fresh dairy yoghurts (sweetened) in a tub; Frozen dairy on a stick or Frozen yoghurts; Frozen meals: Meat and vegetables (separate), Pasta in tomato or cream sauce, Asian noodles, or Fried rice/risotto; Frozen chicken breaded finger foods or steaks/schnitzels, Fresh chicken sausages, or Canned chicken.
† Sales volume from date product entered New Zealand market after Tick licensing (earliest 1 January 2011) to 31 December 2013.
‡ Tick criteria specify maximum limit.
§ Tick criteria specify minimum level.
|| TFA value not recorded in one product’s laboratory report; used baseline proxy if available (Edible Oil Spreads), otherwise excluded (Ready Meals).
¶ Insufficient information on nutrient information panels.
In three food categories with an energy criterion, twenty-six products removed 4·1 million megajoules of energy from the purchased food supply. All food categories had an SFA criterion, so forty-five products removed 156·0 tonnes of SFA from food products sold in New Zealand during the study period. Most of this SFA reduction was attributable to eight edible oil spreads (63 %) and six frozen desserts (32 %; Table 3). The edible oil spreads tended to enter the market later than frozen desserts, but these spreads sold in greater quantities (Table 3). In addition to SFA reductions, 15·4 tonnes of TFA were eliminated from these edible oil spreads. Protein and micronutrient changes are shown in Table 3.
Nutritional quality of Tick v. non-Tick products
On average, eligible Tick products were 14–76 % lower in energy, SFA, TFA and sodium than similar non-Tick products in the food category (Table 4). Compared with non-Tick products, frozen desserts and yoghurt & dairy desserts had 46 % and 30 % less energy, respectively, and edible oil spreads had 76 % less TFA. Across categories, eligible Tick products had 20–72 % less SFA than similar non-Tick products; SFA values (g/100 g) are specified in Table 5. While SFA increased in ten Tick products (six reformulated, four formulated), levels were within permitted levels and all reformulated products were at least 45 % lower in SFA than similar non-Tick products.
Eligible Tick product nutrient values (per 100 g) as a proportion of similar non-Tick productsFootnote *: category average and range for forty-five eligible Tick products, New Zealand, 2011–2013

TFA, trans fatty acids; NA, not available.
* Similar non-Tick products: Margarines or Dairy blends; Fresh dairy yoghurts (sweetened or unsweetened) in a tub; Frozen dairy on a stick or Frozen yoghurts; Frozen meals: Meat and vegetables (separate), Lasagne, Pasta in tomato or cream sauce, Asian noodles, or Fried rice/risotto; Frozen chicken breaded finger foods or steaks/schnitzels, Fresh chicken sausages, or Canned chicken.
† Number of Tick products not achieving at least a 20 % reduction: Edible Oil Spreads, SFA (n 2) or sodium (n 3); Frozen Desserts, (n 1); Ready Meals, energy (n 4), SFA (n 2) or sodium (n 2); Processed Poultry, SFA (n 3, canned products).
Change in saturated fat content of forty-five eligible Tick products, New Zealand, 2011–2013

R, reformulated; F, formulated.
* For formulated products the baseline reference value was the average SFA content of similar non-Tick products: Margarines or Dairy blends; Fresh dairy yoghurts (sweetened) in a tub; Frozen dairy on a stick or Frozen yoghurts; Frozen meals: Meat and vegetables (separate), Pasta in tomato or cream sauce, Asian noodles, or Fried rice/risotto; Frozen chicken breaded finger foods or steaks/schnitzels, Fresh chicken sausages, or Canned chicken.
Drivers of eligible product development
Six interviews with four food manufacturers (six interviewees; Table 2) revealed both external and internal factors appeared to drive product development, Tick licensing and sustainability in the marketplace. These interrelated factors are summarised in Fig. 1.
(colour online) Perceived drivers of eligible product development and registration with the Tick Programme based on interviews with food manufacturers (n 4), New Zealand, 2014
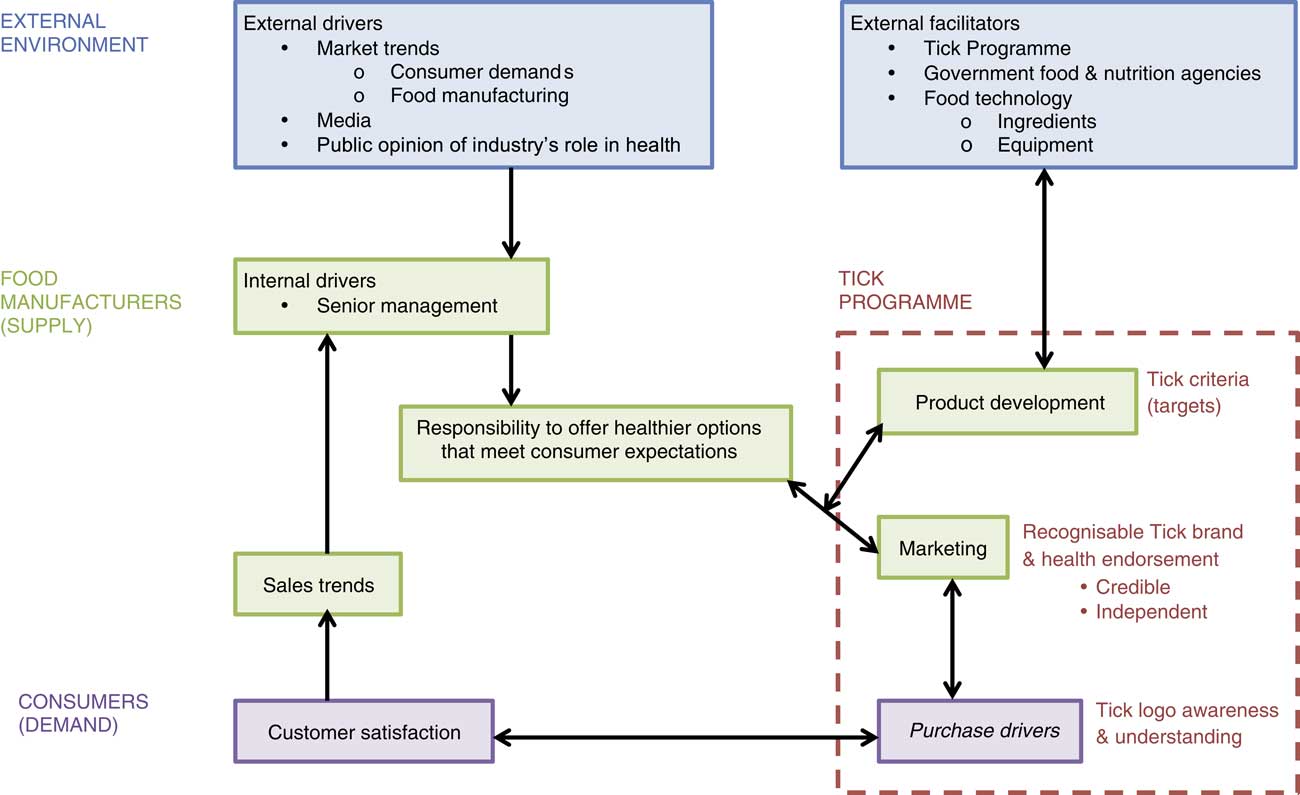
External drivers
Participating manufacturers continuously monitored international market trends, including evolving consumer demand and innovations in food technology, and their own sales trends to determine product offerings (Fig. 1). Consumer demand appeared to have a significant influence on participating manufacturers’ products, as one meat/poultry manufacturer (company 3) explained:
‘Any food manufacturing company that doesn’t listen to what the people are saying, they won’t be in business long. So we do tend to look at consumer trends and what’s happening …’
Consumer demand influenced eligible product development and its sustainability in the marketplace. When a shift in consumer demand negatively affected sales, participating manufacturers commonly responded by reformulating the product, formulating a new product or discontinuing the product line.
Many factors were said to influence consumer demand for food products including taste, sensory properties, health, price, packaging and shelf life. Taste was cited as the primary driver of food purchases, but representatives reported that consumers increasingly considered health, as long as taste was not compromised. Company 3’s representative mentioned the media’s role in influencing consumer health expectations of food. For example, sugar was topical in New Zealand and Australian media during data collection (dates noted in Table 2). Without prompting, three of four manufacturers mentioned sugar and two reported recent reformulation efforts to reduce sugar content. The dairy manufacturer (company 2) reported they had consumers stating, ‘sugar is the devil’. Participating manufacturers had to distinguish media-driven health fads from lasting trends, and interviewees said they relied on scientific nutrition advice from governments and credible health organisations, like the NHF, to inform their decisions (Fig. 1).
Internal drivers
External factors appeared to drive senior managers’ sense of responsibility to offer healthier options to consumers, a key internal driver of eligible product development (Fig. 1). Two participating manufacturers acknowledged they had a role to play in preventing current public health issues, such as obesity. However, the level of corporate engagement in promoting healthier food production varied between manufacturers.
In alignment with corporate self-interests, the larger manufacturers of ‘healthier’ products (companies 1 and 2) appeared to commit greater resources to the nutrient composition of food products than the smaller manufacturers of relatively ‘less healthy’ products (companies 3 and 4). Companies 1 and 2 described corporate values promoting well-being as well as policies, procedures and staff to ensure nutrition was considered for all products. For example, company 2’s Chief Executive Officer introduced targets to reduce the fat, salt and sugar content of their products over time:
‘So there is sort of two arms, so I guess one is the corporate driven thing where we want to make sure the products we sell are good for people and are making people eat well. But at the same time, on the other approach, is to make sure we’re delivering to what consumers are looking for with regards to health.’
This quote highlights interplay between external and internal drivers (Fig. 1) and the challenge of balancing both science and belief-based health expectations. All four manufacturers attempted to meet diverse customer needs by adding Tick products to a product range.
Furthermore, all four manufacturers were driven by the opportunity to market health. They acknowledged the Tick Programme’s role in providing nutrient criteria to facilitate product development and believed the independent Tick logo was a credible health endorsement for consumers (Fig. 1).
Perceptions of Tick nutrient criteria
Most participants appreciated joint Australian and New Zealand nutrient criteria, which were set and enforced by a credible external health agency, the NHF (Fig. 1). Company 1, who had a long-standing relationship with the NHF, valued being consulted about the technological feasibility of proposed criteria changes.
While these criteria often set the eligible product development brief (Fig. 1), some limitations were noted. Both meat/poultry manufacturers suggested SFA criteria for processed meat/poultry products might compromise flavour to an extent that affects market viability. On the other hand, the dairy manufacturer (company 2) wanted confirmation that the nutrient criteria were up to date with the latest scientific evidence, as well as consumers’ definition of health, especially in relation to sugar:
‘How’s that symbol of healthier products [Tick] move with the times as far as what people understand as healthy ... making sure that it’s still a true reflection of what’s seen as healthy, well I guess is a key thing that I would want to make sure is happening.’
When interviewed, this manufacturer was reducing added sugar in its dairy products in response to scientific evidence and media-driven consumer demands. The interviewee questioned why low-fat yoghurt with added sugar could get the Tick, while traditional Greek yoghurt with no added sugar and minimal additives could not.
Perceptions of Tick as a marketing strategy
All four manufacturers believed the Tick logo was an iconic symbol of ‘health’ and simple for consumers to understand and use to identify healthier products. However, they were unaware if these perceived marketing benefits translated into increased sales (Fig. 1). They wanted the Tick Programme to provide evidence that the Tick was a purchase driver to inform future product development and marketing decisions.
Company 1 believed Tick endorsement was more effective as a purchase driver for products with variable nutrient content (e.g. snack foods) than for easily recognised healthier choices (e.g. skimmed v. full-fat milk):
‘So I think that in some category [sic], like spreads, where you do get a huge variation in the amount of fat in the products, or sodium, then that’s quite a driver, you know, the Tick. But for the other ones [bread and milk products], it may not be as great of a driver for consumers to purchase.’
This manufacturer appeared to be transitioning its bread and dairy products from paid Tick endorsement to product-specific health claims. Cost was implied to be a factor in these decisions.
Discussion
Our findings indicate that after 23 years the Tick Programme continues to play an active role in encouraging food manufacturers to develop products with a healthier nutrient profile. Between 2011 and 2013, manufacturers of this small subset of newly licensed Tick products removed 4 million megajoules of energy, 171 tonnes of SFA and TFA, and 4 tonnes of sodium from purchased foods in New Zealand. These results likely underestimate the true impact of the Tick Programme. Participating manufacturers cited Tick as the primary initiative encouraging SFA reduction. However, these findings cannot be attributed exclusively to Tick as other internal and external factors also influenced eligible product development.
Nutritional impact
In the present study, the Tick’s nutritional impact at a population level was influenced more by product sales than nutrient content changes. For example, edible oil spreads had only 26 % less SFA than non-Tick products. Despite late market entry, these eight products were responsible for 56 % of total sales and 63 % of the SFA change. On the other hand, eligible frozen desserts contained 72 % less SFA than non-Tick products. Despite early market entry, they accounted for only 13 % of total sales and 32 % of the SFA change. This finding has both practical and research implications. First, to maximise population impact, the Tick Programme may want to convince manufacturers to reformulate basic, commonly consumed foods in a population( Reference van Raaij, Hendriksen and Verhagen 26 ), focusing on products with highest market share. Second, researchers evaluating FOP-SI programmes may want to assess nutritional impact on the purchased food supply, rather than solely product nutrient changes.
Only one other published study investigated the nutritional impact of a FOP-SI label on multiple nutrients (including SFA and TFA); it measured product nutrient changes. While methodological differences prevent direct comparison of results, Vyth et al. observed similar health-promoting trends with Choices products across seven food categories (including processed meats) reducing energy, SFA, TFA and sodium per 100 g and increasing dietary fibre( Reference Vyth, Steenhuis and Roodenburg 17 ). Similar to Tick frozen desserts, Choices ice creams had about half the energy of standard ice cream( Reference Vyth, Steenhuis and Roodenburg 17 ). The nutrient criteria for both programmes were category-specific and targeted multiple nutrients( 10 , 27 ), which might facilitate the development of healthier food products. Food labelling systems that use one set of criteria for all products provide little incentive for reformulation within food categories( Reference Roodenburg, Popkin and Seidell 28 ).
FOP labelling programmes need to signpost healthier options to consumers. Recently, researchers investigating FOP labelling programmes in Canada (including FOP-SI) concluded that participating products had similar nutrient content to products without a FOP signpost label, so FOP labels did not differentiate healthier options( Reference Emrich, Qi and Cohen 13 ). They considered a 25 % difference in nutrient values to be relevant. In our study, on average, eligible Tick products were at least 25 % lower in energy, SFA, TFA and sodium than similar non-Tick products in the food category with one exception, suggesting they were healthier options. The exception, ready meals, was only 14 % lower in energy (and 20 % lower in SFA) than similar non-Tick options, implying nutrient criteria should be reviewed. When the Ready Meals nutrient criteria are up for review, the nutritional quality of diverse Tick products, and similar non-Tick products (Table 4), should be evaluated in order to assess whether the Tick discriminates healthier options for different types of frozen ready meals. If discrepancies arise, then one solution could be to split this category into two, tailoring nutrient criteria accordingly. Overall (across selected food categories), these findings indicate Tick nutrient criteria may be sufficiently challenging to encourage reformulation and nutritional standards were achieved.
Therefore, the Tick Programme appears to be improving the nutrient content of some foods sold in New Zealand, which in turn may help improve population dietary intakes and health outcomes. However, the Tick’s true impact on health is unknown and needs to be established. A recent modelling study tentatively estimated that if the Tick Programme did not exist, on average, New Zealand adults would consume more SFA (1 g/d; 3·2 % difference), sodium (38 mg/d; 1·1 % difference) and energy (72 kJ/d; 0·8 % difference)( Reference Wilson, Nghiem and Eyles 29 ). At an individual level these findings may seem trivial, but a small effect size on a large population can have a significant public health impact over time.
Manufacturer perceptions of the Tick Programme
Interviewed participants appreciated the Tick nutrient criteria and used them within product development briefs, but a couple of concerns were raised. First, a dairy manufacturer questioned the absence of sugar criteria for Tick products in light of the latest scientific evidence( 30 ) and consumer demands to limit added sugars. This was true at the time of data collection (2014), as an evidence-informed decision in 2001 resulted in Tick’s sugar criteria being replaced with energy criteria( 31 ). On 1 October 2015, the Tick Programme re-introduced sugar criteria for Breakfast Cereals and Nut & Seed Bars( 32 ); the Programme could also consider adding a sugar criterion for Yoghurt & Dairy Desserts and Frozen Desserts. Second, processed meat/poultry manufacturers questioned whether the SFA criteria for their products compromised flavour and thus product sustainability in the marketplace. These findings highlight the importance of annually reviewing nutrient criteria and basing decisions on strong scientific evidence, which the Tick Programme does.
Participating manufacturers viewed the Tick as a valuable part of their marketing strategy. Our findings are consistent with previous research reporting the Tick was perceived as an iconic logo that offered consumers health endorsement at the point of choice( 18 ). However, interviewed manufacturers were unaware of its impact on product sales (cost-effectiveness) and they wanted the Tick Programme to provide this category-specific evidence. It is difficult to establish the unique impact of a FOP signpost label on actual sales due to the influence of other factors (taste, price, packaging)( Reference Smith, Stephen and Dombrow 11 , Reference Vyth, Steenhuis and Brandt 12 ). Nevertheless, the Tick Programme should promote its unique benefits to manufacturers in light of a recently introduced free FOP-SI labelling initiative, the Health Star Rating system. Unique benefits include the NHF’s trusted brand for health information, practicable Tick nutrient criteria for sixty-two food categories, and independent verification of product compliance based on laboratory analyses.
This discussion highlights that the Tick Programme needs to retain its credibility with food manufacturers and consumers. On average, Tick products in the present study appeared to signpost healthier options within a food category, but manufacturer self-selection is a recognised risk of voluntary FOP signpost labelling programmes( Reference Smith, Stephen and Dombrow 11 ). The Tick Programme responded to historic concerns of the Tick’s appearance on healthier versions of mostly processed or ‘eat occasionally’ food products with the introduction of Two Ticks on ‘core foods for a healthy diet’( 33 ). While both logos have purpose, at least one interviewee believed consumers may have more difficulty differentiating healthier alternatives in food categories with greater processing and nutritional variability. Therefore, these consumer information needs could be contributing to the Tick’s appearance on mostly processed food products.
Methodological strengths and challenges
Independent researchers used mixed methods to evaluate the Tick Programme’s nutritional impact on energy, SFA, TFA and sodium, common nutrients for FOP labelling programmes. A robust study design allowed 94 % of eligible products to be analysed, despite incomplete product information from six manufacturers. Furthermore, NHF-commissioned independent laboratory reports, based on an average of two or three different product batches, were used to evaluate the nutrient content of Tick products.
Our results may underestimate the genuine impact of the Tick Programme during this time period. First, only forty-five of over 1100 licensed Tick products were analysed. Three Tick food categories contributing significant SFA to the New Zealand diet (Milk, Plain Meat and Plain Poultry) were unavailable for selection (see ‘Methods’ section). Second, in addition to excluding Tick products licensed pre-2011, other products may have met the criteria (or close to it) but did not (or could not) register with the Tick Programme, so positive flow-on effects were unaccounted for (e.g. use of Tick-approved ingredients in other products). Lastly, sales were over three partial years and limited to products sold in domestic-sized packages. Fifteen years ago, Young and Swinburn estimated Tick product sales to the food-service sector would have contributed an additional ~10 % to the sales volume in their study( Reference Young and Swinburn 14 ).
Other factors possibly influencing the accuracy of results were the use of manufacturer self-reported data, surrogate supermarket sales data for twelve products and surrogate pre-reformulation nutrient data for two products. Small nutrient changes between laboratory reports could reflect variation between product batches or analytical methods, rather than reformulation efforts. It would be easier to evaluate the Tick Programme if manufacturers routinely provided the NHF with baseline nutrient values (prior to reformulation) and annual sales data (kg) for Tick-licensed products. Second, the present study relied on nutrient information panel data for non-Tick product comparisons and baseline proxies for new products. In cases where Tick nutrients were not legally required on nutrient information panels (TFA, fibre, calcium), analyses were limited to food categories with sufficient data; fibre could not be evaluated. Finally, qualitative findings were based on one or two brief interviews with six representatives from four manufacturers. They represent the opinion of the interviewees at the time of the interview and cannot be extrapolated to represent the views of others.
Conclusion
This limited snapshot of the Tick Programme suggests it is encouraging food manufacturers to develop products with a healthier nutrient profile and this is having a positive nutritional impact on the purchased food supply in New Zealand. Over time, these food supply changes are likely to influence population nutrient intakes and may contribute to reducing CVD risk in New Zealand.
On average, this subset of Tick products had less energy, SFA, TFA and sodium than similar non-Tick products in the food category, implying the Tick signposts healthier options to consumers, but a more comprehensive evaluation across all food categories is needed. The Tick Programme should continue to use robust scientific evidence, including results from the current study, to routinely evaluate and adapt Tick nutrient criteria. Our findings suggest some dairy manufacturers may welcome re-introduction of Tick sugar criteria. Research evaluating to what extent the Tick increases sales within specific food categories might encourage additional manufacturers of high sales volume products to participate.
Acknowledgements
Acknowledgements: The authors gratefully acknowledge contributions from the National Heart Foundation of New Zealand’s Tick team, Deborah Sue, Sarah Goonan and Rebecca McLean. They advised on study design and/or facilitated data collection. The authors also appreciate valuable contributions made by participating food manufacturers and Dr Alex Chisholm. Financial support: The Department of Human Nutrition, University of Otago financed this study. The National Heart Foundation of New Zealand supported two researchers on-site over a 9-month period (R.K.T., S.X.N.); they had no role in data analysis or writing this article. A University of Otago Postgraduate Publishing Bursary (R.K.T., Master’s) supported the preparation of this manuscript. Conflict of interest: None. Authorship: L.A.M. formulated the research questions in consultation with R.K.T.; all authors contributed to the study design; R.K.T. collected the data with support from S.X.N.; S.X.N. conducted two interviews; R.K.T. and L.A.M. analysed the data and wrote the manuscript. All authors contributed to and approved the final manuscript. Ethics of human subject participation: This study was conducted according to the guidelines laid down in the Declaration of Helsinki and all procedures involving human subjects were approved by the University of Otago Human Ethics Committee (D14/087, revision approved 25 July 2014). Written informed consent was obtained from all participants.


