

I. INTRODUCTION
Social rhythms are regular temporal patterns of social activities, such as work, school, recreation, and sleep, and are relevant to mood [Reference Frank, Swartz and Kupfer1]. In previous studies, individuals with stable social rhythms reported lower psychological distress [Reference Van Tienoven, Minnen, Daniels, Weenas, Raaijmakers and Glorieux2] and higher emotional well-being [Reference Cai, Zhu, Lin, Zhang and Margraf3] than those with disrupted social rhythms. Conversely, individuals with disrupted social rhythms exhibited more depressive and anxious symptoms than those with stable social rhythms [Reference Margraf, Lavallee, Zhang and Schneider4]. The experience of a disrupted social rhythm also increased the risks of the onset of bipolar disorders [Reference Malkoff-Schwartz5]. Moreover, individuals with major depressive disorders experienced higher disruption of social rhythm than those without the disorders [Reference Lieverse, de Vries, Hoogendoorn, Smit and Hoogendijk6]. These findings indicate that a relationship between social rhythm and emotional disturbance exists.
Interpersonal and social rhythm therapy (IPSRT) is a psychotherapy for regulating social rhythms of people with mood disorders [Reference Frank, Swartz and Kupfer1]. Many studies have reported that IPSRT effectively improves depressive and manic episodes in individuals [Reference Inder7]. Furthermore, IPSRT prevents the relapse of manic episodes [Reference Frank8]. Meta-analysis of IPSRT confirmed that it is also effective at reducing relapse risks of bipolar disorders [Reference Scott, Colom and Vieta9]. These findings indicate that regulation of social rhythms encourages individuals to experience calm moods [Reference Frank, Swartz and Kupfer1].
Although IPSRT has been effective for mood disorders, the measurement of social rhythms, the key concept of IPSRT, had a bias problem. In many previous studies, participants' diaries [Reference Van Tienoven, Minnen, Daniels, Weenas, Raaijmakers and Glorieux2, Reference Lieverse, de Vries, Hoogendoorn, Smit and Hoogendijk6] and questionnaires [Reference Cai, Zhu, Lin, Zhang and Margraf3, Reference Margraf, Lavallee, Zhang and Schneider4] were used to measure their social rhythms. Thus, the studies suffered from the subjective bias of these sources of information. Although interviews conducted by experts can reduce the bias [Reference Malkoff-Schwartz5], these types of interviews require time and thereby increase costs. Hence, they cannot be utilized in clinical settings.
To solve the aforementioned problem, we propose to measure social rhythms via social media use. Recent studies in social media analysis showed that temporal patterns of social media use reflect social rhythms. For example, temporal patterns of social media use were relevant to sleep–wake cycles [Reference Scheffler and Kyba10]. Furthermore, the patterns reflected the time difference between regions and difference of activity between weekends and weekdays [Reference Leypunskiy11]. Another study reported that the lack of sleep for social media users on a particular day increased their probability of tweeting negative emotions on the next day [Reference Murnane, Abdullah, Matthews, Choudhury and Gay12]. These findings indicate that the temporal patterns of social media use are relevant to social rhythms.
Furthermore, social media use has been determined as relevant to psychiatric symptoms. Studies have indicated that the excessive use of social media is related to the lack of sleep [Reference Sampasa-Kanyinga, Hamilton and Chaput13, Reference Scott, Biello and Woods14]. Moreover, several users experienced depressive and anxious symptoms through social media use [Reference Brailovskaia, Schillack and Margraf15]. Additionally, linguistic features in social media have been related to depressive symptoms [Reference Chancellor and De Choudhury16]. These findings indicate that the regular patterns of social media use are related to users' psychiatric symptoms.
Based on these findings, temporal patterns of social media use can be considered as relevant to social rhythms and psychiatric symptoms. We hypothesized that individuals with many psychiatric symptoms can potentially experience more disrupted social rhythms than those with few symptoms. To validate this hypothesis, we measured the social support levels of individuals with psychiatric symptoms, as these levels exhibit a negative relationship with psychiatric symptoms [Reference Cohen and Wills17, Reference Reblin and Uchino18]. Moreover, given that social rhythms are regular temporal patterns, the social rhythms can be transformed via signal processing methods such as fast-Fourier transform (FFT), short-term Fourier transform (STFT), discrete wavelet transform (DWT) [Reference Nason and Silverman19], and fast Chirplet transform (FCT) [Reference Lu, Oruklu and Saniie20]. Furthermore, we determined the transform with the highest accuracy for predicting psychiatric symptoms from social rhythms.
II. METHODS
A) Source of data
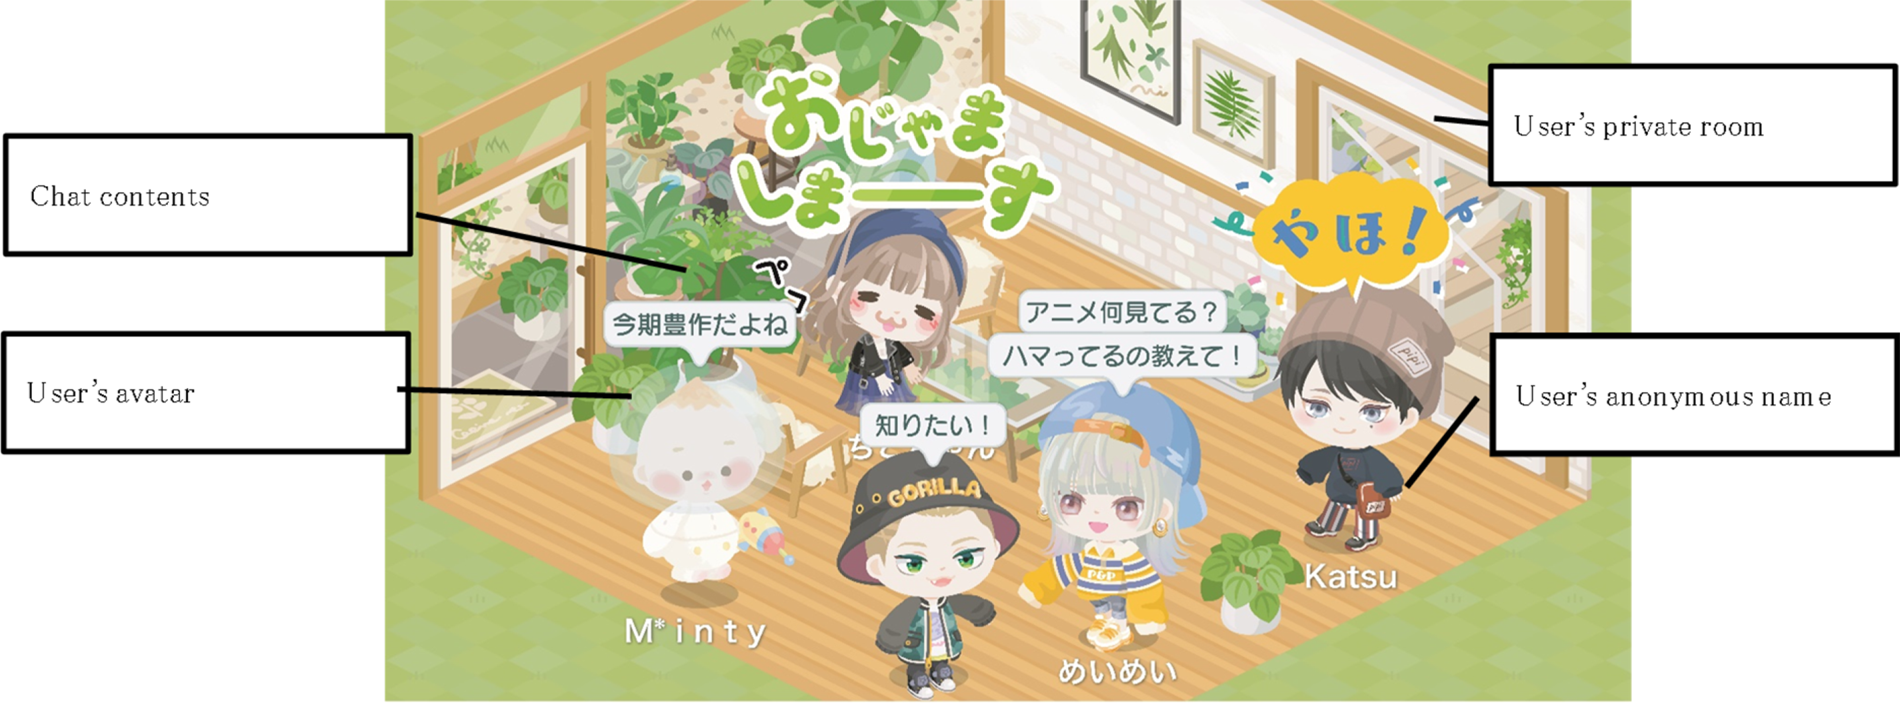
Participants were sampled from a two-wave survey of the Pigg Party, a popular Japanese avatar community application, which has avatars, pseudonym names, and private rooms [Reference Takano and Tsunoda21] (Fig. 1). The first-wave survey was conducted from April 26 to May 2, 2020, and the second-wave survey was conducted from June 1 to 7, 2020. Similarly as in a previous study [Reference Yokotani and Takano22, Reference Yokotani and Takano23], we analyzed 3504 participants in the first wave, who agreed to the study and completed our questionnaire survey without any missing data. Participants with missing data were excluded [Reference Yokotani and Takano22, Reference Yokotani and Takano23]. Similarly, we analyzed 658 participants in the second wave who completed the first and second wave surveys without any missing data. Each participant received 100 Japanese yen of virtual currency as a reward for their cooperation. Their ages were in the range of 23–25 years on average (Table 1) and most participants were cisgender females, who were born and identified themselves as females and were in relationships with male partners (50.9 and 77.2% in the first and second waves, respectively).
Example of online chatting with friends in a Pigg Party room.
Note: Each room has one owner. Room owners can freely change their room decorations. Each avatar corresponds to an individual user who can freely change his/her appearance. Furthermore, the user's pseudonym name is denoted at the foot of the avatar.
Basic statistics of participants

Notes: GHQ: General Health Questionnaire. GHQ0 indicates no psychiatric symptoms, whereas GHQ12 indicates 12 psychiatric symptoms. PES: perceived emotional support. PES1 indicates low emotional support level, whereas PES4 indicates high emotional support level in Pigg party.
B) Outcomes
To evaluate psychiatric symptoms, we used the General Health Questionnaire-12 (GHQ) [Reference Goldberg24], Japanese version [Reference Doi and Minowa25]. This questionnaire comprises 12 questions that elicit information on psychiatric symptoms such as concentration and anxiety. The items on the questionnaire are rated on a four-point scale. The rating method of this questionnaire is 0-0-1-1 [Reference Doi and Minowa25]. Participants were categorized into GHQ0, GHQ1, …, GHQ12 based on their scores. Higher scores indicated more psychiatric symptoms. Approximately 20% of participants did not exhibit any psychiatric symptoms [GHQ0] (Table 1).
To evaluate perceived social support (PES) in Pigg Party, we used the PES scale [Reference Fukuoka and Hashimoto26] with minor revisions for the Pigg Party users [Reference Yokotani and Takano23]. The scale involved six emotional support items such as “Cheer up when I am depressed.” The responses to these items were scored using a five-point scale ranging from (1) “the friend in the Pigg Party would never do it” to (5) “the friend in the Pigg Party would likely do it.” Specifically, participants with scores between 1 and 1.99, 2 and 2.99, 3 and 3.99, and 4.00 and 5.00 were categorized into PES1, PES2, PES3, and PES4, respectively. Higher scores indicate higher social support. Approximately 70% of participants received emotional support from the Pigg Party (Table 1).
C) Predictors
To evaluate the communication frequency of the participants in the Pigg Party, we sampled the time stamps of their chats using the administrator role. The Pigg Party has two types of personal chat channels: private and group. In the private channel, the communication is limited to two users, and the contents of the chat are only disclosed to the two users (Fig. 2). The group channel is similar to the private channel, but it can involve three or more users, and the contents of the chat are disclosed to the users of the group (Fig. 2). Time stamps of private and group chats from April 1 to 30 and from May 1 to 31 were collected for the first- and second-wave participants, respectively.
Examples of private and group chat channels in the Pigg Party.

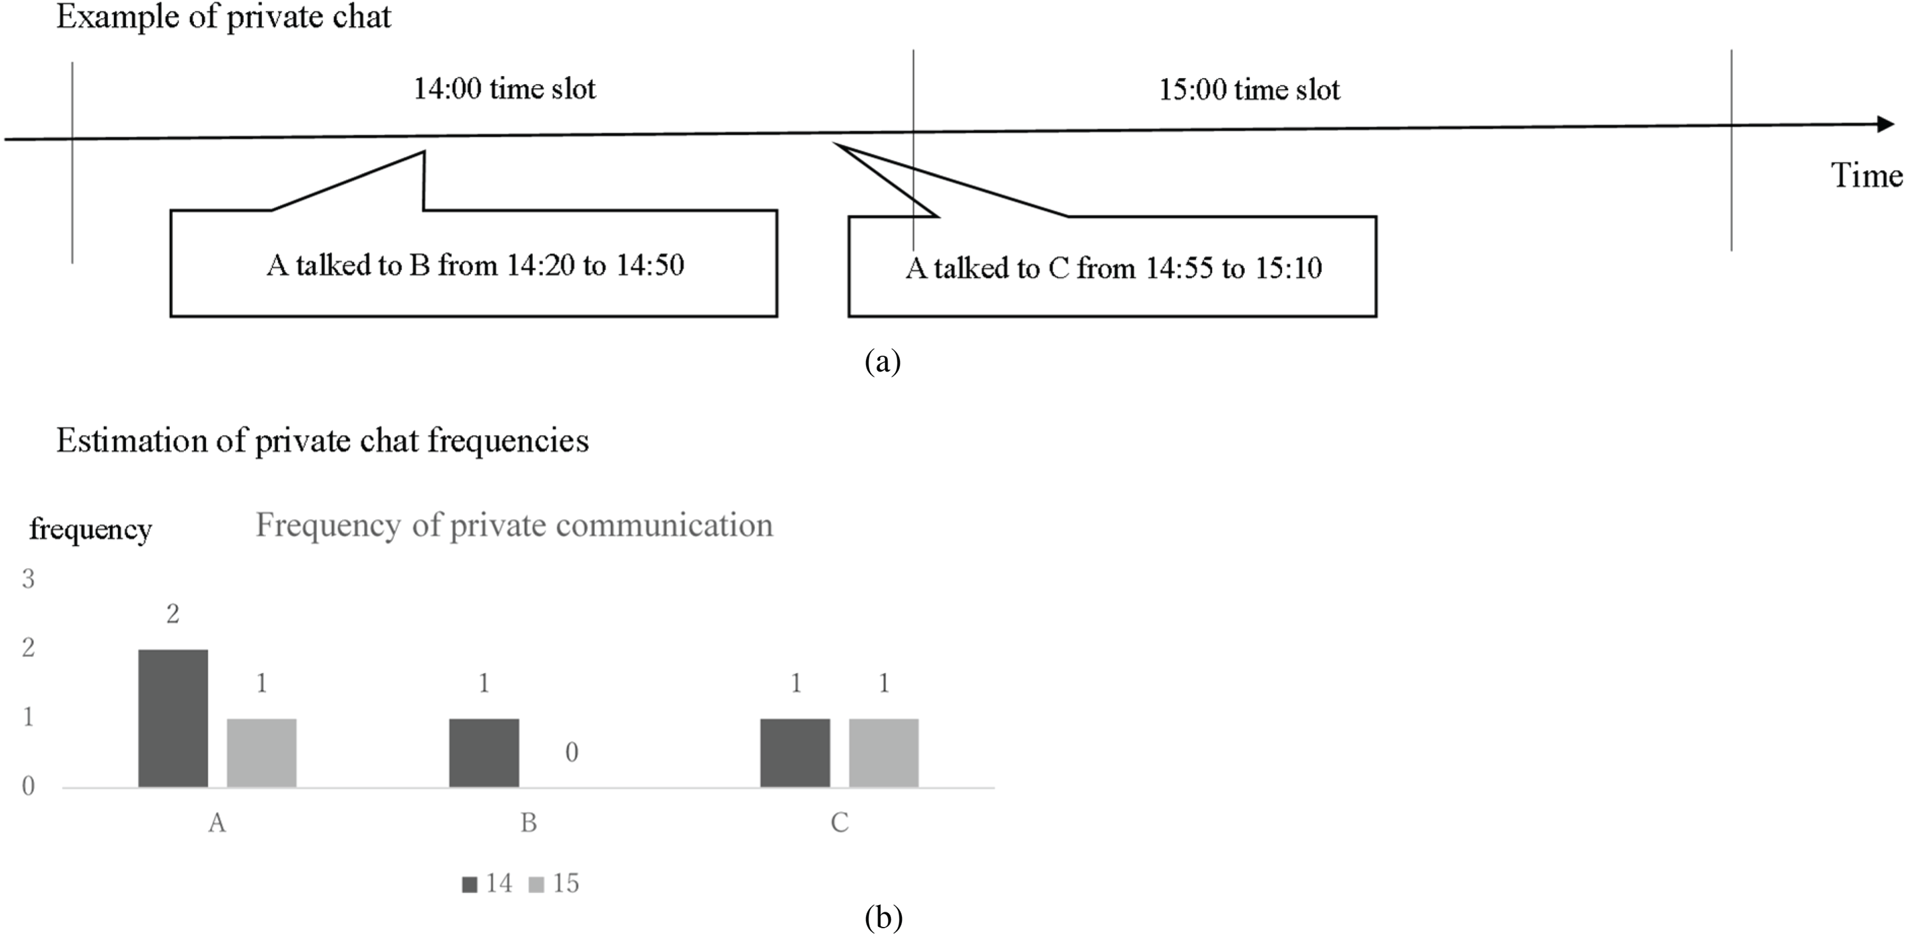
Private and group chat frequencies corresponded to the number of direct communication paths between two users in a 1-h slot (Fig. 3(a)). For example, user A privately chats with user B from 14:20 to 14:50 and privately chats with user C from 14:55 to 15:10. Hence, user A has two direct communication paths in the 14:00 time slot, whereas users B and C have one direct path. Furthermore, users A and C have one direct path in the 15:00 time slot, whereas user B does not have any in this time slot. Hence, the frequencies of private communication of users A, B, and C in the 14:00 time slot are 2, 1, and 1, respectively (Fig. 3(b)). Similarly, the frequencies of private communication of users A, B, and C in the 15:00 time slot are 1, 0, and 1, respectively (Fig. 3(b)). We used the same method to estimate the frequency of group communication.
Example of the estimation of private chat frequencies.
The frequency of group communication was transformed into 168 time frames over 24 h/week and displayed as a probability distribution in these time frames (hereafter referred to as communication time distribution) (Fig. 4). Similarly, the frequency of private communication was transformed and displayed as a communication time distribution. The frequencies of group and private chats were approximately 9 and 3 times per day on average, respectively (Table 1).
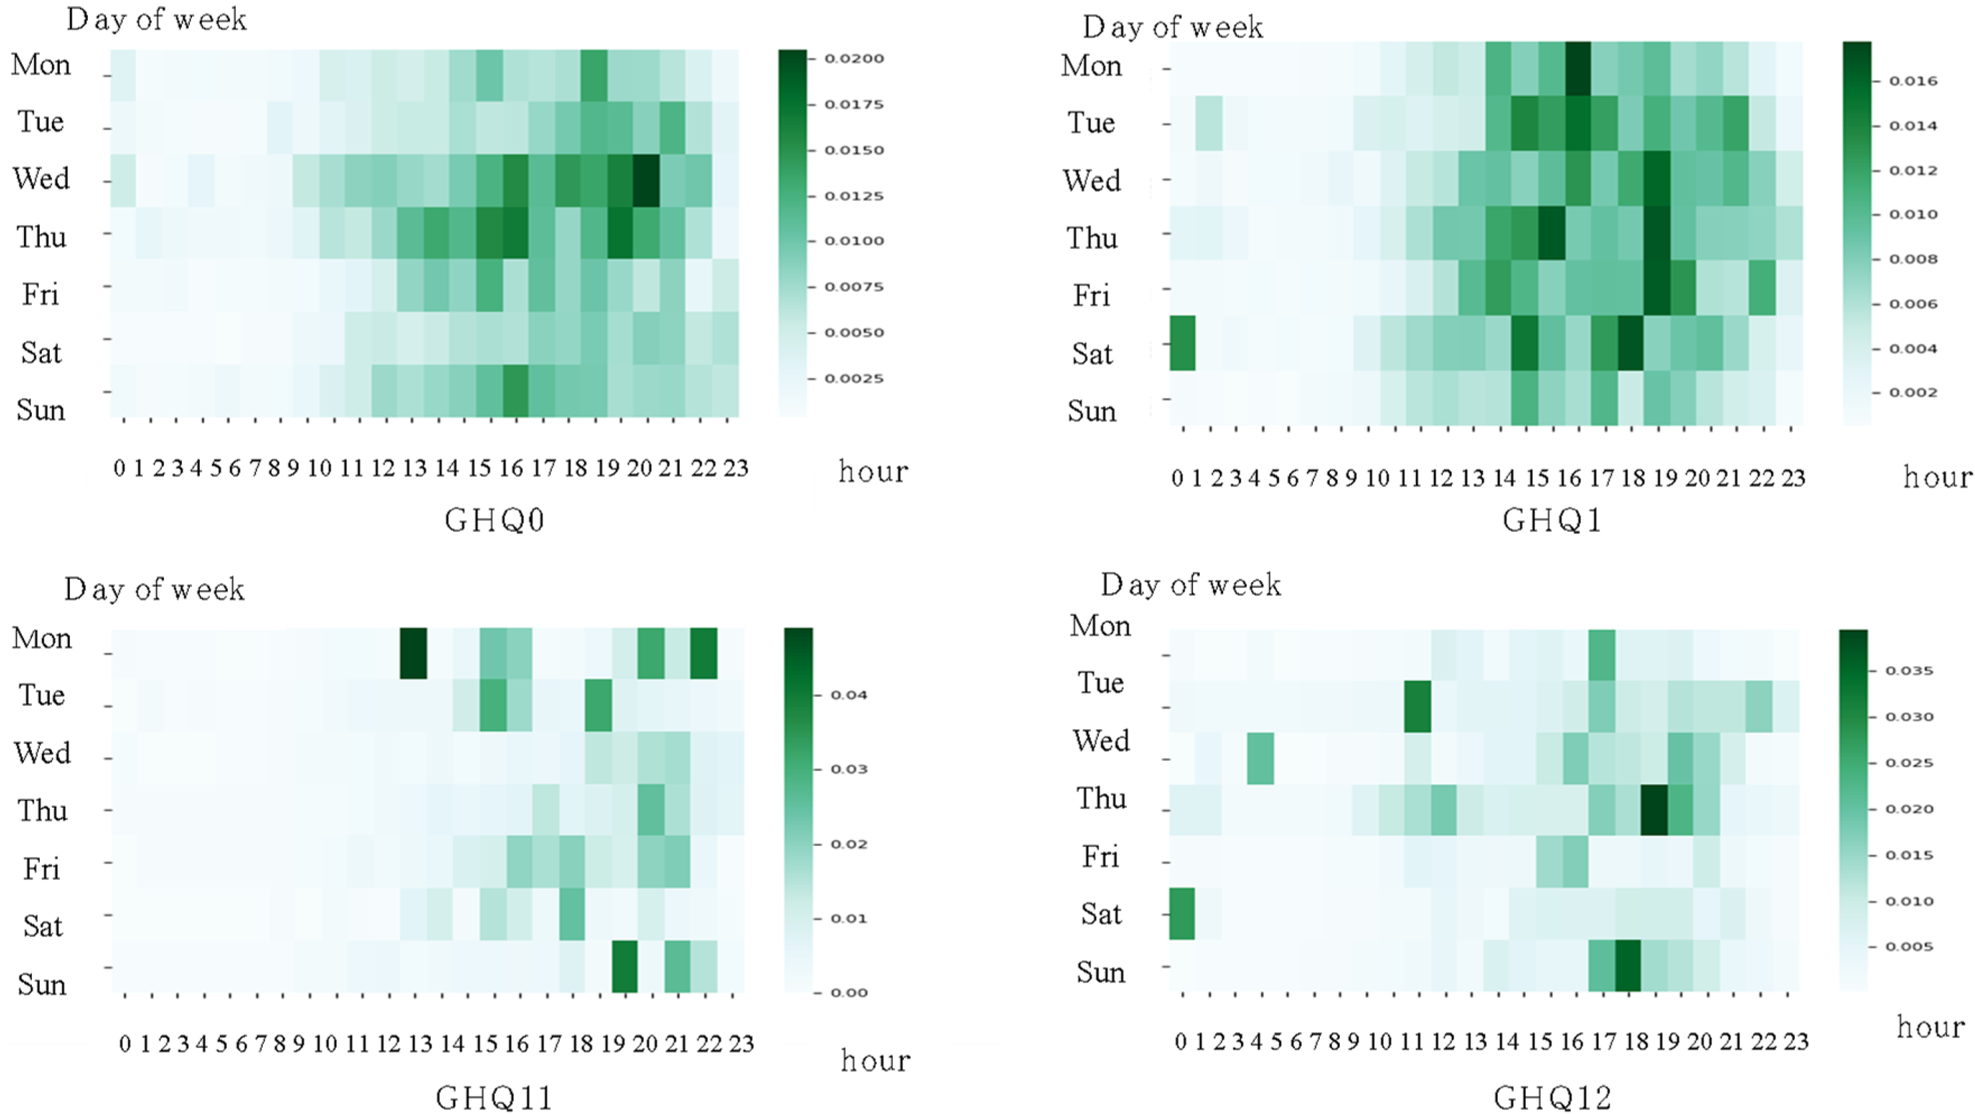
Group communication time distributions among users with psychiatric symptoms.
Notes: There are 13 classes of GHQ, from 0 to 12, but only the top two and bottom two are shown in the figure.
D) Statistics
To estimate the social rhythm, the peak value of the autocorrelation function was used. The peak value of the autocorrelation function is frequently used in speech studies to estimate the fundamental frequency [Reference Zhao, O'Shaughnessy and Minh-Quang27]. To clarify cyclic errors, window or smoothing functions were not used in the autocorrelation function used in this study:
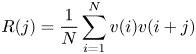
In equation (1), V(i) is a signal at i time point and V(i + j) is a signal at i + j time points. When R(k − 1) is lower than R(k) and R(k) is higher than R(k + 1), R(k) is considered as a peak value.
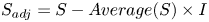
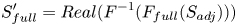
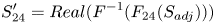
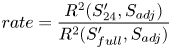
To estimate the explanation rate of a 24-h cycle, we used time-domain linear regression analysis [Reference Shumway, Stoffer, Shumway and Stoffer28]. In equation (2), S is a 168-dimensional vector of communication frequencies. Average is a function that returns average of a vector. I is a vector with 168 elements, all of which are 1. Hence, Sadj is a 168-dimensional vector of communication frequencies minus its mean. In equation (3), F and F −1 are discrete Fourier transformation and inverse discrete Fourier transformation, respectively. Ffull involves all valid 84 frequencies. Real is a function that only returns real numbers. Hence, S′full is the signal simply recovered by the Fourier transform and Fourier inverse transform. In equation (4), F 24 involves only a 24-h frequency (frequency is 0.4166) and the other frequencies are 0. Hence, S′ 24 is the signal expressed only in a 24-h cycle. In equation (5), R 2 is a function that returns the coefficient of determination. The denominator and numerator show the coefficients of determination for S′full and S′ 24, respectively. Hence, rate represents the explanation rate of a 24-h cycle ranging between 0 and 1. If the sum of S is 0, we remove these data from the analysis of the explanation rate, because these data always return rate as 1.0 and overestimate the rate:
For transformation of communication time frequencies, we used five transformations. First, by dividing the individual frequencies by the sum of all frequencies, the individual frequencies were expressed as probabilities (probability, Fig. 4). The number of time points was 168 (7 days × 24 h) and the number of communication channels was two (private and group). Hence, the total number of features of raw data and probability was 336. Second, we used FFT. Given that FFT requires the time points to be as a power of 2, we repeated the first 88 time points, and thus used a total of 256 time points (28). Based on the sampling theorem, FFT extracted 128 features with one intercept for both private and group communication times. Hence, the total number of features of FFT was 258. Third, we used STFT on the aforementioned 256 time points. We used a window size of 24 without overlap because many studies indicated that 24-h cycles were prevalent in social media use [Reference Leypunskiy11, Reference Murnane, Abdullah, Matthews, Choudhury and Gay12]. We obtained 598 magnitude features via STFT. Fourth, we used DWT on the aforementioned 256 time points, and obtained 256 approximation coefficients and 256 detail coefficients. Fifth, we used the FCT. We set the longest duration of Chirplet as 24 and obtained 200 features.
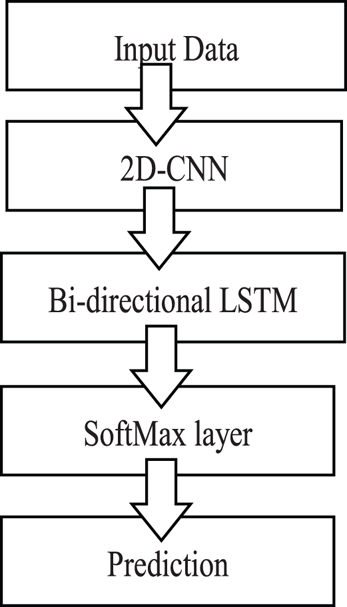
The neural architecture of the psychiatric symptom classifier involved a two-dimensional convolutional neural network [Reference Chen, He, Yang and Zhang29] and bidirectional long short-term memory (LSTM) frame [Reference Graves and Schmidhuber30] (Fig. 5). As the dimensionalities of the input data were different, all the data were expanded to 1000 dimensions and then stored as two-dimensional arrays. The two-dimensional arrays were input into the two-dimensional convolutional layer, which summarizes features in the near region. To summarize features in the remote region, we also used a bidirectional LSTM layer. The results of the bidirectional LSTM were in an array containing a temporal order and were compressed into a one-dimensional array matching the number of prediction outputs. The architecture also involved two drop out layers and L2 regularization to avoid overfitting [Reference Srivastava, Hinton, Krizhevsky, Sutskever and Salakhutdinov31]. Details of the architecture are provided in Table 2.
Neural architecture of the psychiatric symptom classifier. 2D-CNN, 2-dimensional convolutional neural network; LSTM, long-short term memory.
Details of the neural architecture of the GHQ symptom classifier
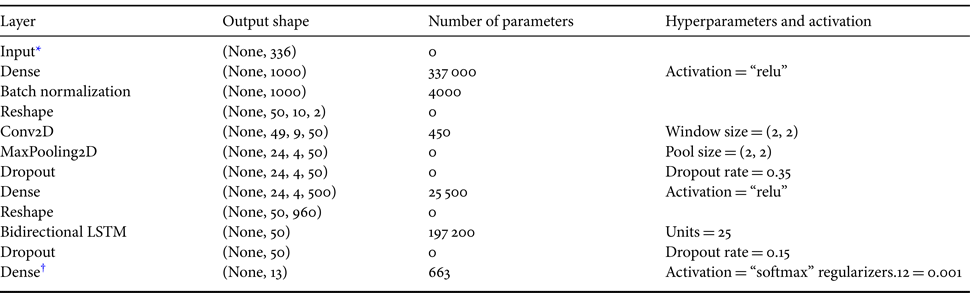
Note: None in output shape means sample size.
* The number of input dimensions was changed according to the transformation model.
† The number of output dimensions was changed according to the prediction outcomes. The optimizer was the adaptive moment estimation algorithm (Adam). Learning rate: 0.001, beta_1: 0.9, beta_2: 0.999, epsilon: 1 × 10⁻⁷, and decay: 0.0.
Conv, convolutional; 2D, two-dimensional; LSTM, long short-term memory.
The data from first-wave participants were used as training data, and the data from second-wave participants were used as testing data. Training data were unbalanced by the number of psychiatric symptoms; thus, we used the synthetic minority over-sampling technique [Reference Chawla, Bowyer, Hall and Kegelmeyer32]. Although the early stopping function was involved, the classifier trained up to 20 epochs, which corresponds to the maximum number of epochs for all six types of inputs.
To show statistically significant differences of accuracies between trained model and random classifiers, we used 1000 random classifiers. Random classifiers are models that randomly predict the label of the test data based on the distribution of labels in the training data. Through the 1000 random classifiers, we obtained 1000 accuracies. These 1000 accuracies were considered to be independent of each other and normally distributed [Reference Yokotani and Takano22, Reference Bond33]. Therefore, it was possible to estimate a confidence interval based on the normal distribution for these 1000 accuracies. If the accuracy of the trained model was higher than the upper limits of the confidence interval, then it was significantly higher than the accuracy of the random classifier.
III. RESULTS
A) Comparison of social rhythms based on group communication among individuals with different psychiatric symptoms
Figure 4 shows group communication time distributions. Individuals with few psychiatric symptoms (GHQ0 and 1) were active in afternoon periods, such as from 13:00 to 22:00, and inactive from midnight to morning, such as from 1:00 to 7:00. These figures indicate that their active and inactive times were fixed for different days. Conversely, group communication time distributions of individuals with many psychiatric symptoms (GHQ11 and 12) were sparse. They ranged from being active at a time point in a day and subsequently inactive at the same time point during the next day. The figures indicate that active and inactive times of individuals were flexible for different days.
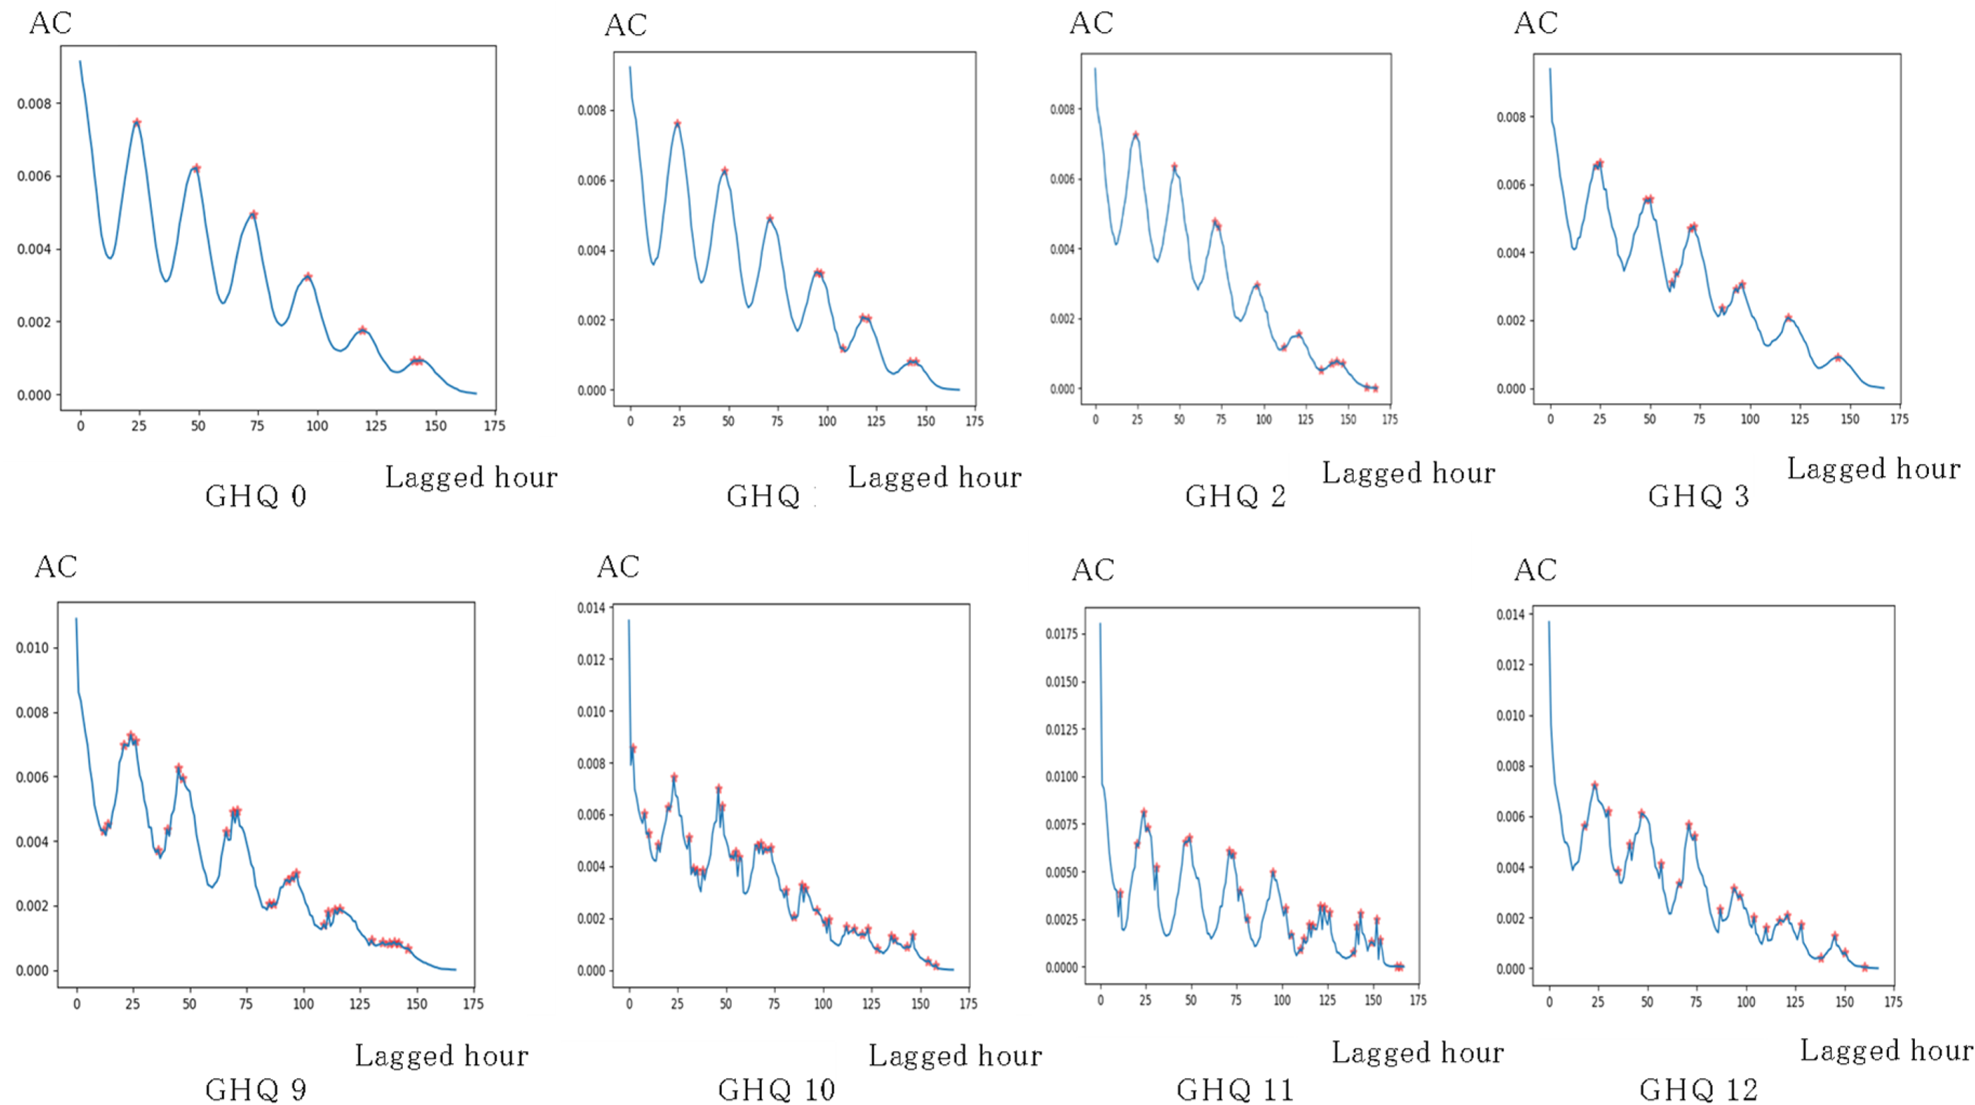
Furthermore, autocorrelations of group communication confirmed the aforementioned findings (Fig. 6). The cycle of autocorrelation of GHQ0 was stable in a 24-h cycle. Increases in the number of psychiatric symptoms disrupted the cycles of autocorrelations and resulted in many peaks in a day. Autocorrelations among GHQ9, 10, 11, and 12 exhibited more peaks in a day than those among GHQ0, 1, 2, and 3. This indicated that group communication cycles of GHQ9, 10, 11, and 12 did not correspond to a 24-h cycle and instead fluctuated to cycles corresponding to a few hours. We compared explanation rates of 24-h cycles between these groups to confirm this tendency, and observed no significant differences (F (12,1319) = 1.228, p = 0.258).
Comparison of social rhythm measured via group communication considering the number of psychiatric symptoms.
Notes: GHQ: General Health Questionnaire. GHQ0 denotes no psychiatric symptoms, whereas GHQ12 denotes 12 psychiatric symptoms. AC means autocorrelation coefficient. There are 13 classes of GHQ (General Health Questionnaire), from 0 to 12, but only the top four and bottom four are shown in the figure.
B) Comparison of social rhythms based on private communication among individuals with different psychiatric symptoms
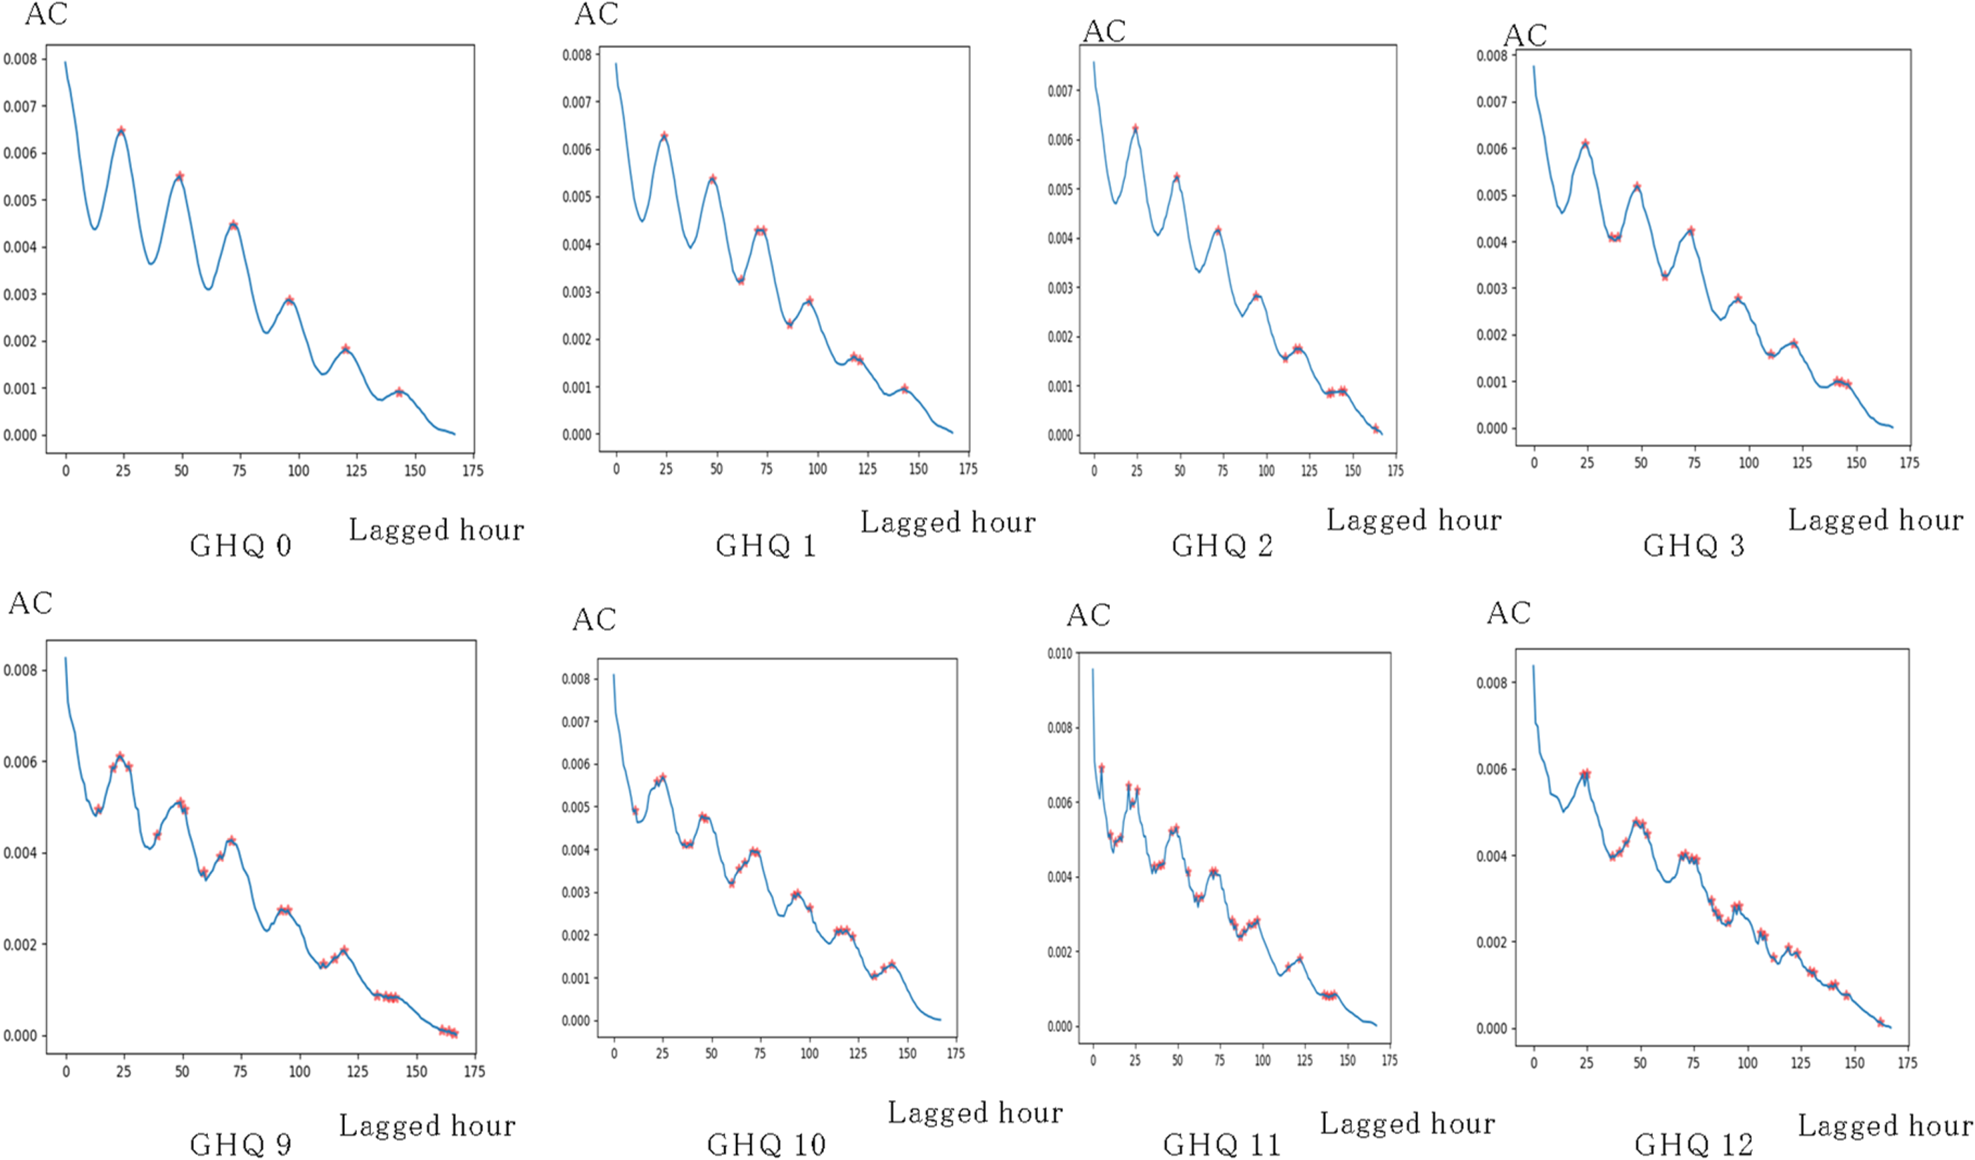
Figure 7 shows private communication time distributions. Similarly as in the group communication time distributions, active and inactive time periods were fixed for different days among individuals with few psychiatric symptoms (GHQ0 and 1), whereas active time periods were flexible for different days among individuals with many psychiatric symptoms (GHQ11 and 12). Furthermore, autocorrelations for private communication confirmed the aforementioned findings (Fig. 8). Autocorrelations for private communication were stable in the 24-h cycle among individuals with GHQ0 and 1, and flexible among individuals with GHQ11 and 12. This was in agreement with the findings of group communication time distribution, wherein individuals with many psychiatric symptoms exhibited more peaks during private communication than individuals with few psychiatric symptoms. We compared explanation rates of 24-h cycles between these groups to confirm this tendency, and observed no significant differences (F (12,2459) = 0.653, p = 0.798).
Private communication time distributions considering the number of psychiatric symptoms.
Notes: GHQ: General Health Questionnaire. GHQ0 denotes no psychiatric symptoms whereas GHQ12 denotes 12 psychiatric symptoms. There are 13 classes of GHQ, from 0 to 12, but only the top two and bottom two are shown in the figure.

Comparison of social rhythms measured via private communication among individuals with psychiatric symptoms.
Notes: AC means autocorrelation coefficient. GHQ: General Health Questionnaire. GHQ0 denotes no psychiatric symptoms whereas GHQ12 denotes 12 psychiatric symptoms. There are 13 classes of GHQ, from 0 to 12, but only the top four and bottom four are shown in the figure.
C) Comparison of social rhythms based on group and private communications among individuals with different perceived emotional support
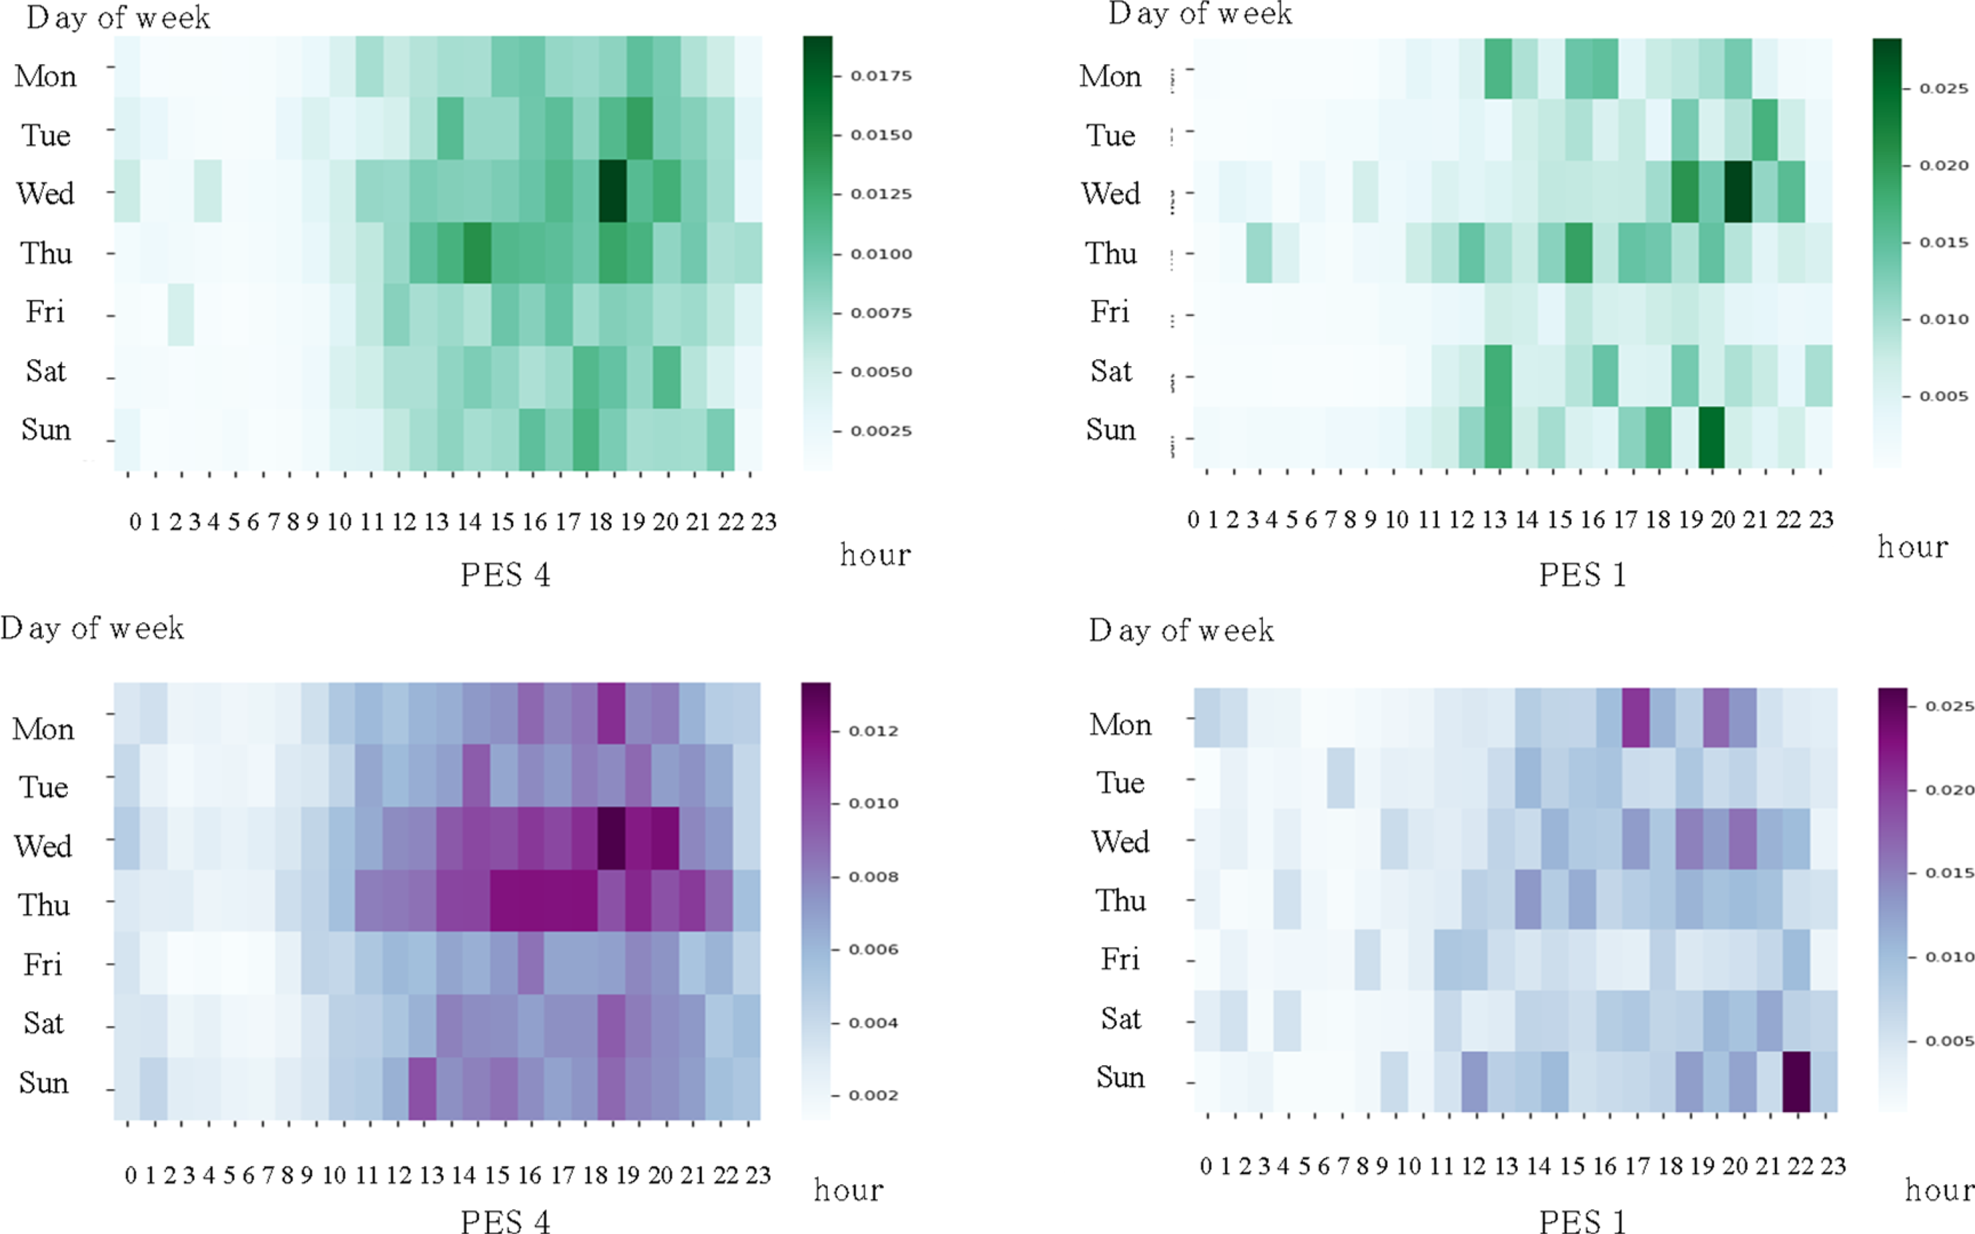
To validate the relation between social rhythms and psychiatric symptoms, we also examined the relation between social rhythms and PES (Fig. 9). As expected, individuals who perceived a high emotional support (PES4) level in Pigg Party were active during daytime and inactive at midnight, whereas those who received low emotional support in Pigg Party changed their active/inactive times every day. Furthermore, autocorrelations among these communications corroborated the aforementioned findings (Fig. 10). Individuals with high emotional support levels were stable in the 24-h cycle in both group and private communications, whereas those with low emotional support (PES1) were unstable and exhibited many peaks during 24 h. To confirm this tendency, we compared explanation rates of 24-h cycles between these groups. We found that explanation rates of both private and group communications were significantly different between these groups (private: F (3,2468) = 19.627, p < 0.001, group: F (3,1328) = 4.619, p = 0.003). Figure 11 also indicates that those with high emotional support level (PES4) had higher explanation rates in a 24-h cycle than those with low emotional support level (PES1).
Group and private communication time distributions with respect to PES levels.
Notes: Green distributions denote group communication whereas blue distributions denote private communication. PES, perceived emotional support. PES1 indicates low emotional support level, whereas PES4 indicates high emotional support level in Pigg party.
Comparison of social rhythms measured via group and private communications with respect to PES levels.
Notes: The upper lines denote social rhythms measured via group communication, whereas lower lines denote social rhythms measured via private communication. AC means autocorrelation coefficient. PES, perceived emotional support. PES1 indicates low emotional support level, whereas PES4 indicates high emotional support level in Pigg party.

Comparison of explanation rates of 24-h cycles with respect to PES levels.
Notes: PES: perceived emotional support. PES1 indicates low emotional support level, whereas PES4 indicates high emotional support level in Pigg party.

D) Comparison of different transformations to predict psychiatric symptoms and perceived emotional support levels via social rhythms
To examine the optimal transformation for social rhythms, we compared classification accuracies of GHQ symptoms and PES levels via one non-transformed and five transformed inputs, respectively, as shown in Table 3. Although all accuracies significantly outperformed the accuracies of random classifiers, raw data and probability transformed data indicated worse accuracies in the prediction of GHQ symptoms and PES levels. The findings revealed that transformations are required for preprocessing of communication time distribution data. Specifically, FCT exhibited optimal predictive accuracy for GHQ symptoms and PES levels among all the transformations used. Other transformations, such as FFT, STFT, and DWT, exhibited overfitting accuracy score in training, whereas FCT did not. The findings indicate that FCT can reduce the risk of overfitting.
Comparison of classification performance among data transformations
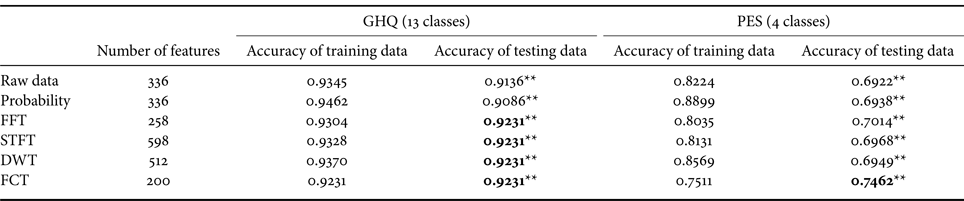
FFT, fast Fourier transform; STFT, short-time Fourier transform; DWT, discrete wavelet transform; FCT, fast Chirplet transform.
** p < 0.001. The mean accuracies of 1000 random classifiers on GHQ symptoms and PES levels were 0.02938 and 0.105599, respectively. The confidence interval of accuracies of random classifiers on GHQ symptoms at 99% ranged between 0.028843 and 0.029917. The confidence interval of accuracies of random classifiers on PES levels at 99% ranged between 0.104619 and 0.106579. All accuracies in our trained model significantly outperformed the accuracies of random classifiers.
IV. DISCUSSION
Similarly as previous findings in social media analysis [Reference Scheffler and Kyba10–Reference Murnane, Abdullah, Matthews, Choudhury and Gay12], the results indicated that social rhythm can be measured via social media use. Specifically, peaks of autocorrelations indicated stable and disrupted social rhythm of people with few and many psychiatric symptoms, respectively. Although many studies focused on the relevance between volume/contents of social media usage and short sleep [Reference Sampasa-Kanyinga, Hamilton and Chaput13–Reference Chancellor and De Choudhury16], our findings indicate that the temporal patterns of social media usage are related to short sleep. Measurement of social rhythm via social media use can validate the relevance between social rhythms and mood disorders [Reference Van Tienoven, Minnen, Daniels, Weenas, Raaijmakers and Glorieux2–Reference Lieverse, de Vries, Hoogendoorn, Smit and Hoogendijk6] and the effects of IPSRT [Reference Frank, Swartz and Kupfer1, Reference Inder7–Reference Scott, Colom and Vieta9].
Our findings also imply that appropriate regular use of social media could improve users' social rhythm and their mental health [Reference Scott, Biello and Woods14]. Previous studies suggested that mental health experts regulate their clients' social rhythm through advise and improved their emotional disturbance [Reference Frank, Swartz and Kupfer1, Reference Inder7, Reference Frank8]. Similarly, administrators of social media might regulate their users' social rhythm through bonus points and improve their emotional disturbance. For example, login bonus points in early morning could encourage users to wake up early, to regulate their social rhythm, and to reduce their emotional disturbance. Evidently, treatment effects of regular use of social media on emotional disturbance would have to be tested in the experimental design, but social media might be a useful platform to treat emotional disturbance.
The results also indicated that FCT corresponds to the optimal transformation for social rhythm. Given that FCT is known to exhibit optimal resolution when signals exhibit time-varying frequencies [Reference Nason and Silverman19, Reference Lu, Oruklu and Saniie20], FCT can grasp time-varying frequencies of individuals with many psychiatric symptoms. Furthermore, a GHQ symptom classifier based on raw data exhibited overfitting problems. This indicates that the classifier based on raw data inaccurately overlearned activities at specific time points as important features of psychiatric symptoms. Conversely, a classifier based on FCT could accurately capture a variety of time-varying frequencies as important features of psychiatric symptoms. This implication is also consistent with many peaks of autocorrelations among individuals with several psychiatric symptoms. The findings indicate that individuals with psychiatric symptoms can exhibit many time-varying frequencies, and entropy of frequency distributions can be associated with their disrupted social rhythms, disrupted sleep, and disrupted emotion.
Our study includes three limitations. First, the test accuracy of PES was always below 0.80 for all the classifiers. This is because PES can be affected by annual conversation as opposed to monthly conversation [Reference Cohen and Wills17, Reference Reblin and Uchino18]. Hence, our training data are potentially too short to estimate PES. Second, the first-wave dataset was sampled at the time of the first “mild lockdown” in Japan [Reference Yamamoto, Uchiumi, Suzuki, Yoshimoto and Murillo-Rodriguez34]. The first mild lockdown ranged from April 7th to May 25th in 2020, which fully covered the first-wave questionnaire survey period (April 26th to May 2nd in 2020). During the mild lockdown, residents in Japan were requested to refrain from going out of their houses and to restrict the use of stores. However, enforceable measures were limited in Japan and those who did not obey these requests received no penalties. Therefore, mild lockdown is a state of lockdown specific to Japan relying on voluntary public cooperation without punishment. Given that mild lockdown can affect participants' psychiatric symptoms and daily activities [Reference Yamamoto, Uchiumi, Suzuki, Yoshimoto and Murillo-Rodriguez34], a yearly dataset in the absence of lockdown should be sampled in a future study. Third, the study was an observational study and did not reveal causal effects from social rhythms on psychiatric symptoms. A future study should include an experimental design involving individuals with mood disorders and groups with and without IPSRT [Reference Frank, Swartz and Kupfer1, Reference Inder7–Reference Scott, Colom and Vieta9].
V. CONCLUSION
The findings corroborated the relationship between disrupted social rhythm and psychiatric symptoms via temporal patterns of social media usage [Reference Frank, Swartz and Kupfer1]. Disruption of social rhythm can be estimated in detail via the frequency transformation approach in signal processing fields [Reference Nason and Silverman19, Reference Lu, Oruklu and Saniie20]. Although frequency transformation and psychiatric symptoms were separately examined in signal processing and clinical psychology fields, respectively, the concept of social rhythm can lead to a new fusion area that integrates the two different methodologies and assists in detailed understanding of human emotion.
Acknowledgement
Part of our datasets was used in previous studies [Reference Yokotani and Takano22, Reference Yokotani and Takano23].
Financial support
This study was funded by a grant from CyberAgent.
Conflict of interest
Kenji Yokotani was funded by a grant from CyberAgent, which runs the Pigg Party. Masanori Takano was also employed by CyberAgent.
Ethical standards
This study was approved by the ethics committee of a national university in Japan. All the procedures were conducted in accordance with the guidelines for studies involving human participants, the ethical standards of the institutional research committee, and the revised 1964 Helsinki Declaration and its later amendments or comparable ethical standards.
Kenji Yokotani received a Doctorate in Clinical Psychology in 2011 from Tohoku University in Japan. He worked as a university faculty member and head of a branch of solution-focused therapy center in Niigata. He is currently based at Tokushima University. His research interests include application of information engineering approaches to study psychological phenomena.
Masanori Takano received a Doctorate in Information Science from Nagoya University in Japan in 2009. He specialized in computational social science and complex system science. After working on the development and operation of smartphone games, he is currently engaged in data analysis and computational social science research for media services at CyberAgent, Inc.


 Open access