

In nutritional epidemiology, the usual dietary intake of individuals is the relevant exposure for investigating diet–disease relationships properly. Usual dietary intake is defined as the long-run average of daily intakes( Reference Nusser, Carriquiry and Dodd 1 ).When compared with long-term, self-report instruments to collect dietary intake, short-term instruments such as 24-h recalls (24HR) and food records are believed to have lower systematic error, usually presenting a lower underestimation of energy and protein intakes( Reference Freedman, Commins and Moler 2 ). Nonetheless, they are highly affected by day-to-day variation – that is, the within-person variation in dietary intake – in that a single collection day is not sufficient to reproduce the usual food intakes. The implications of using information of intake from an instrument with this kind of error (called within-person random error in this case) are a biased estimate of the intake distribution, inflated variance, percentiles severely underestimated and overestimated, and proportions of a population above some cut-off point wrongly estimated( Reference Beaton, Milner and Corey 3 , Reference Dodd, Guenther and Freedman 4 ). Considering that administering several 24HR per individual in large epidemiological studies is difficult because of time consumption, cost and burdensome respondents, statistical methods such as the National Cancer Institute (NCI)( Reference Tooze, Midthune and Dodd 5 ) method and Multiple Source Method (MSM)( Reference Hartig, Haubrock and Knüppel 6 )were developed to remove the within-person random error and to estimate the usual intake when there is a second 24HR for at least a subsample of the study population. In fact, the use of statistical methods to correct percentiles of intake by removing the effect of the within-person variance has been implemented and recommended in many studies. Since 2003, the National Health and Nutrition Examination Survey has collected a replication of the 24HR in a subsample to allow estimation of the usual dietary intake. In Brazil, these methods have been implemented in most of the studies using data from national representative studies( Reference Barbosa, Sichieri and Junger 7 ). Most recently, the WHO supported the use and distribution of Intake Monitoring, Assessment and Planning Program software based on similar statistical models.
Simulation studies have shown good performance of these methods in estimating dietary items that are consumed every day or almost every day by most people (which is the case of energy and most nutrients)( Reference Souverein, Dekkers and Geelen 8 ), but have not always been satisfactory when estimating usual intake of items consumed episodically (which is the case of foods)( Reference Goedhart, van der Voet and Knüppel 9 ). In these studies, data simulation was used to obtain a true dietary intake for each individual, and then used to compare with the estimates from those methods. Although simulation studies can often be considered a good representation of real life, they are used as surrogates of real data. In the dietary intake context, where there is a complex correlation within and between individuals and food items, simulated data may not adequately reproduce a real scenario( Reference Freedman, Guenther and Krebs-Smith 10 ). In this sense, using real data that provide usual dietary intake is preferable to assess the performance of these models. The VIESP study, which stands for ‘intrapersonal variance of dietary intake and bias in nutritional epidemiological studies’ in Portuguese, has measured usual food and nutrient intakes in a sample by administering twenty, non-consecutive 24HR in each individual. Thus, the aim of this study was to compare the distribution of usual food intake estimated by statistical models with the distribution of the observed usual intake. The results will allow us to have a critical discussion regarding both conclusions of studies that adopted these methods and the recommendation for use in future studies.
Methods
Study design and population
The present study was a longitudinal study including 302 individuals from the city of Rio de Janeiro, Brazil. To maintain both quality and participation rate, as well as for logistic and cost reasons, we adopted a snowball sampling: we first selected the interviewers (twenty-three undergraduate dietitians) and they in turn selected individuals to administer the 24HR. These selected participants preferably frequented the same social network, were close to the interviewer and were willing to answer in detail about everything they consumed for 20 non-consecutive days. Although the interviewers were from the same university, the respondents were well spread throughout the city, as each interviewer had his or her own social network, that is, each one lived in a different neighbourhood, with no common friends and relatives with other interviewees. Data collection was performed from March 2013 to April 2014 and covered weekdays and weekend days. The average length of follow-up for each individual was 3 months. The interviewers were warned not to administer the 24HR on the same weekdays for a given individual.
Dietary assessment
The multiple-pass method for intake collection by 24HR was applied by trained interviewers. This method uses distinct steps to collect information about the participant’s food intake, including listing everything consumed the previous day, the time of consumption, descriptions about and amounts of each food reported and review of the list of foods mentioned and probes for additional eating occasions( Reference Conway, Ingwersen and Vinyard 11 ). The first 24HR by the interviewers were checked by the research staff. In case of incomplete filling, the interviewer was re-trained with respect to their specific mistakes. After this initial checking, interviewers were asked to periodically submit the filled 24HR to the research staff for quality check. Information on food intake was entered using software specifically designed for Brazilian dietary surveys (Brasil Nutri), which contained standardised portions for foods and recipes most commonly found in the national representative household purchase research carried out in 2002–2003. As the 24HR were being entered, a research assistant performed a screen out to detect and correct mistyped records and inconsistent amounts coded. Foods reported in each 24HR were critically reviewed to identify any failures related to the descriptions of the food consumed or to food-preparation techniques, including their apportioning and quantification.
Statistical analysis
True usual food intake was defined as the average of the twenty 24HR for each individual. This was considered our ‘gold standard’ for usual dietary intake for further comparisons and analyses. Usual food intakes can be estimated by statistical models using two non-consecutive 24HR for each individual( Reference Tooze, Midthune and Dodd 5 , Reference Hartig, Haubrock and Knüppel 6 ). However, as the sample size was not large enough, the precision of percentiles of intake was lower, so that the estimation using, for instance, the 1st and 2nd collection days would be different from that using the 1st and 3rd, from that using the 4th and 7th and so on. To overcome this limitation, we generated data sets containing all possible combinations of collection days – that is, one with the 1st and 2nd collection days, then the 1st and 3rd, then the 1st and 4th, … , the 2nd and 3rd, the 2nd and 4th and so on till the 19th and 20th collection days – totalling up to 190 data sets. For each combination, we estimated usual percentiles of intake for the selected foods using two methods briefly described as follows.
-
∙ National Cancer Institute method( Reference Tooze, Midthune and Dodd 5 ): it is a two-part, mixed model in which the first part estimates the probability of consuming a food, and the second part estimates the amount consumed. Both parts include person-specific random effects that allow for correlation between probability and amount. Usual intake distribution is estimated on the basis of parameters defined in the model, such as within- and between-person variance, λ of Box-Cox transformation and population mean. Percentiles of usual intake were estimated using MIXTRAN and DISTRIB macros version 2.1 (available on appliedresearch.cancer.gov) that run in SAS software package (SAS Institute Inc.).
-
∙ Multiple Source Method( Reference Hartig, Haubrock and Knüppel 6 ): MSM consists of a web-based software developed within the framework of the European Food Consumption Validation Project. It is also a two-part correlated model, but in this case parameters of the usual intake distribution are calculated directly from distribution of the estimated individual usual intake. The MSM method was accessed to perform the analyses on the website msm.dife.de. Detailed statistical properties of these methods can be accessed in another publication( Reference Goedhart, van der Voet and Knüppel 9 ).
We selected food items in which usual intake distribution could be well described by averaging 20 collection days and comprised a range of parameter distributions: skewness, CV, percentage of zero intakes, percentage of non-consumers, within:between-person variance ratio and the correlation between probability of intake and amount consumed. The online Supplementary Material shows detailed analyses on which the selection of foods was based. For each percentile of intake, we obtained 190 possible estimates (e.g. we have one estimate for the 1st percentile of each one of the 190 data sets). We then averaged these estimated percentiles to express the most expected estimate for this percentile of intake. To compare the distributions – estimated from NCI, estimated from MSM and 2-d mean – graphs with the Kernel density of the distributions and absolute difference were plotted. The precision of the estimation was expressed as the interval between the 5th and the 95th percentiles from the distribution of all possible estimates (i.e. 190) for a given percentile. Biases were calculated as the difference between the estimated and the true intake, and the lower and upper limits of the bias were the differences between the lower and the upper interval of the estimated percentiles and the true intake, respectively. Bias and their upper and lower limits were plotted to present precision of the estimated percentiles of intake using both methods. In addition, we fit both methods to all 20 d to assess potential improvement in using more than just one replication.
The study protocol was reviewed and approved by the Ethics Committee at the Institute of Social Medicine, State University of Rio de Janeiro. All individuals signed the informed consent form.
Results
The average age of the participants was 30 (sd 11) years; 71 % of the sample were women; and 14, 25 and 61 % of the sample had elementary, high school and college education, respectively. The percentages of interviews according to the days of the week were 16·3, 15·1, 16, 14·5, 12·2 and 11·2 % for Sunday to Saturday, respectively.
Table 1 shows the mean, CV, skewness, percentage of zero intake, percentage of non-consumers, variance ratio (within-to-between-person variance) and the correlation between probability of intake and amount eaten for selected foods. In spite of a high percentage of zero intake in a given day of intake, the combined 20 d showed a small percentage of non-consumers with the exception for coffee (19 %). For most foods, there was an important correlation between probability of intake and amount eaten, which indicates the appropriateness of using the two-part correlated model.
Parameter distribution for selected food items (Mean values and coefficients of variation)
VR, variance ratio.
* Percentage of individuals with 2-d mean intake equal to 0.
† Percentage of individuals who did not report intake during the 20 d.
‡ Spearman’s correlation between probability of intake and amount eaten.
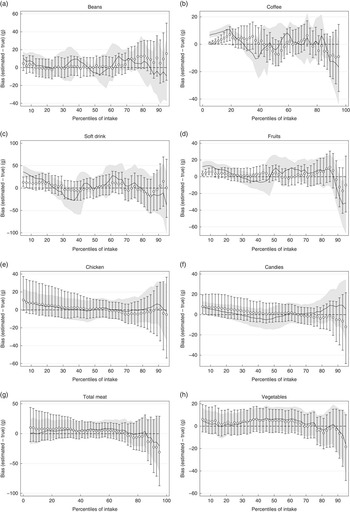
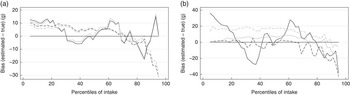
Fig. 1(a)–(h) presents the distributions based on true intake, estimated from NCI and MSM, and the 2-d mean. In most cases, NCI and MSM produced similar percentiles that were very close to the true intakes, and they were better in representing the usual intake compared with 2-d mean. Fig. 2(a)–(h) shows the precision for each estimated percentile of intake for selected foods. The solid line and the shaded area stand, respectively, for the biases and precision of the MSM method, and circles and bars are the estimates for the NCI method. With a few exceptions, both NCI and MSM underestimated the intake in the upper percentiles, mainly from the 85th percentile onwards. Both NCI and MSM overestimated the low percentiles mainly for foods with high percentage of zero intake in a 2-d combination, which was the case for coffee, fruits, candies and chicken. Fig. 3(a) and (b) compare estimation using 2 and 20 d records with true intakes. NCI provided very similar estimates either using 2 or 20 d records; MSM estimations presented a higher variation mainly in the low percentiles for total meat.
(a–h) Food intake distributions from different methods: 2-d mean (![]() ), 20-d mean (
), 20-d mean (![]() , true intake), estimated from the Multiple Source Method (
, true intake), estimated from the Multiple Source Method (![]() ) and estimated from the National Cancer Institute (
) and estimated from the National Cancer Institute (![]() ) method. Distributions represent how close the estimated usual food intakes (using 2 collections days) are to the measured usual intakes. 2-d Means represent the uncorrected distribution based on a small number of collection days.
) method. Distributions represent how close the estimated usual food intakes (using 2 collections days) are to the measured usual intakes. 2-d Means represent the uncorrected distribution based on a small number of collection days.

(a–h) Bias and precision of the estimated percentiles of usual food intake. Biases were calculated as the absolute difference between the estimated and true intake. ![]() and
and ![]() ,Biases and precision regarding the Multiple Source Method (MSM);
,Biases and precision regarding the Multiple Source Method (MSM); ![]() and
and ![]() , estimates regarding the National Cancer Institute (NCI) method. Figures show the over- and underestimation in each percentile from the MSM and NCI methods, and its variation when using different combinations of 2 collection days.
, estimates regarding the National Cancer Institute (NCI) method. Figures show the over- and underestimation in each percentile from the MSM and NCI methods, and its variation when using different combinations of 2 collection days.
Bias in the estimated percentiles of intake using 2 and 20 d compared with 20-d mean; (a) National Cancer Institute, (b) Multiple Source Method. Biases were calculated as the absolute difference between the estimated and true intake. ![]() , Soft drink (2 d);
, Soft drink (2 d); ![]() , soft drink (20 d);
, soft drink (20 d); ![]() , total meat (2 d);
, total meat (2 d); ![]() , total meat (20 d).
, total meat (20 d).
Discussion
We demonstrated empirically that both methods provide good estimates of the usual food intake distribution but may fail in some situations. Both methods overestimated the low percentiles, specifically up to about the 15th and 20th percentile. This happened more intensively when estimated by MSM, with overestimation of the lower percentiles (please see percentiles up to 20th–30th for these foods) followed by a higher underestimation (please see percentiles from 30th to 40th). This is in part due to statistical properties of the methods: although NCI estimates percentiles of intake based on parameters defined from the population that produce a smoothed curve, the curve from MSM is based on estimated individual intake, being more similar to the shape of the original intake distribution.
Our results have important practical implications for dietary assessment in nutritional epidemiological studies once we provide quantitative evidence that distribution of usual food intake can be estimated using only one replication of the 24HR, which can even be performed in a subsample of the study population( Reference Verly, Castro and Fisberg 12 ). Moreover, there is no apparent advantage of fitting the models using more than one replication, mainly for the NCI model. In the case of MSM, it seems that adding more collection days would result in better estimates in low percentiles mainly for foods with high percentage of zero intake in a 2-d combination, as in the case of soft drinks. In spite of the underestimation and overestimation of percentiles of intake, from a public health standpoint, these biases appear not to be of major concern. In general, the difference between true and estimated values was <10 % with higher variation in the low and upper percentiles. The most important implication of this error would be biased prevalence of inadequate intake when compared with a cut-off point( Reference Dodd, Guenther and Freedman 4 ). Although there was a small precision for some estimated percentiles of intake, it happened mainly in the upper tail (see upper tail of distribution of fruits, soft drink and coffee). Subsequently, it does not substantially affect the proportion of a population above or below certain criteria of adequacy.
Our gold standard was the average of twenty replications of 24HR for each person. We assume that each 24HR is an unbiased measurement of the amount consumed on a given consumption day. It is clearly not true, and some studies have shown substantial systematic error when compared with biomarkers of energy, protein and K intakes( Reference Kipnis, Subar and Midthune 13 ). Nonetheless, the methods used here correct only for within-person random error (day-to-day fluctuation in dietary intake) and not for systematic error, and it must be kept in mind when interpreting these results. The estimated distribution of usual intake is expected to reflect the actual between-person variance, but the mean intake and percentiles are usually underestimated because of systematic error( Reference Freedman, Commins and Moler 2 , Reference Kipnis, Subar and Midthune 13 ).
To be considered a satisfactory gold standard for the usual intake (in this case, free of within-person random error), two conditions must be met. First, the population mean must be stable through collection days. When collecting food intake information for many days, the population mean for each collection day has some variation due to expected random sample variation. The smaller the sample size, the higher the sample variation and smaller the precision of the mean for any specific day of intake. Despite the sample variation, population mean through collection days must keep stable – that is, with no trend of decrease as the number of collections increase. When this happens, it means that there is an additional source of error, probably due to some discouragement to keep answering thoroughly about food eaten by respondents. That is why the 1st collection day is believed to be the one with the least systematic error, although there is no consistent evidence for that. Second, the variance must decrease and become stable – that is, the variance of intake measured by a single collection day per person is quite higher than that from the average of 5 collection days/person, and the latter is higher than that from 10 collection days. However, from a given number of collection days onwards, the variance becomes stable. The number of collection days required will vary according to the food item. These conditions were not met for some foods in this study and they were not included in our analysis (see online Supplementary Material).
A major limitation of this study is the small sample size, and in turn a small precision. However, this problem was mitigated by analysing all possible 2 collection day pairs and averaging the estimates so that extreme estimates, due to random sample variation, were cancelled out. Considering a classic study protocol in which two non-consecutive 24HR are administered, estimates from these statistical methods are more likely to be close to the true usual intake as found in this study, as long as the sample size provides enough precision. Otherwise, estimates from small samples would fall in a range of values such as those covered by the shaded area or vertical bars for each estimated percentile of intake. Other limitations inherent to the 24HR assessment, such as recall bias and interviewer bias, might have occurred, but we cannot know its extent as we did not use any biomarker.
We opted for not running the models by adjusting for covariates such sex, age and frequency of consumption. Although the correlation between frequency and amount would potentially improve the prediction, it has shown no effects on the estimation of the percentiles of usual food intake( Reference Goedhart, van der Voet and Knüppel 9 , Reference Verly, Fisberg and Marchioni 14 ). In fact, inclusion of frequency of consumption may not be beneficial when the interest is in the upper percentiles only( Reference Goedhart, van der Voet and Knüppel 9 ). Kipnis et al.( Reference Kipnis, Midthune and Buckman 15 ) proposed a regression calibration to correct for measurement error when testing the association between dietary intake and disease outcome and demonstrated by simulation that, in that case, frequency of consumption should be considered as an important predictor.
In conclusion, both methods seemed to be well suited for the estimation of percentiles of usual food intake, but with some increased bias in the lowest percentiles for foods with a high percentage of zero intake. In any case, the use of these methods mitigates an important limitation concerning the collection of long-term dietary intake in epidemiological studies, as a single replication of the 24HR would be enough to describe usual intake distribution in a population.
Acknowledgements
This work was supported by the State of Rio de Janeiro Research Foundation (no. E-26/201·488/2014) and the Brazilian National Research Council (no. 481434/2013-5). The funders had no role in the design, analysis or writing of this article.
E. V.-J. conceptualised the study question, designed the study, analysed the data; D. C. R. S. O. supported the data management and data analyses; D. M. L. M. and R. M. F. reviewed the analyses and the manuscript and provided comments. E. V.-J. had primary responsibility for the final content. All the authors read and approved the final version of the manuscript.
There are no conflicts of interest.
Supplementary Material
For supplementary material/s referred to in this article, please visit http://dx.doi.org/doi:10.1017/S0007114516002725


