





Global epidemiology of malnutrition
Globally, and before the Covid-19 pandemic, malnutrition was estimated to contribute to one in seven premature deaths, with most of this burden in low- and middle-income countries (LMIC)(1). With the growing impacts of poor diets and climate change, and the added stress that Covid-19 has put on health and food systems, these estimates are predicted to get worse(1). The term ‘malnutrition’ encompasses suboptimal nutrition in all its forms, i.e., undernutrition, inadequate intakes of micronutrients, overweight, obesity and resulting diet-related non-communicable diseases. While appreciating the global burden of over-nutrition and the health consequences of the double- and triple-burden of nutrition(Reference Osendarp, Brown and Neufeld2), this review will focus specifically on undernutrition and sex-specific consequences of undernutrition on infant growth and development.
The past few decades have seen a marked reduction in the global prevalence of child undernutrition(Reference Bhutta, Akseer and Keats3). However, in spite of this decline, the global burden remains high and in 2020 it was estimated that 149 million children were stunted (too short for their age based on international growth standards) and 45 million were wasted (too thin for their length/height based on international growth standards)(Reference Victora, Christian and Vidaletti4). As childhood undernutrition may have its origins prenatally, fetal growth restriction (defined as a birth weight for gestational age and sex below international growth standards) is also considered as a component of childhood undernutrition. In all its forms, undernutrition during infancy and childhood is estimated to contribute to 45 % of all child deaths(Reference Black, Allen and Bhutta5) and to impact on a range of developmental outcomes(Reference Victora, Christian and Vidaletti4). A number of emerging interventions, such as the provision of small-quantity lipid-based nutrient supplements (LNS) for children aged 6–23 months have shown some positive effects on child growth outcomes(Reference Dewey, Arnold and Wessells6), brain development (including language and motor development skills)(Reference Prado, Arnold and Wessells7) and survival(Reference Stewart, Wessells and Arnold8). However, the impact of programmes to reduce childhood undernutrition remain limited and further efforts are required to determine risk and resilience factors for undernutrition within and between contexts, especially for the most vulnerable(Reference Keats, Das and Salam9). Building on this global picture, this review will explore sex differences in risk of undernutrition and consider these in the context of existing programmes and policies.
Research looking at the differential effects of sex or gender on health outcomes is becoming increasingly prominent in public health-related literature, and there is renewed focus on how this translates into programmes and policies(Reference Vlassoff and Garcia Moreno10). Within this field, ‘sex’ is used to refer to biological attributes and ‘gender’ to socially constructed roles, behaviours and identities(Reference Heidari, Babor and De Castro11) and there is a strong argument that the two should not be conflated in health-related research(Reference Thurstans, Opondo and Seal12). For the purpose of the current review, only biological sex is considered, and the terms boys/male and girls/female are used to infer biological sex.
Evidence of male vulnerability in morbidity and mortality
Epidemiological evidence from low- and middle-income country contexts has consistently reported an increased risk of neonatal and infant mortality among boys, compared to girls(Reference Wells13). For example, in an analysis of pooled data from 60 surveys from sub-Saharan Africa, neonatal mortality was 28 % higher among boys than girls, and infant mortality 8 % higher(Reference Garenne14). Of note, in the same analysis, no sex differences were seen for a number of health-related indicators, including vaccination coverage, use of specific medicines (e.g. oral rehydration therapy) and breast-feeding duration(Reference Garenne14).
Sex differences have further been observed in relation to infectious disease risk. In a comprehensive review of the epidemiology of childhood diarrhoea and pneumonia, Fischer Walker et al. found that boys were overrepresented compared with girls for both acute diarrhoeal disease and for pneumonia incidence(Reference Walker, Rudan and Liu15). Of 23 studies identified with information about sex with respect to the incidence of diarrhoea, seven showed significantly more cases in boys than in girls with the other studies showing no differences between the sexes(Reference Walker, Rudan and Liu15). Similarly, and in a separate review of data from unpublished population-based studies, Nair et al. found that the incidence of admission for severe acute lower respiratory infection was higher in boys than in girls in all age groups and regions and that the sex difference was greatest in studies from South Asia(Reference Nair, Simoes and Rudan16).
This differential pattern in morbidity and mortality by sex commonly observed across LMIC contexts may be explained by either gender-based factors, such as sex-based health-seeking behaviours (noting that gender-based factors have commonly been observed to favour boys(Reference Mitra, Rahman and Fuchs17)), or biological factors, such as pathophysiologic sex differences between boys and girls, making boys more susceptible to acute infection. These topics are explored in further detail later in the current review.
Evidence of male vulnerability in undernutrition
It is well established that male children grow faster than female children, as evidenced by the development and use of population-based sex-specific growth curves. Using the example of the WHO’s Multicentre Growth Reference Study (MGRS)(Reference de Onis, Garza and Victora18) which maps typical patterns of growth among healthy infants and young children, boys are longer and heavier at birth (highlighting different patterns of fetal growth by sex) and this maps throughout infancy. To illustrate this difference, and using the WHO MGRS standards, the median weight for a 12-month-old male child is 6·8 kg whereas for females, they would need to be 15 months of age before this becomes the median weight. Similarly, when considering length, and using the WHO MGRS simplified field tables, the median length of a six-month old male child, for example, is 67·6 cm whereas for a female child it is 65·7 cm(Reference de Onis19).
In addition to differences in the rate of attainment of weight and length across infancy and childhood, sex-specific patterns in post-natal body composition have also been observed. Using sensitive stable-isotope dilution techniques in infants and children from the UK, Wells et al. (Reference Wells, Davies and Fewtrell20) highlighted subtle sex differences in the accretion of both fat-free and fat-mass in infancy (Fig. 1). In early infancy, when the overall rate of weight gain is slowing, males gain fat-free mass faster than females, who show slightly faster fat mass accretion. Later in childhood, from around three years of age, females gain both fat-free and fat mass at a more consistent rate, whereas fat mass accretion in males declines while fat-free mass accretion increases(Reference Wells, Davies and Fewtrell20).
Sex-specific differences in the development of post-natal body composition. From Wells et al. 2020(Reference Wells, Davies and Fewtrell20). Figures show centiles (3rd, 10th, 25th, 50th, 75th 90th and 97th) for fat-free mass and fat mass in boys and girls measured by deuterium dilution. Data are derived from studies on 463 children in the UK aged between 6 weeks and 7 years, conducted between 1988 and 2010. Figure reproduced from Wells et al. 2020(Reference Wells, Davies and Fewtrell20)

These sex-specific patterns, observed among children from the UK, represent patterns consistent with normal growth under supportive environments (e.g. optimal nutrition, limited infections). However, similar sex differences have also been observed in resource-constrained settings. Using the hormone leptin as an indicator of adipose tissue mass, Collinson et al.,(Reference de Onis19) observed parallel sex-specific differences in fat mass – measured using plasma leptin concentrations – present from birth among rural Gambian infants(Reference Collinson, Moore and O’Connell21). In that cohort, differences were most pronounced in cord blood samples (reflecting neonatal fat mass) with female infants having plasma leptin concentrations, adjusted for infant BMI, almost double those of male infants (Table 1). Although this difference was attenuated across the first year of life, female infants maintained higher leptin levels through to 12-month post-partum, indicative of greater fat mass than boys of the same BMI(Reference Collinson, Moore and O’Connell21). Whilst reflecting normal physiology, from an evolutionary perspective, fat depots act as a buffer during times of nutritional hardship; a greater fat mass among female infants in contexts at risk of nutritional shortage may protect girls from undernutrition in the short term.(Reference Wells22)
Sex differences in leptin concentration at birth and in infancy among Gambian infants (from Collinson et al. (Reference Collinson, Moore and O’Connell21))
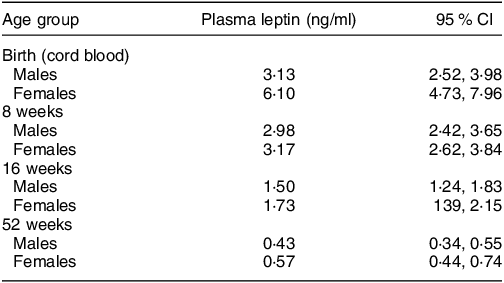
All values are geometric means (95 % CI). The main effects of sex, age and BMI z-score were all significant, P < 0·0001.
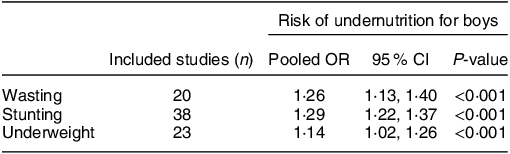
Such patterns of growth from contrasting contexts highlight a greater rate of growth and acquisition of lean mass among boys during infancy and early childhood. In situations of sub-optimal nutrition and challenges from environmental exposures (infections, poor sanitation, etc.), efforts to meet these normal patterns in the development of body tissues may be challenged, with greatest risk among boys due to greater needs. Indeed, it is now becoming increasingly recognised that, in contexts of food insecurity, the increased vulnerability of boys to morbidity and mortality in infancy and early childhood is commonly reflected in an increased vulnerable to undernutrition, as compared to girls. In a systematic review and meta-analysis published in 2020, Thurstans et al. identified 74 studies among children aged between 0–59 months where undernutrition by sex was reported(Reference Thurstans, Opondo and Seal12). Of these, 44 included sufficient data, disaggregated by sex to be included in a meta-analysis; the results from their meta-analysis are highlighted in Table 2. For wasting, the pooled results showed that boys had a 26 % higher odds of being stunted than girls. For stunting, the odds was 29 % higher and for underweight 14 % higher among boys(Reference Thurstans, Opondo and Seal12). The authors also looked at risk by region and, for wasting, the odds were higher for boys in all geographical regions covered (Africa (East, West, Central, North), Oceania, Asia (South, South East), Central America). For stunting, the same trend applied, with the exception of South Asia where there was no difference by sex and for underweight, boys remained at greater risk than girls across all regions except Central America (limited to one study) and South Asia. Further, the findings were consistent across age groups; the odds of boys being wasted, stunted or underweight were higher in all age categories (0–24, 24–59, 0–59 month old groupings) than for girls(Reference Thurstans, Opondo and Seal12).
Risk of wasting, stunting and underweight in boys compared to girls aged 0–59 months; summary of meta-analysis by Thurstans et al. (Reference Thurstans, Opondo and Seal12)
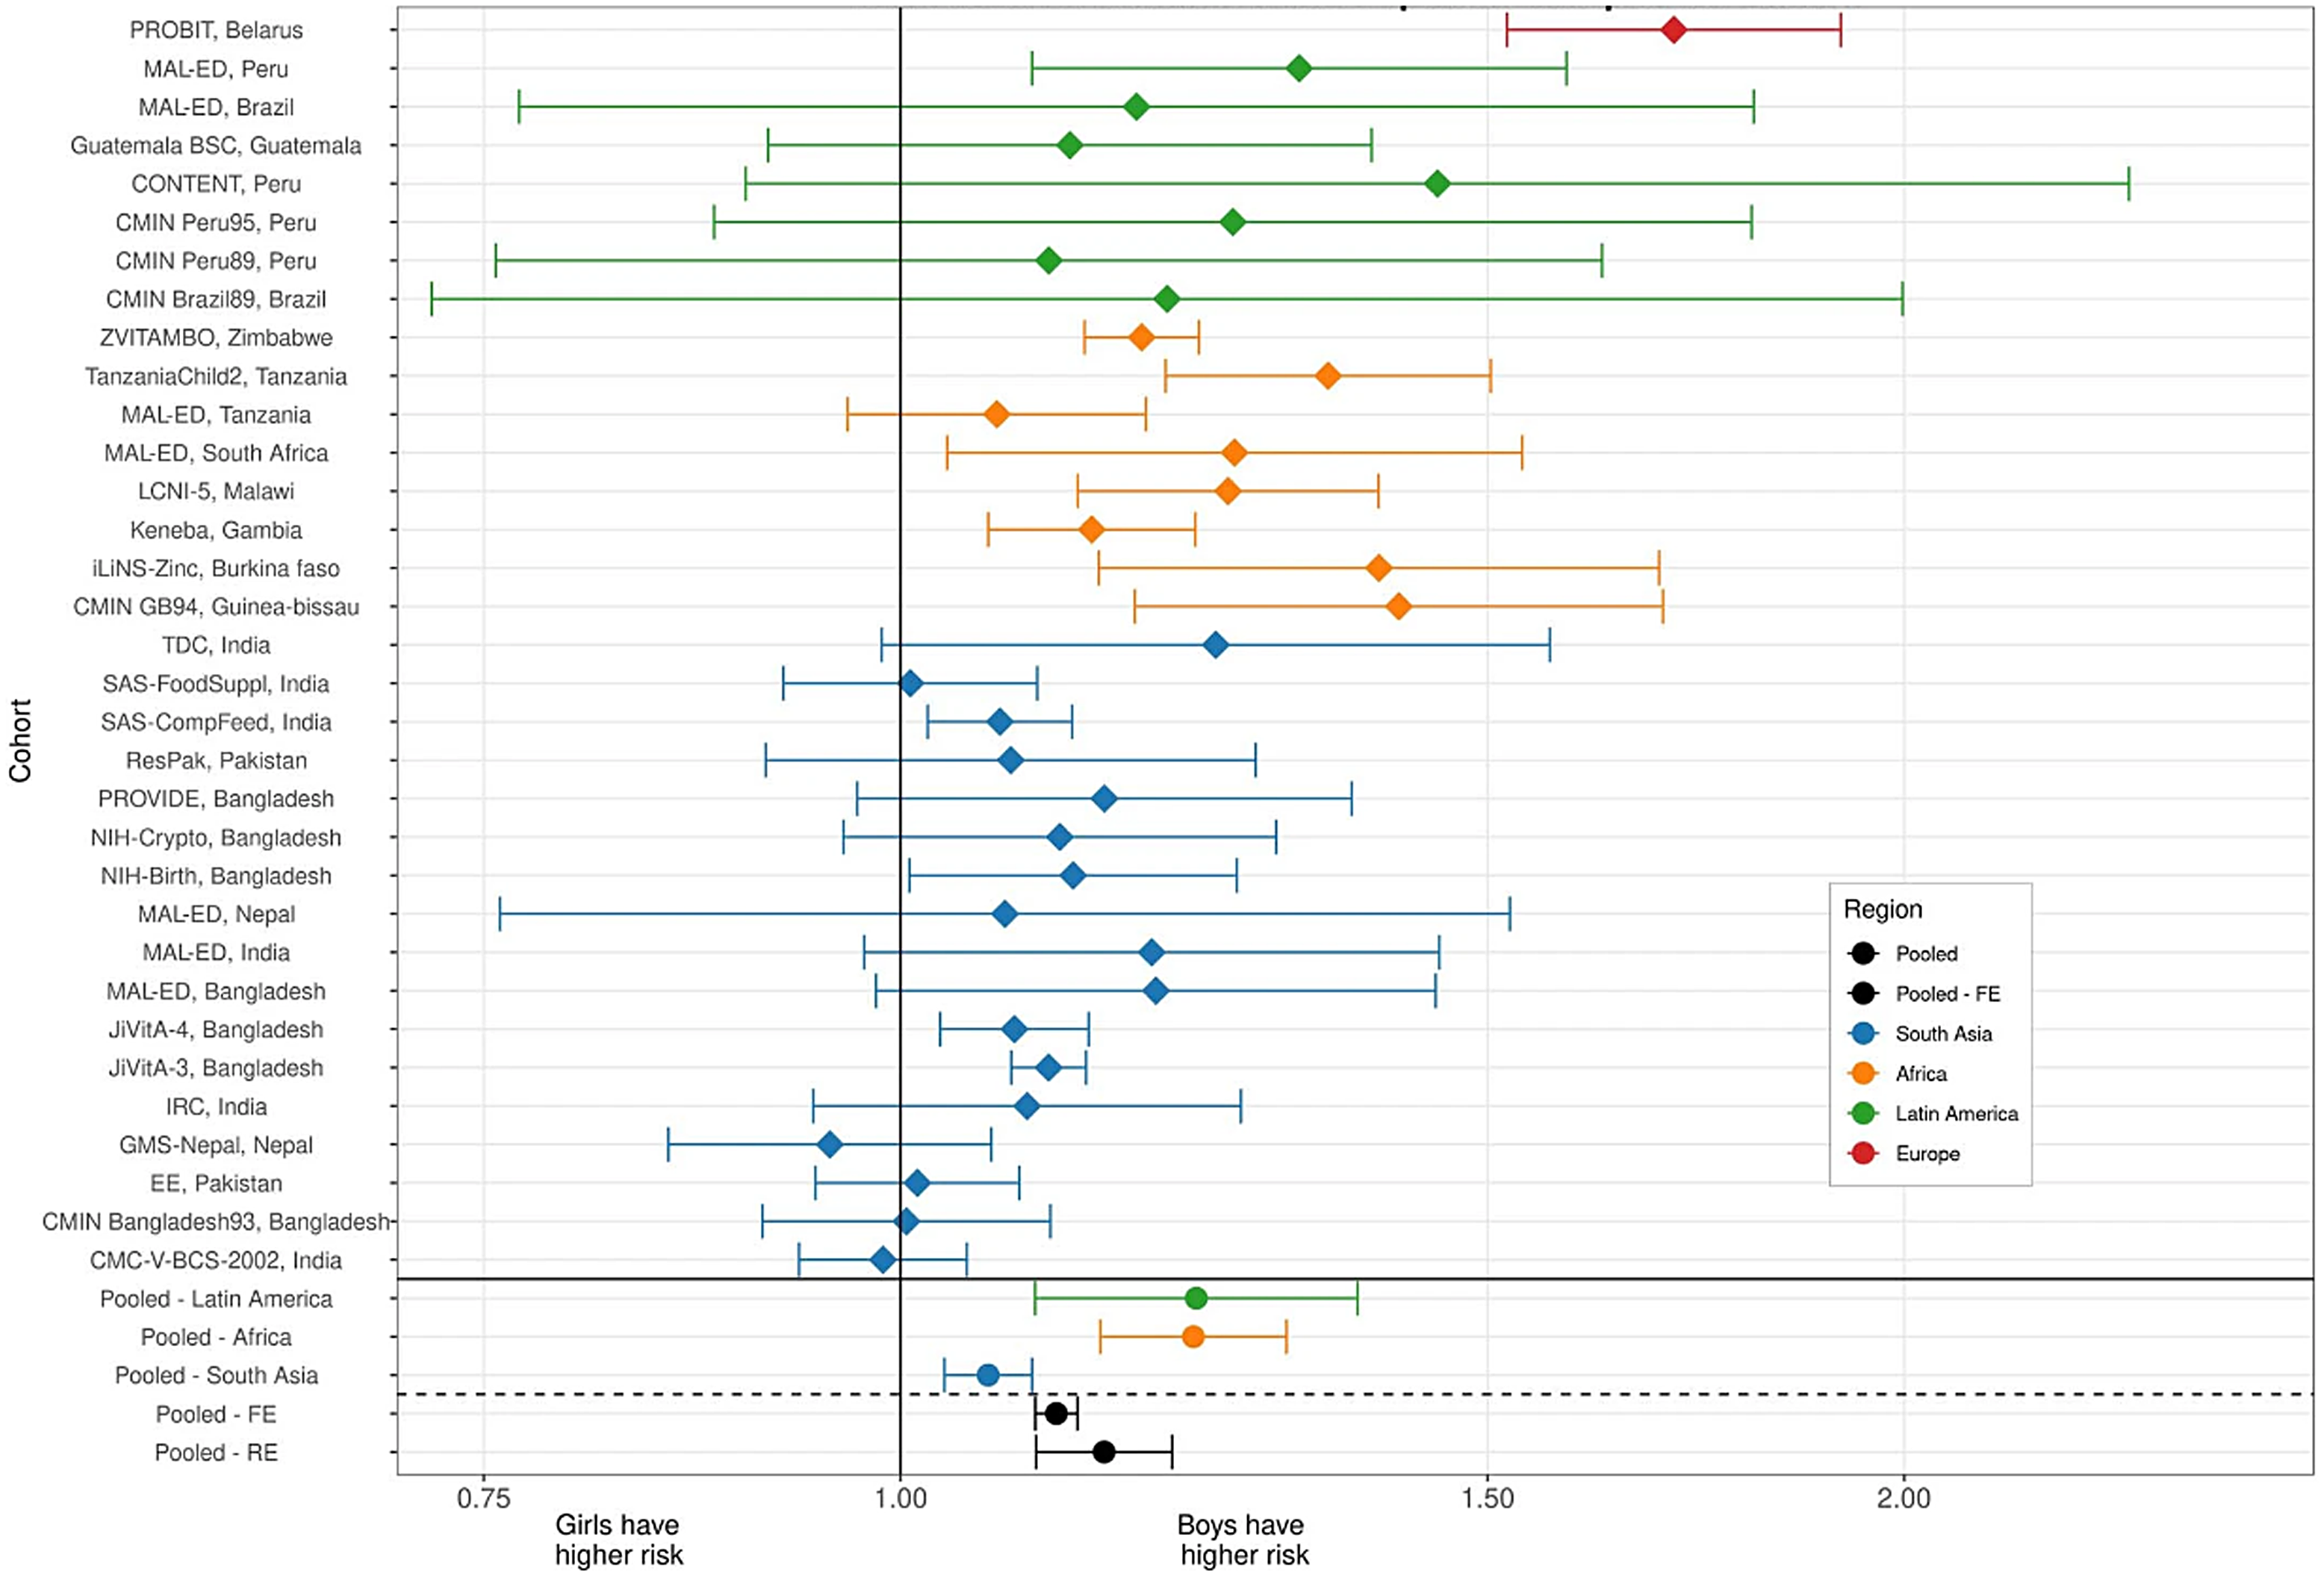
Further, robust evidence of sex-specific effects on growth in infancy and early childhood come from a recently published analysis of pooled data from studies from 33 longitudinal cohorts in 15 LMIC in south Asia, sub-Saharan Africa, Latin America and eastern Europe, incorporating data from over 83 000 children aged 0–24 months(Reference Mertens, Benjamin-Chung and Colford23). The estimated point prevalence of stunting from the pooled analysis was consistent with previous estimates, showing a progressive increase in stunting rates across all contexts from birth to two years of age, with the overall prevalence reaching 42 %, but ranging from 25 % in Latin America to 48 % in South Asia(Reference Mertens, Benjamin-Chung and Colford23). In this pooled analysis, girls had consistently higher length-for-age z-scores (LAZ) and weight-for-length z-scores (WLZ). When looking at stunting incidence, the estimated pooled risk was higher for boys in all contexts (Fig. 2), noting that individual point estimates for individual studies varied, with a diminished effect in a number of studies from the South Asian context(Reference Mertens, Benjamin-Chung and Colford23). A consideration of factors explaining these observed differences in growth and body composition between boys and girls is made later in this review.
Associations between sex and stunting incidence from birth to 24 months of age using data from 33 longitudinal cohorts and across 15 LMIC contexts (from Mertens et al. (Reference Mertens, Benjamin-Chung and Colford23)). Each line represents an individual cohort comparing cohort-specific risk for girls v. boys. Cohort-specific estimates of the cumulative incidence ratio of stunting are plotted on each row. Colours indicate different global regions (red – Europe, Green – Latin America, Orange – Africa, Blue – South Asia). Region-specific pooled measures are shown below the solid line. Reproduced from Mertens et al. (Reference Mertens, Benjamin-Chung and Colford23)
Consequences of sex-specific undernutrition on infant and child development
There is good evidence that, given the right nurturing environment, neurological milestones and behaviours among healthy boys and girls follow similar trajectories worldwide. However, recent estimates suggest that one in every three children growing up in LMIC – where environments may be more challenging – fail to reach appropriate developmental milestones by pre-school age.(Reference McCoy, Peet and Ezzati24) This early developmental faltering has been associated with life-long consequences, including reduced academic achievement, economic success and mental health across the lifespan.(Reference Black, Behrman and Daelmans25) The first 1000 d of life, which describes the developmental period between conception and two years of age, represents a critical period for brain development during which plasticity to risk and resilience factors is greatest. Risk factors include a range of biological and psychosocial factors, including undernutrition, environmental hazards, poor sanitation, lower parental income and educational level, parental mental health issues and reduced access to recreational and educational activities. Conversely, resilience factors include the five, inter-related components of nurturing care: good health, adequate nutrition, safety and security, responsive caregiving and opportunities for learning(Reference Black, Behrman and Daelmans25).
A relationship between infant size or infant growth and neurocognitive development has been reported across numerous studies. For example, in a pooled analysis of cross-sectional country wide survey data, McCoy and colleagues compared data on the Early Childhood Development Index (ECDI) against a number of exposure variables, including height-for-age z-score and incidence of stunting in children aged 3–4 years(Reference McCoy, Peet and Ezzati24). A strong positive relationship was observed between risk of low ECDI across the HAZ spectrum, with children of lower HAZ and stunted children being at greater risk of a low ECDI. In a meta-analysis of data from 68 studies from 29 LMIC and among younger children, Sudfield and colleagues observed a + 0·24 difference in cross-sectional cognitive ability per unit increase in HAZ for children under two years of age(Reference Sudfeld, McCoy and Danaei26). This effect was also observed to have lasting impact and, prospectively, each unit increase in HAZ for children ≤ 2 years old was associated with a + 0·22 sd increase in cognition at 5–11 years. Using data from the multi-site Malnutrition and Enteric Disease (MAL-ED) cohort study, Alam et al. explored associations between patterns of stunting in infancy and early childhood and cognitive development at 5 years of age(Reference Alam, Richard and Fahim27). Such analyses help define the most critical windows where undernutrition and associated growth faltering has most impact on subsequent developmental outcomes. In their analysis, stunting was categorised as early-onset persistent (first stunted at 1–6 months and persisting at 60 months), early-onset recovered (first stunted at 1–6 months and not stunted at 60 months), late-onset persistent (first stunted at 7–24 months and persisting at 60 months), late-onset recovered (first stunted at 7–24 months and not stunted at 60 months) and never (never stunted). Interestingly, early-onset persistent stunting was associated with lower cognitive development in children at 5 years of age (–2·10, (95 % CI: –3·85, –0·35) but no other significant relationships were observed, suggesting that some early deficits may be recoverable(Reference Alam, Richard and Fahim27).
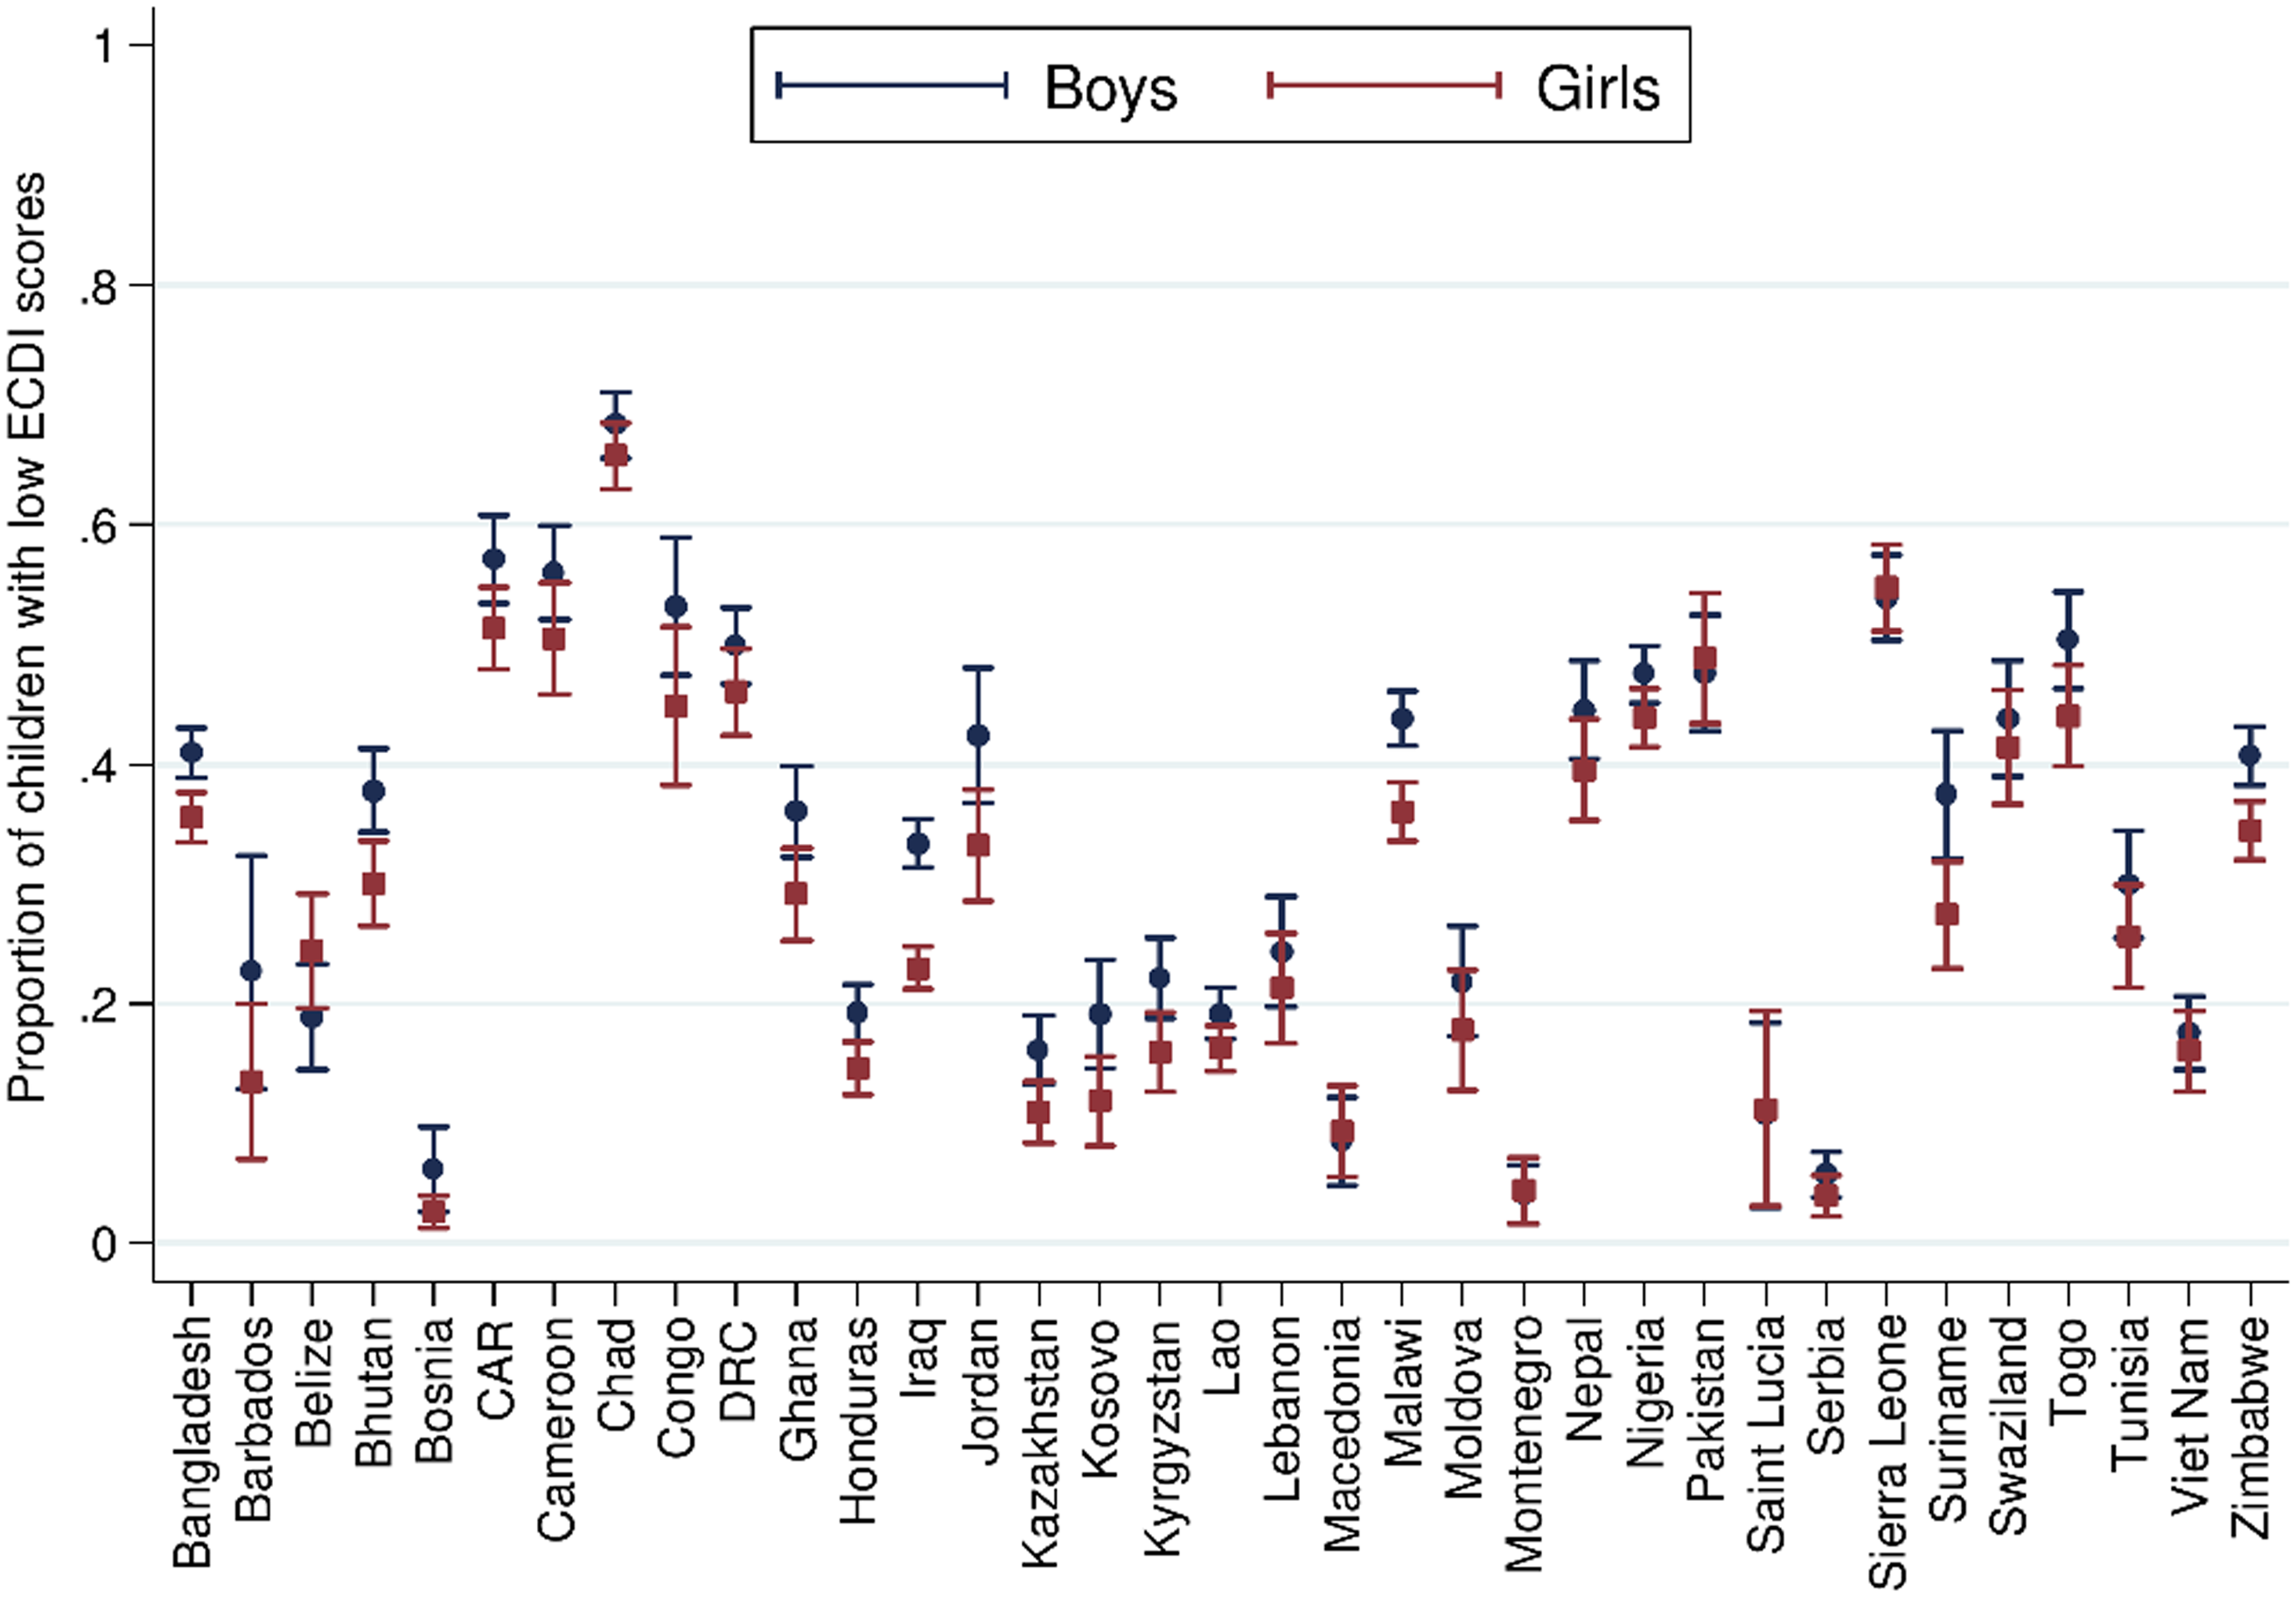
On this backdrop, and given the evidence presented above of an increased risk of undernutrition among boys in contexts of food insecurity, it might be anticipated that a similar sex-specific effect on infant neurocognitive development and behavioural outcomes is observed. In healthy infants, sex-specific differences most often favouring girls have been observed in the prevalence of a number of developmental disorders (language, attention disorders, autism and cerebral palsy) but not in others (infant cognitive disorders, infant depression)(Reference Lejarraga28). For example, in a systematic review of sex differences in childhood language development and brain development, Etchell et al. observed evidence of heterologous sex differences that was most notable during certain developmental stages, likely due to different rates of maturation between the sexes(Reference Etchell, Adhikari and Weinberg29). Further, using advanced imaging technologies, structural differences in brain tissue have been reported in children(Reference Kumpulainen, Merisaari and Silver30), although such observations are not consistent across the literature(Reference DeCasien, Guma and Liu31). Using population level data, and from the previously described analysis from McCoy and colleagues, incorporating data from 35 nationally representative surveys in LMIC a low ECDI score was more common for boys than girls (Fig. 3)(Reference McCoy, Peet and Ezzati24).
Sex differences in the proportion of children scoring low in cognitive and/or socioemotional development on the Early Childhood Development Index. From McCoy et al. (Reference McCoy, Peet and Ezzati24) Data from n 99 222 3 and 4 year old children from 35 LMIC collected as part of the population representative Multiple Indicator Cluster Survey (MICS) or Demographic and Health Surveys (DHS) programmes. Correlation performed with girls = 1, boys = 0. Reproduced from McCoy et al. (Reference McCoy, Peet and Ezzati24)
However, very limited evidence exists in the literature linking sex-specific deficits in growth faltering and cognitive development. In our own work from rural Gambia and using a cohort of infants (n 223) studied longitudinally from late gestation to pre-school age (the Brain Imaging for Global Health (BRIGHT) study)(Reference Lloyd-Fox, Blasi and McCann32,Reference Milosavljevic, Vellekoop and Maris33) , we have demonstrated a sex-specific effect on stunting and subsequent cognitive score. At 18 months of age, males were twice as likely to be stunted as females (12 % v. 24 %, P < 0·05) and stunted males were observed to score lower in a developmental assessment at 18 months compared to non-stunted males; no difference were observed between stunted and non-stunted females(Reference McCann34).
Mechanisms
This review has highlighted robust evidence of sex differences among vulnerable infants and young children to risk of growth faltering which, in contexts of poverty and food insecurity, puts boys at greater risk of undernutrition in infancy and early childhood. Such deficits may also result in developmental delays and neurocognitive deficits among boys. A consideration of the underlying mechanisms driving these sex differences is therefore relevant as we attempt to develop appropriate, targeted interventions.
Broadly, mechanisms fall into two categories; social factors driving behaviours that may disadvantage boys or biological factors that put boys at greater risk of undernutrition. In the systematic review and meta-analysis by Thurstan and colleagues highlighted earlier in this review, a qualitative synthesis of any explanations given by the authors of the individual papers relating to these observed sex differences in rates of undernutrition was included(Reference Thurstans, Opondo and Seal12). Although mostly conjectural, social reasons provided by the authors of the original articles included gender dynamics, preferential feeding practices (e.g. timing of weaning) or differential behaviours, such as girls staying closer to the home with more access to food as it is being prepared, in contract to boys being away from the home and expending more energy(Reference Thurstans, Opondo and Seal12). However, the consistency of the sex effect across many different cultures and value systems suggest that social factors are unlikely to explain the observed differences in infants and young children.
In a review published in 2021, Thompson described that putative biological explanations fall into two broad categories: increased sensitivity among boys and/or increased needs of boys(Reference Thompson35). The concept of differential sensitivity in utero is well established, and the ‘male disadvantage hypothesis’ – first proposed in the 1970s by Naeye – states that boys are the biologically weaker sex and are more sensitive to environmental or nutritional deprivation during early life(Reference Naeye, Burt and Wright36). A greater male vulnerability has also been attributed to natural selection for optimal parental investment. Based on the Trivers-Willard hypothesis, it is suggested that mothers should invest more in boys when the environment is good and less when the environment is poor – greater male sensitivity to environmental conditions(Reference Trivers and Willard37). Applying this model postnatally, it could be argued that malnutrition interacting with infection and other environmental exposures in infancy and early childhood would continue to create a divergence in risk between boys and girls, impacting differentially on morbidity, undernutrition and associated mortality(Reference Wells13,Reference Thompson35) .
As described earlier in this review, healthy infant boys have a tendency for greater lean mass acquisition in early life(Reference Wells, Davies and Fewtrell20), in addition to attaining a greater length and weight. To meet the nutritional needs of this growth and to support their larger body size, boys have greater energy requirements than girls for growth and maintenance(Reference Butte38). Thus, in times of nutritional hardship the greater need for accretion of lean mass is not met, resulting – in the short term – in wasting and, in the longer term, stunting.
To this point, this review has focused only on growth outcomes as an indicator of childhood undernutrition. However, and as indicated from the outset, undernutrition also encompasses micronutrient deficiencies. Linear growth deficits resulting in stunting are a consequence of chronic undernutrition because of food insecurity, poor diets in combination with other environmental risk factors associated with poverty, such as poor hygiene and sanitation. In addition to chronic protein and energy deficiency, poor diets are associated with multiple deficiencies in micronutrients, many of which are critical to support optimal brain development(Reference Cusick and Georgieff39). In line with increased energy needs among rapidly growing male infants, there is evidence of boys may also be at risk of micronutrient deficiency when supply does not meet demand. In a study among healthy infants, male gender was found to be the most important risk factor for iron deficiency anaemia (OR: 3·3, 1·7, 6·3; P < 0·001)(Reference Antunes, Santos and Carvalho40). Our own work from rural Gambia has looked in more detail at associations between infant iron status and neurobehavioural development(Reference McCann34). In the aforementioned BRIGHT cohort of infants, iron status deteriorated across the first 12 months of life, with > 40 % of infants iron deficient by one year of age(Reference McCann, Mason and Milosavljevic41). Of note, infants were most likely to become iron deficient between one and five months of age and infants in the bottom quartile for iron status at five months, achieved lower scores of development compared to those in the top quartile.(Reference McCann34) In this cohort, males were significantly more likely than females to be iron deficient by 12 months of age (P < 0·05). This finding, although observational, supports the hypothesis that, in nutritionally vulnerable contexts, boys are more at risk of iron – and associated micronutrient deficiencies – with consequences for neurodevelopment.
Conclusions
This review has provided evidence of sex-specific effects in response to undernutrition, with boys showing greatest vulnerability. This is paralleled by an increased risk from infectious disease morbidity and mortality among boys in LMIC contexts. Further, and although more limited, evidence indicates that the growth deficits in boys may also impact on infant and early child development, with consequences on neurodevelopmental outcomes. Such findings create challenges for programme and policy makers as they question the commonly held assumptions that girls in contexts of poverty are more vulnerable than boys and challenge existing evidence and understanding of social factors that favour boys, such as beneficial feeding practices in certain contexts among boys(Reference Jayachandran and Kuziemko42) and gender disparities in health seeking behaviours which favour boys(Reference Treleaven, Ngoc Toan and Ngoc Le43). Strategies to protect vulnerable boys are complex from a programmatic perspective but could include educational programmes that raise awareness among caregivers of this increased risk or programmes that encourage and support enhanced growth monitoring. Further, a greater understanding of both the social and biological processes underpinning sex-differences in infant and early childhood growth and development could help inform future policy recommendations. Finally, in contexts of nutritional vulnerability, all infants and children under five years of age, as well as their caregivers, should be seen as a high priority group for targeted interventions and any complementary programmes targeting boys should be embedded within these rather than competing against.
Acknowledgements
The author acknowledges the contribution from colleagues and collaborators at the MRC Unit The Gambia at the London School of Hygiene and Tropical Medicine for work reviewed and presented here.
Financial support
S.E.M. is supported by a Wellcome Trust Senior Research Fellowship (220225/Z/20/Z). The funder had no role in the research presented on in the writing of this review.
Conflicts of Interest
The author has no conflicts of interest to declare.
Authorship
The current review was presented by the author as part of the Nutrition Society Irish Section Conference 2023 on ‘Understanding the role of sex and gender in nutrition research’. Both the presentation and this review article were researched and written by the sole author (sem).


 Open access

