


Introduction
The end of Late Pleniglacial (17.5–14.7 ka BP; GS-2.1a) and the Late Glacial (14.7–11.7 ka BP; GI-1 and GS-1), both after Rasmussenen et al. (Reference Rasmussen, Bigler, Blockley, Blunier, Buchardt, Clausen and Cvijanovic2014), were periods of abrupt environmental changes in Central Europe, including permafrost degradation, alteration of rivers and vegetation cover, as well as an increase of aeolian activity (Vandenberghe et al., Reference Vandenberghe, French, Gorbunov, Marchenko, Velichko, Jin, Cui, Zhang and Wan2014; Starkel et al., Reference Starkel, Michczyńska, Gębica, Kiss, Panin and Perşoiu2015; Woronko et al., Reference Woronko, Zieliński and Sokołowski2015; Marks et al., Reference Marks, Dzierżek, Janiszewski, Kaczorowski, Lidner, Majecka, Makos, Szymanek, Tołoczko-Pasek and Woronko2016; Britzius et al., Reference Britzius, Dreher, Maisel and Sirocko2024). During this interval, sediments deposited during the Scandinavian Ice Sheet (SIS) recession underwent transformation through cold and dry conditions associated with a periglacial zone (Kozarski, Reference Kozarski1995; Zeeberg, Reference Zeeberg1998; Kasse, Reference Kasse2002; Goździk, Reference Goździk2007). Vegetational cover was sparse, and the persistence of a stable westerly circulation pattern favored highly active aeolian processes across Europe (Zeeberg, Reference Zeeberg1998; Kasse, Reference Kasse2002; Kiss et al., Reference Kiss, Sipos, Mauz and Mezősi2012; Bernhardson et al., Reference Bernhardson, Alexanderson, Bjorck and Adolphi2019; Kappler et al., Reference Kappler, Kaiser, Küster, Nicolay, Fülling, Bens and Raab2019; Bertran et al., Reference Bertran, Andrieux, Bateman, Fuchs, Klinge and Marembert2020; Sipos et al., Reference Sipos, Marković, Gavrilov, Balla, Filyó, Bartyik and Mészáros2022; Kalińska et al., Reference Kalińska, Weckwerth and Alexanderson2023; Łopuch et al., Reference Łopuch, Sokołowski and Jary2023a, Reference Łopuch, Zieliński and Jaryb; Holuša et al., Reference Holuša, Moska, Nývlt and Woronko2024a–Reference Holuša, Nývlt, Woronko, Matějka and Stuchlíkc). Such conditions resulted in development of the extensive European Sand Belt (ESB) stretching from the Netherlands (and British Islands) to central Russia, where within its central part (from eastern Germany to western Ukraine) lies one of the largest concentrations of cold-climate dune fields in the world (Fig. 1A).
(A) Location of the study area (Warsaw Basin) in relation to the European Sand Belt (extent modified after Zeeberg, Reference Zeeberg1998) and the extent of the last glacial maximum LGM limit (Leszno Phase; after Ehlers et al., Reference Ehlers, Gibbard and Hughes2011). Labeled sites are discussed in the ‘Study area’ section. (B) Hypsometric map of the Warsaw Basin (in relation to the level of the Vistula River) and cross sections through the study area (a–a’ and b–b’); m.a. = meters above; NDB = Northern Dune Belt, SDB = Southern Dune Belt. (C) Geomorphological sketch of the study area, featuring the fluvial terraces of the Vistula River.

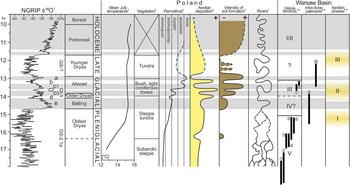
Studies of multiple dune–soil successions indicate an asynchronous development of dunes in the central ESB, spanning from the Oldest Dryas stadial (ca. 16.5 ka BP) to the Boreal period (10 ka BP; Sokołowski et al., Reference Sokołowski, Moska, Zieliński, Jary, Piotrowska, Raczyk and Mroczek2022). Their development was an environmental reaction to the climatic oscillations of the Late Glacial, as recorded by the North Greenland Ice Core Project (NGRIP) core and, with a short delay, by the various depositional environments of Poland (Fig. 2; Słowiński et al., Reference Słowiński, Zawiska, Ott, Noryśkiewicz, Schröder, Apolinarska and Rzodkiewicz2017; Dzieduszyńska et al., Reference Dzieduszyńska, Petera-Zganiacz and Roman2020; Michczyńska et al., Reference Michczyńska, Dzieduszyńska, Petera-Zganiacz, Wachecka-Kotkowska, Krzyszkowski, Wieczorek, Ludwikowska-Kędzia, Gębica and Starkel2022). Although stabilized since the Early Holocene (Kappler et al., Reference Kappler, Kaiser, Küster, Nicolay, Fülling, Bens and Raab2019; Sokołowski et al., Reference Sokołowski, Moska, Zieliński, Jary, Piotrowska, Raczyk and Mroczek2022), these dunes are among the most characteristic features of the landscape in this area, and their sedimentary successions have been studied extensively as an archive of environmental changes occurring at the end of the last glacial period (e.g., Kasse, Reference Kasse2002; Kaiser et al., Reference Kaiser, Hilgers, Schlaak, Jankowski, Kühn, Bussemer and Przegiętka2009; Kalińska-Nartiša et al., Reference Kalińska-Nartiša, Thiel, Nartiš, Buylaert and Murray2016; Kappler et al., Reference Kappler, Kaiser, Küster, Nicolay, Fülling, Bens and Raab2019; Moska et al., Reference Moska, Sokołowski, Jary, Zieliński, Raczyk, Szymak and Krawczyk2022, Reference Moska, Sokołowski, Zieliński, Jary, Raczyk, Mroczek and Szymak2023a; Sokołowski et al., Reference Sokołowski, Moska, Zieliński, Jary, Piotrowska, Raczyk and Mroczek2022).
Variability of environmental conditions in Poland and the Warsaw Basin around the Pleistocene–Holocene boundary. Locations of the 14C samples are marked on Fig 1A. The black bars show the 95.4% confidence interval of the calibrated 14C dates (see Table 1). Horizontal gray bands indicate warm intervals. Sources: 1Rasmussen et al., Reference Rasmussen, Bigler, Blockley, Blunier, Buchardt, Clausen and Cvijanovic2014, 2Płóciennik et al., Reference Płóciennik, Self, Birks and Brooks2011, 3Marks et al., Reference Marks, Makos, Szymanek, Woronko, Dzierżek and Majecka2019, 4Moska et al., Reference Moska, Sokołowski, Jary, Zieliński, Raczyk, Szymak and Krawczyk2022, 5Zieliński et al., Reference Zieliński, Sokołowski, Woronko, Jankowski, Fedorowicz, Zaleski, Molodkov and Weckwerth2015, 6Manikowska, Reference Manikowska1991, 7Konecka-Betley, Reference Konecka-Betley1981, 8Konecka-Betley, Reference Konecka-Betley1982, 9Schild, Reference Schild and Hensel1975, 10Manikowska, Reference Manikowska1985. NGRIP = North Greenland Ice Core Project.

However, these broad stratigraphic and sedimentological studies were supported in a limited way by geomorphological analyses, primarily due to a lack of high-resolution topographic data. This informational shortfall left a clear gap in understanding ESB–dune dynamics, considering that individual aeolian landforms occur under specific environmental conditions (Wasson and Hyde, Reference Wasson and Hyde1983; Pye and Tsoar, Reference Pye and Tsoar2009; Courrech du Pont et al., Reference Courrech du Pont, Rubin, Narteau, Lapôtre, Day, Claudin and Livingstone2024). New high-resolution digital elevation models (DEMs) provide information on aeolian forms that were not visible using traditional cartographic materials. Their existence opens the possibility to comprehensively look at past ESB aeolian environments, incorporating smaller landforms and their patterns into paleogeographical reconstructions (as presented by Bertran et al., Reference Bertran, Andrieux, Bateman, Fuchs, Klinge and Marembert2020; Łopuch et al., Reference Łopuch, Sokołowski and Jary2023a, Reference Łopuch, Zieliński and Jaryb; Holuša et al., Reference Holuša, Nývlt, Woronko, Matějka and Stuchlík2024c). Previous geomorphological analyses have been limited to tracking dune development in the context of general fluctuations of sand supply and direction and strength wind (e.g., Wojtanowicz, Reference Wojtanowicz1969; Nowaczyk, Reference Nowaczyk1986; Zieliński, Reference Zieliński2016).
Residual Dune Ridges (RDRs) are examples of aeolian landforms that were not visible on traditional maps. So far, they have been mainly identified within contemporary coastal dunes (van Dieren, Reference van Dieren1934; Claudino-Sales and Peulvast, Reference Claudino-Sales, Peulvast and Allison2002; Levin et al., Reference Levin, Tsoar, Herrmann, Maia and Claudino-Sales2009; Hesp et al., Reference Hesp, Martinez, da Silva, Rodríguez-Revelo, Gutierrez, Humanes and Laínez2011; Lindhorst and Reimann, Reference Lindhorst and Reimann2021) and on the Great Plains (Wolfe and Hugenholtz, Reference Wolfe and Hugenholtz2009). RDRs are comprised of a series of repeating low (≤ 2 m high) ridges located on the windward side of the dune, whose shape reproduces the dune-base shape (Jimenez et al., Reference Jimenez, Maia, Serra and Morais1999). Their presence is characteristic for low-latitude wet dune systems, where successive RDRs form cyclically due to a seasonal rise in groundwater level, which in turn supports the vegetational colonization and stabilization of the dune base. Consequently, when the dune again migrates, a vegetated fragment separates to form a new ridge from the advancing dune (Claudino-Sales and Peulvast, Reference Claudino-Sales, Peulvast and Allison2002).
RDRs also can form within temperate climate zones where groundwater level fluctuations are more irregular (Lindhorst and Reimann, Reference Lindhorst and Reimann2021). Some authors also highlighted the significance of wind-direction variability for the formation of RDRs (van Dieren, Reference van Dieren1934; Hesp et al., Reference Hesp, Martinez, da Silva, Rodríguez-Revelo, Gutierrez, Humanes and Laínez2011). Wind-direction variability is largely responsible for the accretion of the RDR after its emergence, as a result of the sand supply from the parental dune and the nearby swales (Lindhorst and Reimann, Reference Lindhorst and Reimann2021). So far, RDRs have been considered as a potential source of paleoclimatic data with decadal resolution (Maia et al., Reference Maia, Freire and Lacerda2005; Levin et al., Reference Levin, Tsoar, Herrmann, Maia and Claudino-Sales2009; Lindhorst and Reimann, Reference Lindhorst and Reimann2021). Potentially, due to the recording of dune-base shape at the time of formation, RDRs also can be used to track dune transformation (Wolfe and Hugenholtz, Reference Wolfe and Hugenholtz2009). RDRs also occur within the ESB dune fields, although, so far, they have not been studied. Large concentrations of RDRs were found within the Kampinos Forest dune fields in central Poland (Warsaw Basin; Fig. 1), which is one of the largest and best-preserved examples of ESB inland dune fields (Kobendza and Kobendza, Reference Kobendza, Kobendza and Galon1958; Dłużewski and Woronko, Reference Dłużewski, Woronko, Migoń and Jancewicz2024).
This study aims to (1) characterize the morphometric properties of fossil RDRs within the Kampinos Forest; (2) reconstruct their developmental conditions in the context of Late Glacial environmental changes; and (3) evaluate the stabilized RDRs as a potential paleogeographical proxy within past aeolian systems.
Study area
The Kampinos Forest study dune fields are located within the Warsaw Basin (central Poland; Fig 1A), which is a vast depression 40 km long and 20 km wide (Fig. 1). The Basin was the initial section of the Warsaw–Berlin Ice-Marginal Valley, which was draining SIS meltwaters to the west during the last glacial period (LGM, MIS 2; Kozarski, Reference Kozarski1988; Marks, Reference Marks2002; Marks et al., Reference Marks, Bitinas, Błaszkiewicz, Börner, Guobyte, Rinterknecht, Tylmann, Palacios, Hughes, García-Ruiz and Andrés2021). The Warsaw Basin has a pre-Quaternary foundation that was fully shaped in form by the end of Vistulian glaciation (Baraniecka and Konecka-Betley, Reference Baraniecka, Konecka-Betley and Starkel1987). Twice, around 24 ka BP (Leszno Phase) and 20 ka BP (Poznań Phase), the northerly outflow of meltwaters was blocked by SIS lobes, leading to the development of an extensive complex of ice-dammed lakes in the Warsaw Basin (Wiśniewski, Reference Wiśniewski2003). Around 19 ka BP, these lakes were drained and the Vistula turned to the north, forming its present-day valley. Today’s valley is characterized by five levels of terraces (TI–TV), which were formed during subsequent cycles of fluvial erosion and aggradation. The Late Vistulian terraces TV–TIII rise 3–8 m above the level of the contemporary Vistula River, with two Holocene floodplain terraces below (Fig. 1C; Baraniecka and Konecka-Betley, Reference Baraniecka, Konecka-Betley and Starkel1987).
The studied dune field is a classic example of the development of dunes within an ice-marginal valley, where river incision has resulted in the drainage of terraces and further mobilization of very large amounts of sand by aeolian processes (Nowaczyk, Reference Nowaczyk1986; Woronko et al., Reference Woronko, Zieliński and Sokołowski2015; Moska et al., Reference Moska, Sokołowski, Jary, Zieliński, Raczyk, Szymak and Krawczyk2022; Łopuch et al., Reference Łopuch, Sokołowski and Jary2023a). The Kampinos Forest dune field consists of two groups of dunes, called the Northern Dune Belt (NDB) and the Southern Dune Belt (SDB; Fig. 1B), which are separated by a strip of wetlands developed within terrace TIII. Both belts are located primarily on terraces TV and TIV, which are considered to be the sand sources for these dunes (Łopuch and Jary, Reference Łopuch and Jary2023; Dłużewski and Woronko, Reference Dłużewski, Woronko, Migoń and Jancewicz2024). The NDB, which is undercut from the north by bends of the Vistula River, has dimensions of 20×3 km and an area of 27.1 km2. SDB has an area of 65.1 km2 and reaches a length of 31 km, with a width of ≤ 4 km. Both belts consist of transverse dunes, which formed under the influence of westerly winds, that were later transformed in various degrees into complex parabolic dunes, characteristic for the central ESB (Fig. 3; Łopuch et al., Reference Łopuch, Sokołowski and Jary2023a). In the SE parts of both dune fields, where they encounter terrace TIII, the dunes form several kilometer-long precipitation ridges that form the highest points of both belts. RDRs are common within the interdunes, and when they are absent the interdunal relief is composed of deflation residuals. Compared to the NDB, SDB dunes are lower and have more-curved ridges. SDB dunes are more closely spaced, and their distribution is less regular than in the NDB.
(A) First-order compound parabolic dunes. (B) Second-order simple parabolic dunes. (C) Precipitation ridge developed on the margin of terrace TIII. (D) Sequences of residual dune ridges. (E) Chaotic deflationary relief. (F) Channels and mid-channel bars of the braided river developed within terrace TIII. Hypsometric colors were used to highlight the braided river structures.

Although aeolian and fluvial sediments were not dated in the study area, at four nearby sites fossil soils and/or Vistula River terraces were dated using 14C (see location in Fig.1A; Table 1). Calibrated dates of the paleosol development on the terrace TV shows that it was progressively stabilizing from 19 ka to 15 ka cal yr BP, ultimately forming at the end of the Pleniglacial (Fig. 2; Konecka-Betley Reference Konecka-Betley1981, Reference Konecka-Betley1982; Manikowska, Reference Manikowska1991). Moreover, the age of terrace TIII became stable at the end of the Allerød (Schild, Reference Schild and Hensel1975). Therefore, the undated TIV terrace is probably only slightly younger than the TV terrace and slightly older than the TIII terrace. Dating of two intra-dune soils in Kamion/Kamion-Młodzieszynek sites points to a decrease in aeolian activity in the Bølling (discontinuous incipient soil dated 15,175–13,600 cal yr BP) and its complete cessation at the Late Allerød (continuous forest soil dated 13,245–12,041 cal yr BP). Both soils are separated by an aeolian unit indicating that the dunes in this area were active three times: before the Bølling, between Older Dryas and the Late Allerød, and in the Younger Dryas (Manikowska Reference Manikowska1985, Reference Manikowska1991).
Summary of 14C dates discussed in the text. All 14C results were calibrated in the OxCal program (Bronk Ramsay, Reference Bronk Ramsey2009) using the IntCal20 calibration curve (Reimer et al., Reference Reimer, Austin, Bard, Bayliss, Blackwell, Bronk Ramsey and Butzin2020).

Many authors have indicated that the third phase of aeolian activity was only a transformation of already existing dunes (Kobendza and Kobendza, Reference Kobendza, Kobendza and Galon1958; Baraniecka, Reference Baraniecka1982; Manikowska, Reference Manikowska1985, Reference Manikowska1991; Konecka-Betley, Reference Konecka-Betley1991). Because the dated dune at Kamion is a small single dune, it is reasonable to assume that it was much more susceptible to stabilization than the vast dune fields of Kampinos Forest. This view is supported by geomorphological analyses that suggest a continuous, single-phase development of the NDB, lasting about 4000–4500 years (Łopuch et al., Reference Łopuch, Sokołowski and Jary2023a; Łopuch and Jary Reference Łopuch and Jary2023). Thus, we assume that the time frame (end of Pleniglacial–Younger Dryas) of Kampinos Forest dune-field development was the same as in the Kamion/Kamion-Młodzieszynek site, but the dunes in the area have been developing continuously and aeolian activity in the Younger Dryas was low.
Materials and methods
To answer the raised research questions, an analysis of the Kampinos Forest aeolian landscape was undertaken based on a DEM with 1-m resolution. This model was produced by GUGiK and obtained from airborne laser scanning (LiDAR) data, which was performed with a vertical accuracy of 0.15 m and a point-cloud density of 4–7 points per m2 (Kurczyński et al., Reference Kurczyński, Stojek, Cisło-Lesicka and Wężyk2015). It was used to generate one digital elevation model (DEM) and two relative elevation models (REMs).
The DEM, with a resolution of 3 m, was generated using bilinear resampling. The reduction of resolution helped to generalize small-scale anthropogenic landforms. For analytical and visualization purposes, a multi-directional hillshade model was made using three different illumination azimuths (350°, 15°, 270°) and sun heights (70°, 55°, 60°) (Kokalj and Hesse, Reference Kokalj and Hesse2017). The use of this model reduced errors associated with the effect of azimuth biasing (Smith and Clark, Reference Smith and Clark2005).
A 3-m-resolution REM of dune heights was calculated by using an algorithm proposed by Baughmann et al. (Reference Baughmann, Jones, Bodony, Mann, Larsen, Himelstoss and Smith2018). It is based on a 30-fold DEM aggregation using minimum values of the surface elevation. In the next step, the DEM is linearly resampled to the original resolution (3 m). The final step is to subtract the original DEM from the DEM representing the minimum elevations. The final REM represents the relative height of the raster cell with respect to the lowest elevation observed within a 90-m radius.
A 3-m-resolution REM of the local elevation was calculated in relation to the Vistula River contemporary level. This model was developed to flatten the longitudinal gradient of the river in order to relate RDRs and dunes to their specific fluvial terraces. The first step to generate this model was to create a line that represents the center of the current in the Vistula River. Points were generated at 3-m intervals along this line, which then were used to determine their elevations by using a basic DEM. Furthermore, a REM was generated using the spline interpolation method, which was limited to the study area. This REM, representing the elevation of the nearest point on the river, was subtracted from the original DEM. This, in effect, resulted in a final REM of surface elevation above the Vistula River level. A second REM was also performed using the same methodology; in this instance, taking the paleochannel terrace TIII axis as a reference point.
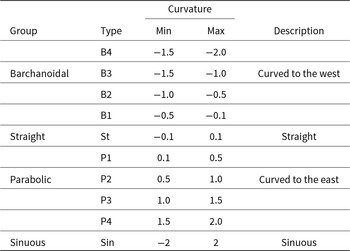
On the basis of the above models, the main-dune ridges and all RDRs in the study area were manually delineated. Then the length and curvature (the ratio of the length of the ridge counted along the crest to the straight line connecting its two ends) of the dunes and RDRs were measured. In consideration of the known dominant paleowind direction, ridges that stretched to the east received negative curvature-coefficient values, while ridges that stretched to the west received positive curvature-coefficient values. Ridges of variable curvature were manually identified and included within a “Sinusoidal” category. Dunes and RDRs were divided into eight classes according to Table 2.
Categories of residual dune ridges (RDRs).

Individual RDR heights and their base elevations in relation to the modern Vistula River were measured at points generated every 30 m along ridges. The spacing between RDRs was measured in profiles drawn perpendicular to selected RDR sequences (21 profiles in NDB and 30 profiles in SDB).
All GIS work was carried out in ArcMap 10.5.1. Statistical analysis was performed through Excel and STATISTICA software.
Results
Morphology of the RDRs
In the Kampinos Forest, 1904 RDRs were mapped, forming sequences of several to 40 parallel ridges located between specific dunes. Their bases lie 3.0–10.1 m above the modern Vistula riverbed. The RDRs are ∼0.1–3 m in height, with the vast majority ≤ 1 m. Their lengths vary from 12–1437 m, with a predominance of short ridges (79 m median), 75% of which are less than 130 m in length. The spacing between subsequent ridges varies widely, ranging 3–215 m, with an average of ∼30 m. Most of the RDRs are continuous and well preserved; however, due to dune migration, the initial (distal) parts of the sequences are often partially or completely buried (Fig. 3). The most-common ridges are straight (74.6%), while barchanoid and parabolic ridges are rare (3.3% and 3.5%, respectively), and the remaining ridges (18.6%) are mostly sinusoidal in shape. Some of them join (or separate) producing Y-shaped junctions (Fig. 4C). Close to the dune base, RDR courses mimic the dune-ridge courses, but moving away from the base in an upwind direction the RDRs have more varied courses (Figs. 3–5). Within the RDR sequences, we have not found evidence for deflationary bowls or troughs, nor any secondary depositional forms (Fig. 3).
(A) Residual dune ridges (RDRs) within the Northern Dune Belt. (B) RDRs categorized by curvature category. (C) A close-up of the RDR sequences. Black circles mark the junctions within the RDRs. Black arrows on the elevation profiles indicate RDRs.

(A) Residual dune ridges (RDRs) within the Southern Dune Belt. (B) RDRs categorized by curvature category. (C) A close-up of the RDR sequences. Black circles mark the junctions within the RDRs. Black arrows on the elevation profiles indicate RDRs.

The spatial distribution of RDRs and their morphometric parameters differ significantly within the two dune belts. Within the NDB, we identified 448 RDRs (23.5%), almost all of which are located in the eastern part, where the dune field enters terrace TIII (Fig. 4A). For this reason, the average height of the RDR base in relation to the level of the Vistula is ∼4.5 m. The RDRs form sequences of ≤ 13 RDRs, and in most cases only 8–10 ridges are preserved. In several places, RDRs are preserved along the entire length of the parabolic dune arms, with only a small part of the sequence being buried under subsequent dunes.
The NDB is characterized by a higher proportion of barchanoid (6.3%) and parabolic (5.5%) ridges than within the SDB, although straight and sinuous ridges still dominate (63.2% and 14.5% respectively; Fig. 4B). Overall, the RDRs are considerably longer than those within the SDB, ranging 20–1436 m in length, with an average of 177 m. The spacing measured in the 21 profiles averages 39 m (3–96 m).
There are 1456 RDRs within the SDB, comprising 76.5% of all identified ridges. Like the NDB, most of them reside in the eastern and southern parts of the dune field, although their spatial distribution is much more regular (Fig. 5A). Most of these ridges developed on terrace TIV, with a base of 5.5–7 m above the modern Vistula River level. These sequences are minimally preserved, hence the low average length of 98 m. An exception to this is found within the central part of the SDB, where the most extensive sequences of RDRs in the study area are located (≤ 40 ridges; Fig. 5C). Considering the curvature, straight RDRs (80.1% of RDRs; Fig. 5B) dominate within the SDB. Sinusoidal ridges represent 14.5% of RDRs, with barchanoid and parabolic ridges occurring only as accessory features (2–3%). RDR spacing, as measured from 30 profiles, averages 36 m (range 9–215 m).
Variation in the morphometry of RDRs located in the two dune belts is reflected in their length (Fig. 6A) and base–height relationship to the modern riverbed of the Vistula (Fig. 6C), while the height of RDRs (Fig. 6B) and the spacing between their ridges (Fig. 6D) are similar in both areas. The length of an individual RDR is determined mainly by the length of the dune ridge behind which it is located as well as by the fragmentation due to post-depositional processes and subsequent burial under other dunes. This is indicated by the lowest lengths of the straight RDRs, which are discontinued fragments of longer RDRs, whose courses are mostly sinusoidal. Conversely, sinusoidal RDRs likely result from merging of much shorter barchanoid and parabolic RDRs (Fig. 6E). RDR shape shows no difference between the RDR base elevation and absolute height, although straight RDRs are generally the highest in relief and located in the highest positions (Fig. 6F and G). In both dune fields, there is no relationship between RDR height and spacing (Fig. 6H).
(A–G) Morphometric properties of measured residual dune ridges (RDRs) in relation to dune belt and RDR shape classification. (H) There is no relationship between the height of the RDRs and their spacing. m.a. = meters above; NDB = Northern Dune Belt; SDB = Southern Dune Belt.

Morphology of the dunes
In all, 1058 dunes were mapped in the study area, including 366 in NDB and 692 in SDB. The dune-ridge mean length is 451 m, varying slightly between the two fields (472 m in NDB and 439 m in SDB). Most dunes (SBD and NDB combined) are parabolic (85.8%), with fewer dunes possessing sinuous (7.2%), barchanoid (5.4%), or straight (1.6%) ridges. Due to the high proportion of parabolic dunes, the mean curvature is 0.94 (0.78 in NDB and 1.03 in SDB), which is much higher than the curvature of RDRs, which average 0.007 (Fig. 7).
Curvature of residual dune ridges (RDRs) and dunes within the Kampinos Forest dune field. NDB = Northern Dune Belt; SDB = Southern Dune Belt.

Discussion
Because of the high dynamics of the aeolian environment and the characteristics of the specific research methods, paleoenvironmental reconstructions based on studies of Late Pleistocene dunes present many difficulties. Optically stimulated luminescence (OSL) dating of the dune sands provides only a general picture of the chronology of the dunes, which does not allow us to link their development to short-term climatic oscillations (Bernhardson, Reference Bernhardson2018; Bertran et al., Reference Bertran, Andrieux, Bateman, Fuchs, Klinge and Marembert2020). Moreover, OSL dates indicate the time of deposition of the dunes, which is not sufficient to determine the duration of the aeolian processes (Bernhardson et al., Reference Bernhardson, Alexanderson, Bjorck and Adolphi2019). In contrast, the considerably more accurate 14C dates of the intra-dune paleosols can be used only in specific profiles (Bertran et al., Reference Bertran, Andrieux, Bateman, Fuchs, Klinge and Marembert2020) and are postdated in relation to the stabilization of the dunes (Kappler et al., Reference Kappler, Kaiser, Küster, Nicolay, Fülling, Bens and Raab2019; Sokołowski et al., Reference Sokołowski, Moska, Zieliński, Jary, Piotrowska, Raczyk and Mroczek2022). Finally, the chronology of the aeolian processes within the central ESB is highly variable and asynchronic, as indicated by the different ages of dunes situated close to each other (Hilgers, Reference Kaiser, Hilgers, Schlaak, Jankowski, Kühn, Bussemer and Przegiętka2009; Moska et al., Reference Moska, Jary, Sokołowski, Poręba, Raczyk, Krawczyk and Skurzyński2020, Reference Moska, Sokołowski, Jary, Zieliński, Raczyk, Szymak and Krawczyk2022). Hence, identification of RDRs that provide information on the possible cause, age, and course of dune transformation and stabilization offers new possibilities in the reconstruction of the dunes of the central ESB. A similar approach has already been successfully applied in tracking dune stabilization of contemporary dunes of North America (Wolfe and Hugenholtz, Reference Wolfe and Hugenholtz2009).
Kampinos Forest dune field RDRs in comparison with present-day counterparts
The nearly 2000 identified RDRs within the Kampinos Forest dune field makes this the largest documented accumulation of such landforms so far. It is also the second time, following the 200-year-old RDRs on the Great Plains (Wolfe and Hugenholtz, Reference Wolfe and Hugenholtz2009), when they have been identified in fossil form, as features not directly connected with active aeolian systems. However, considering the Late Glacial age of central ESB dunes, the identified RDRs are several times older than those described from North America. Their age must exceed 10,000 years, because the dune fields of the central ESB have been completely stabilized by vegetation since at least the Boreal period (10 ka BP; Sokołowski et al., Reference Sokołowski, Moska, Zieliński, Jary, Piotrowska, Raczyk and Mroczek2022). During this interval, the dunes might have been affected by forest fires (Moska et al., Reference Łopuch, Zieliński and Jary2023b) or anthropogenic influences, which were common within the central ESB (Dylikowa, Reference Dylikowa1958; Twardy et al., Reference Twardy, Forysiak and Kittel2018; Ninard et al., Reference Ninard, Łapcik and Uchman2023). Although it is accepted that human effects on dune transformation have been limited within the Kampinos Forest dune field (Kobendza and Kobendza, Reference Kobendza, Kobendza and Galon1958), the short longevity of RDRs as suggested by Levin et al. (Reference Levin, Tsoar, Herrmann, Maia and Claudino-Sales2009) is not necessarily a strict rule. Their survival may depend on, for example, the rate of RDR stabilization and/or a permanent rise of groundwater level at the cessation of aeolian activity. Lindhorst and Reimann (Reference Lindhorst and Reimann2021) noted that RDRs can survive in temperate climates until being buried under the next dune, which also can be also applied in the case of inland cold-climate dune fields.
Despite their age, RDRs in the Kampinos Forest do not differ in their morphometric parameters from the RDRs described from active dune fields in Brazil and Denmark. The RDR heights within Kampinos Forest usually are around 0.5–0.7 m and occasional measured heights greater than 1 m mostly can be attributed to a methodological error when using an automatic-height measurement. The length of RDRs varies from a few meters to 1500 m, with the majority of RDRs possessing lengths less than 150 m. The lack of clear deflationary troughs crossing individual RDRs suggests that the short length and fragmentation of many ridges did not result from deflation, but rather from an amalgamation of ridges and their incomplete formation (as pointed out by Lindhorst and Reimann, Reference Lindhorst and Reimann2021). The non-uniform formation of RDRs at the bases of many dunes is also evinced by the Y-shaped junctions found within many ridges (Fig. 4C). A larger fragmentation of the RDRs is typical for the largest, most complex dunes, whose sinuous ridges indicate uneven dune migration rates between the two episodes of RDR development (Fig. 5C). In contrast, the greatest continuity is characteristic for RDRs situated at the rear of small simple dunes, located in the NDB and SDB central parts.
The mean spacing of the study RDRs is 30–35 m, which is two times greater than the spacing recorded along the Danish coast (Lindhorst and Reimann, Reference Lindhorst and Reimann2021) and 1.5 times greater than that reported from northern Brazil (Levin et al., Reference Levin, Tsoar, Herrmann, Maia and Claudino-Sales2009). Simultaneously, highly consistent spacing measurements indicate that the individual-sequence record repetition is complete in both studied dune belts. This indicates that the phenomenon responsible for the formation of RDRs within the Kampinos Forest was cyclic and long-lasting, given that the much shorter sequences of currently emerging RDRs have been developing for 300–600 years (Levin et al., Reference Levin, Tsoar, Herrmann, Maia and Claudino-Sales2009; Lindhorst and Reimann, Reference Lindhorst and Reimann2021). Regrettably, our inability to establish an exact migration rate for ESB dunes and establish their coeval climatic conditions hindered a formation-rate reconstruction of Kampinos Forest RDRs. Nevertheless, it is reasonable to estimate a minimum duration of formation for these sequences at several hundred years.
In contrast to the described Brazilian RDRs, the shapes of many Kampinos Forest RDRs do not reflect the present shapes of their associated dune bases. This phenomenon is particularly evident within the concave initial parts of many sequences, which are the areas farthest from the bases of the stabilized dunes. A similar discrepancy between the shape of the RDRs and the shape of the actual dune crest can be found in Denmark, where transverse dunes have been intentionally stabilized by human-introduced grasses and shrubs and finally transformed into fixed parabolic dunes (Lindhorst and Reimann, Reference Lindhorst and Reimann2021). This finding indicates that the RDRs of the Kampinos Forest recorded this dune-type transformation in the area during the Late Glacial period. The shapes of many RDRs thus confirm the view that transverse dunes had transformed into parabolic dunes within the central ESB (e.g., Wojtanowicz, Reference Wojtanowicz1969; Nowaczyk, Reference Nowaczyk1986; Zieliński, Reference Zieliński2016; Łopuch et al., Reference Łopuch, Sokołowski and Jary2023a, b).
Several of the studied sequences show a transition from concave to convex RDRs (Fig. 8), having the highest similarity with the dunes of the Great Plains, where barchans have transformed into parabolic dunes (Wolfe and Hugenholtz, Reference Wolfe and Hugenholtz2009). This observation, along with the sinusoidal shape of many dunes and RDRs, leads to the conclusion that the studied dunes at the beginning of the stabilization process were barchans or barchanoid ridges. This was unexpected because barchans were never discussed as initial dunes within the ESB. Perhaps at the end of the Late Pleniglacial, under presence of discontinuous or sporadic permafrost (and therefore low sand supply to the aeolian system; Starkel et al., Reference Starkel, Michczyńska, Gębica, Kiss, Panin and Perşoiu2015; Zieliński et al., Reference Zieliński, Sokołowski, Woronko, Jankowski, Fedorowicz, Zaleski, Molodkov and Weckwerth2015) and limited vegetation cover (described as subarctic steppe; Latałowa, Reference Latałowa, Dybova-Jachowicz and Sadowska2003, Marks et al., Reference Marks, Makos, Szymanek, Woronko, Dzierżek and Majecka2019), barchans may have been widespread dunes. Subsequently, following improvement of climatic conditions in the Bølling–Allerød and an increase in sand supply, they merged and transformed into (sometimes sinuous) transverse dunes that are common within the central ESB. However, these observations require further investigations and are not conclusive.
Residual dune ridge (RDR) sequences indicating the transformation of barchans into parabolic dunes (with a stage of transverse dunes). In the case of single dunes (A, B), the sequences are simpler and shorter, but their downwind parts are commonly buried by subsequent dunes. In the case of complex dunes (C, D), the sequences are more complete and longer, suggesting a long-term balance between dune migration and stabilization.

RDR development and preservation conditions within the cold-climate dune fields of the European Sand Belt
Previously presented models have linked of RDR development to periodic flooding of the dune field (Claudino-Sales and Peulvast, Reference Claudino-Sales, Peulvast and Allison2002; Levin et al., Reference Levin, Tsoar, Herrmann, Maia and Claudino-Sales2009), groundwater-level fluctuations (Lindhorst and Reimann, Reference Lindhorst and Reimann2021), or seasonal variation in wind directions (van Dieren, Reference van Dieren1934). The latter is very unlikely within the ESB, which was formed under the influence of a stable (north-) westerly circulation (Nowaczyk, Reference Nowaczyk1986; Goździk, Reference Goździk2007; Łopuch et al., Reference Łopuch, Sokołowski and Jary2023a). Hence, genesis of the RDRs in this area must be attributed to an overall increase of environment wetness, promoting dune-base colonization by vegetation, thus protecting the emerging RDRs from deflation (as proposed by Levin et al., Reference Levin, Tsoar, Herrmann, Maia and Claudino-Sales2009, and by Lindhorst and Reimann, Reference Lindhorst and Reimann2021).
ESB dune development is associated with cold and dry climatic conditions that characterized the Late Glacial period, which was a time when strong winds and sparse vegetation favored aeolian processes (Zeeberg, Reference Zeeberg1998; Goździk, Reference Goździk2007; Bateman, Reference Bateman2008; Zieliński et al., Reference Zieliński, Sokołowski, Woronko, Jankowski, Fedorowicz, Zaleski, Molodkov and Weckwerth2015, Reference Zieliński, Sokołowski, Fedorowicz, Woronko, Hołub, Jankowski, Kuc and Tracz2016; Sokołowski et al., Reference Sokołowski, Moska, Zieliński, Jary, Piotrowska, Raczyk and Mroczek2022; Wolfe et al., Reference Wolfe, Demitroff, Neudorf, Woronko, Chmielowska-Michalak and Lian2023). However, RDR presence should be associated with dune-stabilization processes, which took place mainly during periods of temporal climate-warming and amelioration during the Bølling and Allerød interstadials within the central ESB (Moska et al., Reference Moska, Sokołowski, Jary, Zieliński, Raczyk, Szymak and Krawczyk2022; Sokołowski et al., Reference Sokołowski, Moska, Zieliński, Jary, Piotrowska, Raczyk and Mroczek2022). An overall humidity increase must have been particularly pronounced across the vast Vistula valley, facilitating the development of RDRs within the Kampinos Forest dune field. High discharge of the Vistula River during NDB and SDB dune stabilization is evinced by the presence of well-preserved mid-channel bars that indicate a braided river, which are located on terrace TIII and are clearly visible on the DEM (Fig. 3). Braided-river structures are partially buried under NDB dunes, which have overridden themselves along the margin of terrace TIII, forming a few-kilometers-long precipitation ridge (Fig. 4). Its extent indicates that the migration of dunes was slowed by contact with unfavorable substrates (e.g., wet; Cooper, Reference Cooper1958; Hesp et al., Reference Hesp, Martinez, da Silva, Rodríguez-Revelo, Gutierrez, Humanes and Laínez2011).
It is thought that braided rivers throughout north-central Europe during the Late Glacial were characterized by a nival regime, with maximum flow related to spring snowmelt events (Kasse, Reference Kasse1997; Starkel et al., Reference Starkel, Michczyńska, Gębica, Kiss, Panin and Perşoiu2015). It is possible that such singular and prominent maximum-flow events resulted in seasonal groundwater-level rise with corresponding increase in capillary movement, fixing the dune bases and leading to the development of RDRs. It cannot be ruled out that dune bases may have been flooded during peak flows. A terrace TIII flood simulation indicates that a large part of the NDB dunes should have been flooded when the river water level rose by 1 m (Fig. 9). Most of the RDRs within the NDB are within the extent of such flooding, suggesting that the development of RDRs in this area was strictly related to terrace TIII.
Simulated Kampinos Forest dune field flooding in the scenario of a water-level increase to the braided river paleochannel system located on terrace TIII. RDRs = residual dune ridges.

This inference is further evinced by the homogenous elevation of the base of these RDRs (Fig. 6C). For the SDB case, this flooding would have to have reached 3–4 m above the level of the terrace TIII paleochannel (Fig. 9). This seems unlikely, so we judge that within the SDB, in general, the increase in groundwater level may have been more significant. This increase is suggested by a more uniform spatial distribution of RDRs within the SDB (Fig. 5) and the greater height variations at which individual RDRs are located (Fig. 6C). The presence of some RDRs within the highest terrace (TV) implies that RDR genesis should not be linked to the characteristics of a specific fluvial terrace, but to an overall increase in moisture. Therefore, the different pattern of RDR development in the two dune belts would not be a consequence of variable genesis, but rather a consequence of incomplete preservation. At the same time, this does not rule out the possibility that some of the RDRs were caused by flooding while others resulted from rising groundwater, as illustrated by an assessment of flooding extent within the Kampinos Forest (Fig. 9).
It appears that, in addition to overall high moisture, the second condition necessary for RDR development was the high density of large dunes (≤ 20 m high). This second condition is evident in both dune fields, where RDRs are located primarily in interdunes that separate the largest complex parabolic dunes (Figs. 4 and 5). This high density of dunes increased the surface roughness, resulting in an increase of friction within the so-called internal boundary layer (Pye and Tsoar, Reference Pye and Tsoar2009; Jerolmack et al., Reference Jerolmack, Ewing, Falcini, Martin, Masteller, Philips, Reitz and Buynevich2012). Under such conditions, the surface paleowind was not strong enough to transform or deflate the emerging, progressively colonized by vegetation RDRs. This hypothesis is supported by the fact that within the Kampinos Forest the RDRs and fixed dunes form well-defined complexes (Fig. 5C) that are characterized by a specific sequence of forms, starting from barchanoid RDRs and extending through a long series of straight and/or sinusoidal ridges that evolved in the downwind direction into parabolic ones. RDR sequences are enclosed by stabilized parabolic dunes that have ridge curvatures several times greater than the curvature of RDRs located at their rear (Fig. 7). The continuity and completeness of these sequences demonstrate minor deflation of the RDRs, confirming the protective influence of surface topography towards their construction. Nevertheless, minor accretion of RDRs due to local sand redeposition (Lindhorst and Reimann, Reference Lindhorst and Reimann2021) or human-induced erosion cannot be ruled out.
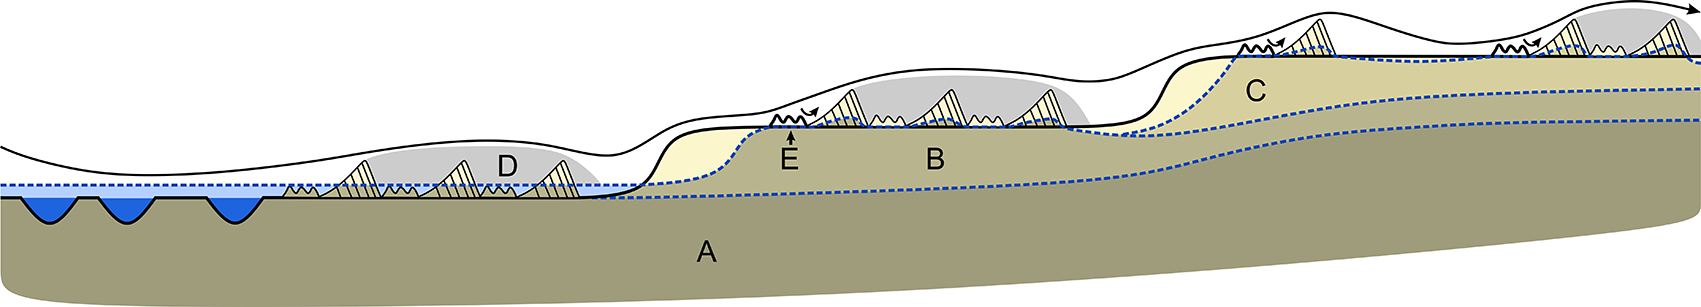
Both aforementioned factors were also crucial for the preservation of RDRs (Fig. 10). Climatic ameliorations increased sand cohesion, preventing RDRs from rapid deflation. That point is evident when RDRs are compared with dune ridges, the latter of which include numerous deflation troughs (Fig. 3). In contrast, the effect of RDR shielding from surface winds on RDR survival is evinced by the complete absence of RDRs within the windward parts of both dune fields. That absence is noticed within parabolic complexes as well, which are not well protected from westerly winds by other dunes (Figs. 4 and 5). In open areas with a low density of dunes, the wind power was sufficiently high to produce chaotic deflationary relief (Fig. 3).
A conceptual model of residual dune ridge (RDR) development within the Late Glacial cold-climate dune fields. (A) Initial groundwater zone. (B) Groundwater zone after the flood. (C) Groundwater zone after climate amelioration. (D) Zone of limited deflation caused by high dune density. (E) Deflated residual dune ridges. Blue dashed lines indicate (ground)water levels in scenarios A–C.

Unfortunately, it is not possible to determine whether areas currently lacking in RDRs once had them previously. Overall, the RDRs within the highest terrace (TV) were most susceptible to deflation, as this terrace would have been submerged only during the most severe flooding (Fig. 9). RDR preservation potential was higher on lower terraces. Vegetation had more favorable conditions for growth when in close proximity to a groundwater table, in effect permanently preserving the RDRs. Such preservation was not possible on the highest terraces, where during droughts the RDRs were not thus protected and subsequently degraded. A combination of open topography and substrate wetness therefore appears to have been necessary not only for the development of RDRs, but also for their preservation.
Warsaw Basin RDRs in the Late Glacial climatic oscillation context
The Late Glacial period was characterized by a sequence of climatic oscillations that led to changes in aeolian process intensity. Although ESB dunes had been developing for about 4000–5000 years, from the Oldest Dryas stadial to the Boreal period (e.g., Sokołowski et al., Reference Sokołowski, Moska, Zieliński, Jary, Piotrowska, Raczyk and Mroczek2022), RDRs document only a few hundred years of their transformation and stabilization. The trigger responsible for RDR development was warming and wetting of the climate. However, establishing a timeframe for this phenomenon remains a challenging task. It must be assumed that under the harsh conditions of the Oldest Dryas stadial, RDR formation was not possible due to very limited vegetational cover along with low river runoff (Latałowa, Reference Latałowa, Dybova-Jachowicz and Sadowska2003; Starkel et al., Reference Starkel, Michczyńska, Gębica, Kiss, Panin and Perşoiu2015; Zieliński et al., Reference Zieliński, Sokołowski, Woronko, Jankowski, Fedorowicz, Zaleski, Molodkov and Weckwerth2015; Marks et al., Reference Marks, Makos, Szymanek, Woronko, Dzierżek and Majecka2019). Dating of the soils covering terraces TIII–TV, on which the RDRs are located, point to the development of RDRs between the early Bølling and Late Allerød (Fig. 2). This period was marked by gradual permafrost degradation (Błaszkiewicz, Reference Błaszkiewicz2011; Woronko et al., Reference Woronko, Zieliński and Sokołowski2015) and a transformation of most central European river systems (Starkel et al., Reference Starkel, Michczyńska, Gębica, Kiss, Panin and Perşoiu2015). Fluvial runoff likely was high, particularly after spring snowmelt, and boosted in effect by weak water infiltration in still-frozen upper catchments. Similar processes are observed in today’s Kobuk River valley in Alaska, which hosts one of the largest cold-climate dune fields on Earth (Dijkmans and Koster, Reference Dijkmans and Koster1990).
RDR stabilization was favored by repeated flooding and increased vegetation density, thus registering the initiation of Warsaw Basin dune transformation. The possible development of RDRs during the Bølling–Late Allerød is also supported by the repeated short-term stabilization of dunes reported for this period (Sokołowski et al., Reference Sokołowski, Moska, Zieliński, Jary, Piotrowska, Raczyk and Mroczek2022). Decline of the Allerød, which is highlighted in the Warsaw Basin by well-developed forest soil (Manikowska, Reference Manikowska1995), probably was the last stage of dune stabilization and RDR formation. This is also confirmed by the fact that the dunes entered only a few hundred meters into terrace TIII, therefore their stabilization must have been not much later than stabilization of the terrace surface, which occurred in Late Allerød time (Fig. 2).
RDRs as potential climate proxies within past aeolian systems
RDRs have been used as proxies of past El Niño oscillations. Nevertheless, due to the irregular formation of individual ridges, they cannot be used for this purpose (Levin et al., Reference Levin, Tsoar, Herrmann, Maia and Claudino-Sales2009). Lindhorst and Reimann (Reference Lindhorst and Reimann2021) noted that RDRs can be used to indicate years in which average precipitation was noticeably higher. However, such reconstructions are challenging even in contemporary RDRs and likely impossible to do in RDRs that formed several thousand years ago. The OSL dating error of ±1000 years for the Late Glacial samples makes it impossible to correctly trace dune stabilization processes lasting only several hundred years.
Despite this, RDRs have great potential for reconstructing past aeolian systems. Their presence indicates an interaction between dunes and the groundwater table, as in the case of highlighting the persistent rise of the groundwater table within the ESB. Simultaneously, the repetitive nature of these forms and their uniform spacing point to a cyclical occurrence of humid periods, potentially allowing reconstruction of past flood frequency. In addition, dating ridges that begin a sequence makes it possible to determine the timing of climate change and timing of dune stabilization. This offers new possibilities in comparison with OSL dating of aeolian sediments, which allow only a determination of the final moment of dune deposition. Altogether, RDRs also indicate the presence of a temporal equilibrium between wind erosion and vegetational dynamics associated with sand stabilization. Finally, long sequences of RDRs make it possible to trace the transformation of dunes over time. Overall, RDRs offer great potential use as indicators of change that occurred in past aeolian environments.
Conclusions
This study demonstrated that residual dune ridges (RDRs) are much more permanent landforms than previously thought. They can also be identified within past aeolian systems. Because of their specific genesis, RDRs provide new research avenues when acquiring information about the environmental state during RDR formation, granting them paleogeographic significance. Performed geomorphological analyses allows the following conclusions. (1) Nearly 2000 Late Glacial RDRs have been identified within the Warsaw Basin, indicating a hitherto unknown possibility of their long-term preservation; their morphometric parameters do not differ from RDRs currently developing in Brazil and Denmark. (2) The identified RDRs document the transformation of transverse dunes into parabolic dunes. In some cases, the concave shapes of the initial RDRs indicate that the barchans were primary dunes, but this requires further confirmation. (3) The Warsaw Basin RDRs were probably formed due to climatic amelioration of the Allerød interstadial, which led to a general rise of the groundwater table, as well as an increase in flooding frequency and magnitude. (4) Most of the RDRs were preserved within the interdunes, pointing to the protective effect of the rugged topography and dune-field internal boundary layer on them. RDRs have been deflated in the areas of low dune density. (5) The identified RDRs form complete sequences comprised of up to 40 ridges, evincing the long-term process of ESB dune field stabilization. (6) RDRs are good indicators of environmental changes that occurred in their aeolian environment. Potentially, these landforms can serve as a source of information on flood frequency and the migration rate of dunes.
Acknowledgments
The authors wish to express their gratitude to Professor M.N. Demitroff (Stockton University) for the insightful comments on the manuscript. We would also like to thank Nicholas Lancaster, Pascal Bertan, and an anonymous reviewer for their helpful reviews. This work was supported by the National Science Centre, Poland (grant number 2021/41/N/ST10/00350).


 Open access