

Globally, overweight and obesity among children and adolescents rose by 47·1 % between 1980 and 2013 in both developed and developing countries( Reference Ng, Fleming and Robinson 1 ). Because of the serious health problems (CHD, high blood pressure, stroke, type 2 diabetes, metabolic syndrome, etc.) associated with overweight and obesity( 2 , Reference Must, Jacques and Dallal 3 ) and the negative impact on quality of life( Reference Buttitta, Iliescu and Rousseau 4 – Reference He, Zhu and Luo 9 ), overweight and obesity has become a major public health issue for children and adolescents.
To assess overweight and obesity, BMI (BMI=[weight (kg)]/[height (m)]2) is used as the most common proxy measure of weight status for both clinical and epidemiological studies( Reference Himes 10 ). For children and adolescents, BMI has been recommended as an appropriate single indicator for assessing overweight and obesity( Reference Krebs, Himes and Jacobson 11 , Reference Cole, Bellizzi and Flegal 12 ).
Although direct measurement of height and weight is the ‘gold standard’ to obtain BMI, in large-scale epidemiological surveys, such as the Youth Risk and Behavior Surveillance Study (YRBSS)( 13 ) and the National Health Interview Surveys (NHIS)( 14 ), the prevalence of overweight and obesity is often estimated using BMI derived from self-reported height and weight (BMIsr) for practical and financial reasons, instead of BMI based on measured height and weight (BMIm).
It should be noted that the purpose of using BMIsr is either for assessing a person’s weight status at the individual level or for monitoring the prevalence of weight status at the population level( Reference He 15 ). Specifically, for screening individuals with overweight and obesity at the individual level, researchers care about the diagnostic accuracy (e.g. sensitivity and specificity)( Reference Šimundić 16 ) of using BMIsr. For example, the sensitivity of using BMIsr is the probability of correctly identifying an individual as being overweight/obese when indeed that is the case( Reference He, Cai and Fan 17 ). However, at the population level, researchers care about the difference between the prevalence rate derived from BMIsr and the prevalence rate derived from BMIm.
In the previous research literature there are several studies( Reference Fonseca, Silva and Matos 18 – Reference Yoong, Carey and D’Este 20 ) that have different recommendations for using BMIsr at the individual and population levels, respectively. For instance, Fonseca et al.( Reference Fonseca, Silva and Matos 18 ) suggested that BMIsr was not accurate at the individual level for assessing weight status, but it might be a simple and valid tool for estimating the prevalence of overweight and obesity at the population level. Thus, the results and implications of using BMIsr could vary depending on the level (individual v. population) at which BMIsr is used.
Currently, a meta-analysis about the accuracy of using BMIsr at the individual level has been conducted( Reference He, Cai and Fan 17 ). The study used a special meta-analytic method, diagnostic meta-analysis( Reference Leeflang 21 ), which is specially designed for synthesizing effect sizes of diagnostic test accuracy, and showed that for screening children and adolescents with overweight and obesity, the use of BMIsr presented a pooled sensitivity and specificity of 0·76 and 0·96, respectively( Reference He, Cai and Fan 17 ). However, because the results and implications of using BMIsr can be different depending on its application at individual or population level( Reference Fonseca, Silva and Matos 18 – Reference Yoong, Carey and D’Este 20 ), and the analysis methods are also quite different for analyses intended for these two different levels( Reference He, Cai and Fan 17 , Reference Shaffi 22 , Reference He, Cai and Fan 23 ), there is a strong need to conduct a meta-analysis at the population level for understanding the suitability of using BMIsr for monitoring the prevalence of overweight and obesity among children and adolescents.
To date, there have been dozens of studies examining the accuracy of using BMIsr to estimate the prevalence of overweight and obesity for children and adolescents. Many studies have reported that, when compared with the estimated prevalence based on BMIm, children and adolescents tend to over-report height and under-report weight, resulting in a lower BMI that leads to underestimation of the prevalence of overweight and obesity( Reference Aasvee, Rasmussen and Kelly 24 – Reference Jansen, Van de Looij-Jansen and Ferreira 34 ). In contrast, some other studies exist reporting either no difference( Reference Fonseca, Silva and Matos 18 , Reference Chan, Choi and Nelson 35 – Reference Rodrigues, Gonçalves-Silva and Pereira 38 ) or a higher prevalence from BMIsr-based estimation( Reference Enes, Fernandez and Voci 39 ). As a result, the suitability of using BMIsr to estimate the prevalence remains controversial. Some studies have suggested that BMIsr should be used with caution( Reference Charalampos, Michael and Antonia 28 , Reference Yoshitake, Okuda and Sasaki 37 , Reference Seghers and Claessens 40 , Reference Zhou, Dibley and Cheng 41 ) and a correction should be applied to the self-reported data( Reference Brettschneider, Rosario and Ellert 27 , Reference Drake, Longacre and Dalton 29 , Reference Giacchi, Mattei and Rossi 31 , Reference Jansen, Van de Looij-Jansen and Ferreira 34 , Reference Enes, Fernandez and Voci 39 , Reference Zhou, Dibley and Cheng 41 – Reference Ghosh-Dastidar, Haas and Nicosia 45 ), or not to use BMIsr at all( Reference Hauck, White and Cao 32 , Reference Himes, Hannan and Wall 33 , Reference Beck 46 , Reference Ekström, Kull and Nilsson 47 ). On the other hand, there are also studies supporting the validity of BMIsr use in epidemiological studies for children and adolescents( Reference Fonseca, Silva and Matos 18 , Reference Aasvee, Rasmussen and Kelly 24 , Reference Chan, Choi and Nelson 35 , Reference Domingues, Silva and de Matos 36 , Reference Rodrigues, Gonçalves-Silva and Pereira 38 ).
Considering the inconsistency among the existing literature on the accuracy of BMIsr for such use and the inevitable use of BMIsr in future studies, especially in large-scale surveys, we decided to conduct a meta-analysis of the existing literature on this issue. Such a systematic synthesis would not only allow researchers to have a better understanding about the degree of discrepancy, or lack thereof, between BMIsr-based and BMIm-based prevalence rates of overweight and obesity among children and adolescents, but would also allow researchers to understand the roles of some potential moderators (e.g. gender( Reference Aasvee, Rasmussen and Kelly 24 , Reference Brettschneider, Rosario and Ellert 27 , Reference Pérez, Gabriel and Nehme 44 , Reference De Vriendt, Huybrechts and Ottevaere 48 ) and age( Reference Aasvee, Rasmussen and Kelly 24 , Reference Beck 46 , Reference Wang, Patterson and Hills 49 , Reference Tienboon, Wahlqvist and Rutishauser 50 )).
Therefore, by doing a systematic quantitative review of the research literature at the population level, the aims of the current meta-analysis were to estimate the overall discrepancy between BMIsr-based prevalence and BMIm-based prevalence of overweight and obesity for children and adolescents, and to determine whether, and to what extent, some potential factors (e.g. sample and/or study characteristics such as gender and age) could have affected the difference between the estimated prevalence rates based on BMIsr and BMIm, respectively.
Methods
It should be noted that because the current meta-analysis was conducted based on the literature search results of the previous diagnostic meta-analysis for the accuracy of using BMIsr at an individual level( Reference He, Cai and Fan 17 ), there are some overlaps (e.g. studies included) between the current meta-analysis and the previous one. On the other hand, these two meta-analysis studies differ substantially in multiple aspects, including research aims, methods, results and related implications for future studies, as discussed above.
Literature search
Following the PRISMA (Preferred Reporting Items for Systematic Reviews and Meta-Analyses) guidelines( Reference Moher, Liberati and Tetzlaff 51 ), the search was conducted in three databases, namely PubMed, Web of Science and EBSCOhost (all sub-databases used). The search covered the research literature up to September 2016. The keywords used were: (self-reported OR self-report) AND (height and weight OR BMI OR BMI) AND (children OR adolescents OR kids OR youngsters OR youth OR pediatric). Moreover, in a follow-up search, from September to October 2016, we also used Google Scholar and find additional relevant articles that were not contained in the databases searched above. In addition, when one article was found to meet the selection criteria, the references cited in the selected article were also checked for potential articles.
Selection criteria
To be included in the current meta-analysis, a study had meet the following criteria: (i) be published as a peer-reviewed journal article; (ii) be published in English; (iii) age of the participants was no more than 21 years, to be consistent with the Stages of Adolescent Development( Reference Spano 52 ); (iv) be an observational study (longitudinal or cross-sectional design); and (v) report prevalence rates of overweight and/or obesity using both BMIsr and BMIm, or there was sufficient information in the study to allow the calculation of the rates from BMIsr and BMIm.
Assessment of quality
The first two authors independently assessed the quality of the selected articles. Because the meta-analysis concerned the comparison of the prevalence rates based on two methods (BMIsr and BMIm), we chose the Revised Tool for the Quality Assessment of Diagnostic Accuracy (QUADAS-2)( Reference Whiting, Rutjes and Westwood 53 ) to assess the quality of the selected studies. The QUADAS-2 identifies four key domains, namely ‘selection of patients’, ‘index test’, ‘reference standard’ and ‘flow and timing’. Specifically, in the current meta-analysis, ‘selection of patients’ assesses the sample representativeness based on the sample selection in a study; ‘index test’ and ‘reference standard’ are BMIsr and BMIm, respectively, because we assessed the accuracy of BMIsr by using BMIm as the reference in the current meta-analysis; and ‘flow and timing’ concerns the time interval between the index test (i.e. BMIsr) and the reference standard (i.e. BMIm). These four domains were combined to assess the quality of the studies included. After obtaining the independent ratings of quality, some minor disagreements were resolved through discussion between the two evaluators.
Extraction of data
The first two authors independently extracted the data, and a very limited number of coding discrepancies between the two coders were later resolved through discussion within the research team. The information coded in our current meta-analysis was: (i) the last name of the first author; (ii) publication year; (iii) country; (iv) sampling methods; (v) sample size; (vi) age; (vii) gender; (viii) weight status measured (overweight, obesity, mixed); (ix) weight status screening tool (WHO, Centers for Disease Control and Prevention (CDC), International Obesity Task Force (IOTF), other); (x) the prevalence rate of overweight and/or obesity based on BMIsr; and (xi) the prevalence rate of overweight and/or obesity based on BMIm.
Data synthesis and statistical analysis
From each study, the prevalence rate of overweight and obesity based on BMIsr and that based on BMIm (P sr and P m, respectively) were obtained, and the prevalence ratio (PR; PR=P sr/P m) between the two prevalence rates from each study was derived. As used in this context, the PR provides information about the relative possibility of being classified into the overweight and obesity category based on BMIsr relative to the ‘gold standard’ of BMIm. More specifically, PR>1, PR=1 and PR<1 indicate overestimation, equal estimation and underestimation of overweight and obesity cases, respectively, by the BMIsr method.
In the overall analyses, the pooled estimates of P sr, P m and PR with the 95 % CI were obtained by using a random-effects model, which is generally more appropriate than a fixed-effects model because it assumes that the true effect size varies among studies included( Reference Borenstein, Hedges and Higgins 54 ). The heterogeneity across studies was assessed by the Q statistic and the I 2 statistic, which represents the percentage of variation across studies that is due to heterogeneity rather than chance( Reference Higgins, Thompson and Deeks 55 ). I 2 values of 25 %, 50 % and 75 % indicate low, moderate and high heterogeneity, respectively( Reference Higgins, Thompson and Deeks 55 ). Publication bias was assessed by Begg’s and Egger’s tests, with a non-significant P value indicating insufficient evidence of publication bias( Reference Egger, Smith and Schneider 56 , Reference Dear and Begg 57 ).
To explore the factors that might have affected the difference between the prevalence rates derived from the two approaches (BMIsr and BMIm), moderator analyses were conducted based on PR for three categorical variables (i.e. gender, weight status category, weight status screening tool) and one continuous variable (i.e. age) by assuming a mixed-effects model. In addition, a mixed-effects model uses a random-effects model within subgroups and a fixed-effect model across subgroups, and it is generally advocated for subgroup analyses( Reference Borenstein, Hedges and Higgins 54 ). To measure the effect of each moderator variable, R 2 was used as the proportion of variance accounted for by the moderator variable( Reference Cooper, Hedges and Valentine 58 ). All statistical analyses were performed by using Comprehensive Meta-analysis version 3.0 (Biostat, Englewood, NJ, USA), a statistical analysis software specially designed for conducting meta-analysis.
Results
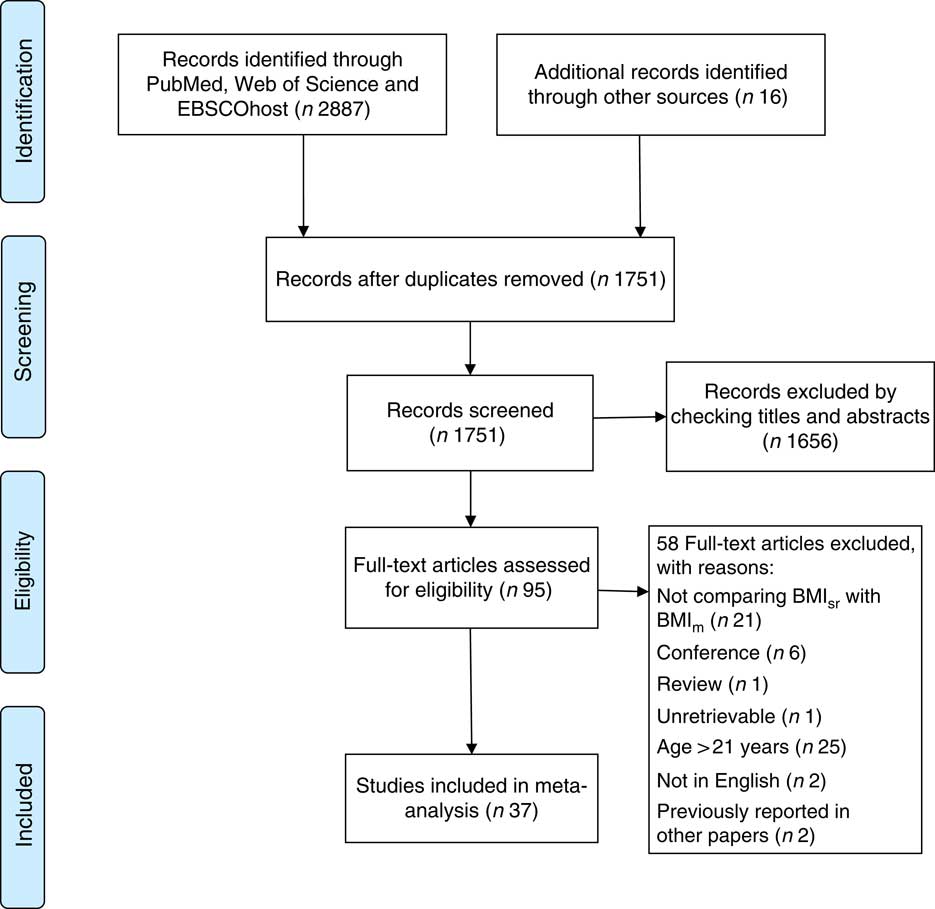
The process of selecting the usable studies for the meta-analysis is described diagrammatically in Fig. 1. We identified 2903 articles in total. After removal of duplicates, 1751 were left for screening of titles and abstracts, from which ninety-five articles were retrieved for full-text screening. Finally, thirty-seven studies were found to have met all the selection criteria( Reference Fonseca, Silva and Matos 18 , Reference Aasvee, Rasmussen and Kelly 24 – Reference Zhou, Dibley and Cheng 41 , Reference Legleye, Beck and Spilka 43 – Reference Wang, Patterson and Hills 49 , Reference Abalkhail, Shawky and Soliman 59 – Reference Gebremariam, Andersen and Bjelland 69 ).
Flowchart showing selection of studies for inclusion in the current meta-analysis (BMIsr, BMI derived from self-reported height and weight; BMIm, BMI derived from measured height and weight)
Descriptive characteristics of the studies
The main characteristics of the thirty-seven studies included in the meta-analyses are summarized in the online supplementary material, Supplemental Table 1. Studies were carried out from 1992 to 2016. A total of 59 735 children and adolescents were included in these thirty-seven studies, with an average of 49·10 % (range 22·20–61·65 %) male and a mean age of 13·8 years (range 6–21 years). Nineteen studies differentiated the prevalence rates of overweight and obesity by gender (male and female); eighteen studies did not provide information about gender-specific prevalence rates and these were assumed to have included both female and male participants. Twenty-four studies differentiated the prevalence rates by weight status category (i.e. overweight v. obesity) and twelve studies were coded as ‘mixed’ for not providing information about overweight-only and obesity-only prevalence rates. All studies provided information on the weight status screening tool used, with ten studies using CDC, fourteen using IOTF, three using WHO, seven using national-specific standard (e.g. the Korean child and adolescent growth charts( Reference Aasvee, Rasmussen and Kelly 24 )) and three using other references (e.g. the National Health and Nutrition Examination Survey( Reference Must, Dallal and Dietz 70 )). In addition, it should be noted that the different weight status screening tools (e.g. CDC, IOTF, WHO, national-specific standard) have different BMI cut-off values to screen overweight and obesity among children and adolescents( Reference Rolland-Cachera 71 ).
Summary results of moderator analyses for the prevalence ratio estimates

k, number of studies; PR, prevalence ratio; CDC, Centers for Disease and Control; IOTF, International Obesity Task Force; B PR, meta-regression coefficient; Q B, between-group heterogeneity statistic to test the effect of the moderator variable on the prevalence rates; R 2, proportion of variance accounted for by the moderator variable; Q regression, heterogeneity accounted for by the regression model.
Overall analyses
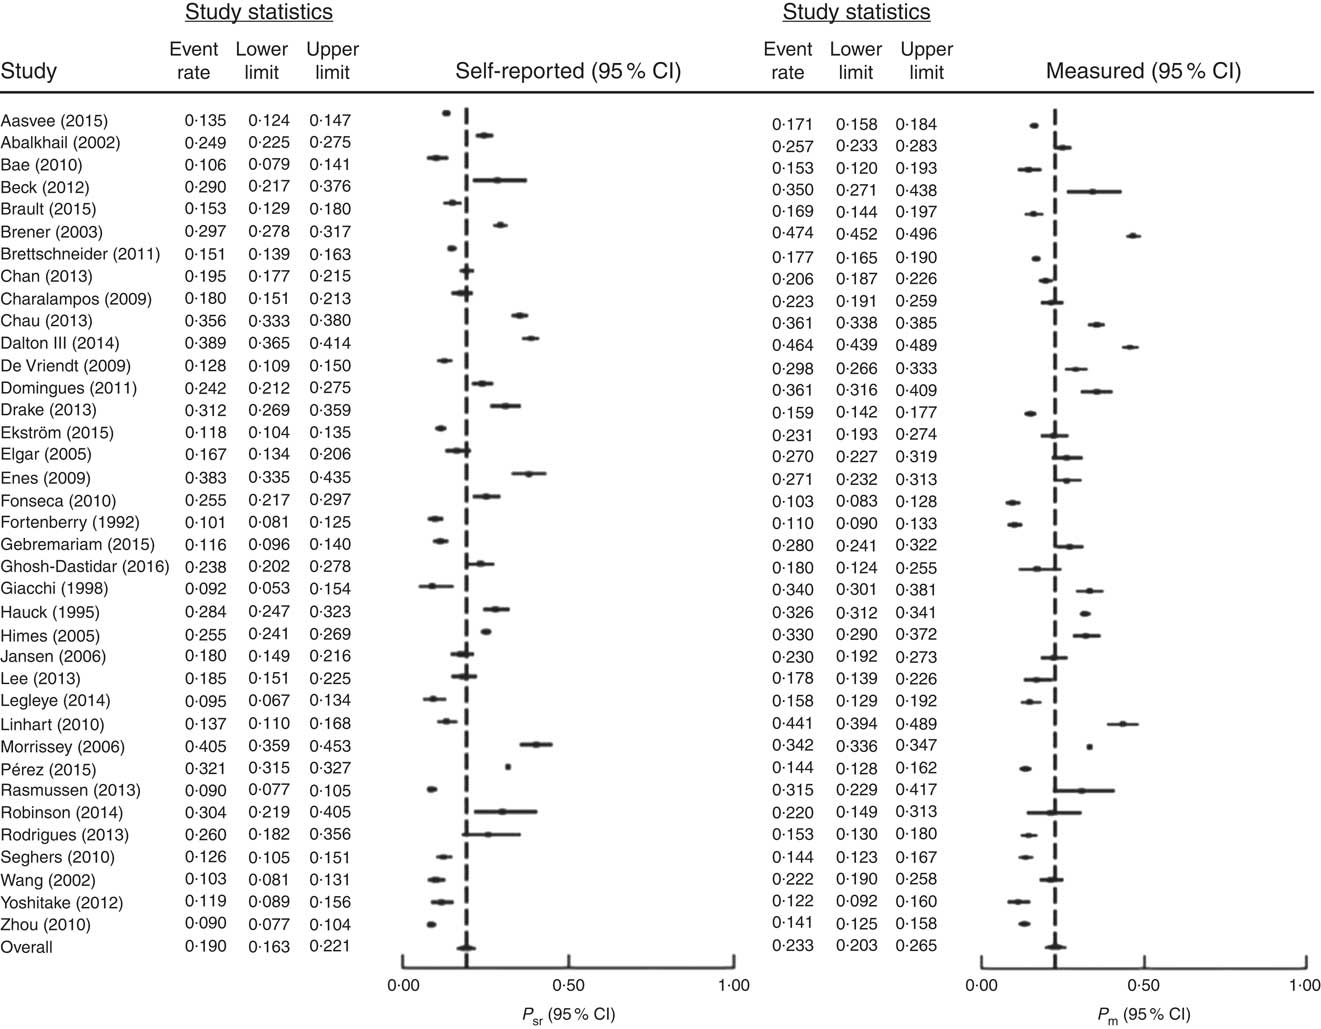
The forest plots comparing the prevalence rates of overweight and obesity based on BMIsr and BMIm for each of the selected studies are presented in Fig. 2. The pooled P sr and P m were 0·190 (95 % CI 0·163, 0·221; P<0.01) and 0·233 (95 % CI 0·203, 0·265; P<0.01), respectively, with each estimate outside the 95 % CI of the other, suggesting that the pooled P sr was significantly lower than the pooled P m. The pooled mean PR was 0·823 (95 % CI 0·775, 0·875; P<0.01), with a significant Q statistic (Q (36)=218·74, P<0.01) and a relatively large I 2 (83·54 %). The findings from the overall analyses indicated two things. First, the BMIsr method generally underestimated the prevalence rate of overweight and obesity among children and adolescents when compared against the ‘gold standard’ of BMIm, with the risk of being identified as overweight and obese based on BMIsr being about 18 % lower than that based on BMIm. Second, the heterogeneity test for the findings of the individual studies indicated a considerable amount of heterogeneity across the studies, which points to the need for conducting moderator analyses( Reference Lipsey and Wilson 72 ). Thus, to understand what factors may have contributed to the inconsistencies of the findings across the studies, moderator analyses were carried out as reported in the following section.
Forest plots for the prevalence rates of overweight and obesity in children and adolescents based on BMIsr (left) and BMIm (right). The study-specific prevalence rate and 95 % CI are represented by the black square and horizontal line, respectively; the centre of the diamond represents the pooled prevalence rate and its width represents the pooled 95 % CI (BMIsr, BMI derived from self-reported height and weight; BMIm, BMI derived from measured height and weight; P sr, prevalence rate based on BMIsr; P m, prevalence rate based on BMIm)
Moderator analyses
According to the results presented in Table 1, 9·1 % of the between-study heterogeneity could be explained by gender, with the PR higher for males (PR=0·862, 95 % CI 0·794, 0·936; P<0.01) than for females (PR=0·791, 95 % CI 0·726, 0·861; P<0.01). The moderator variable of weight status category could account for 14·5 % of the heterogeneity, with the PR for overweight (PR=0·855, 95 % CI 0·787, 0·929) being significantly higher than that for obesity (PR=0·799, 95 % CI 0·706, 0·904; P<0.01). Regarding weight status screening tools, 11·7 % of the between-study variance could be accounted for. The differences among the four groups of screening references (i.e. CDC, IOTF, WHO and national-specific standard) were statistically significant, with the PR for WHO being the highest (PR=1·006, 95 % CI 0·547, 1·849; P<0.01), followed by national-specific standard (PR=0·886, 95 % CI 0·822, 0·956; P<0.01), CDC (PR=0·831, 95 % CI 0·741, 0·932; P<0.01) and IOTF (PR=0·760, 95 % CI 0·683, 0·845; P<0.01). For the moderator variable of age, a significant regression slope (B PR=−0·051; P<0.05) and 12·5 % of variance explained were found in the meta-regression analysis, which indicated that PR decreased significantly in value with the increase of age.
Methodological quality and publication bias
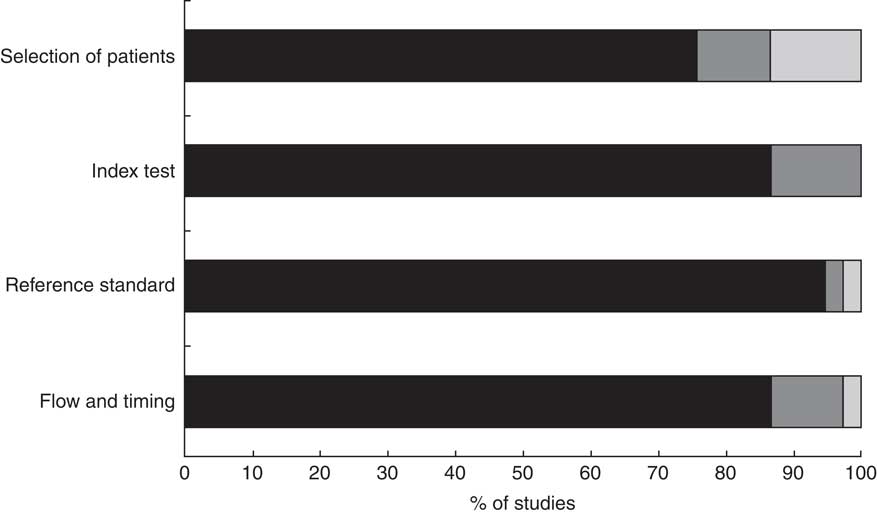
The methodological quality of the thirty-seven included studies is summarized in Fig. 3. Based on our quality assessment procedures described above, a majority of the studies showed a low risk of bias across the four domains; only four studies were considered as having high risk of bias due to ‘selection of patients’, one study having high risk due to ‘reference standard’, one study having high risk due to ‘flow and timing’, and no study having high risk of bias due to ‘index test’. Thus, the selected thirty-seven studies overall showed good methodological quality.
Quality assessment (![]() , low;
, low; ![]() , unclear;
, unclear; ![]() , high) in the four main domains of QUADAS-2 for studies (n 37) included in the current meta-analysis (QUADAS-2, Revised Tool for the Quality Assessment of Diagnostic Accuracy(
Reference Whiting, Rutjes and Westwood
53
))
, high) in the four main domains of QUADAS-2 for studies (n 37) included in the current meta-analysis (QUADAS-2, Revised Tool for the Quality Assessment of Diagnostic Accuracy(
Reference Whiting, Rutjes and Westwood
53
))
According to the result of Begg’s and Egger’s tests, only Egger’s test (P=0.03), and not Begg’s test (P=0.979), showed any evidence of publication bias. By using Duval and Tweedie’s trim-and-fill method( Reference Duval and Tweedie 73 ), four additional PR were imputed to achieve no publication bias, and the adjusted estimate of PR (0·794; 95 % CI 0·774, 0·847) was close to the original estimate of PR (0·823; 95 % CI 0·774, 0·875). Thus, the publication bias was not likely to be a threat to the validity of the estimated mean PR.
Discussion
The current meta-analysis reveals that, for children and adolescents, the estimated prevalence rate of overweight and obesity based on BMIsr (19·0 %) was significantly lower than the prevalence rate estimate based on BMIm (23·3 %). In terms of the relative risk for overweight and obesity, the BMIsr method underestimated the risk of children and adolescents being classified into the category of overweight and obesity by about 18 % (PR=0·823). This finding indicates that, relative to the ‘gold standard’ of BMIm, the use of BMIsr would lead to under-identification of cases of overweight and/or obesity among children and adolescents. This result is not a surprise, as most previous studies reported underestimation of the prevalence of overweight and obesity based on self-reported data when compared with the result based on the measured data( Reference Aasvee, Rasmussen and Kelly 24 – Reference Jansen, Van de Looij-Jansen and Ferreira 34 ). However, in consideration of the relatively high heterogeneity among the thirty-seven selected studies (I 2=83·54), this overall finding should be interpreted with caution, because it was not adjusted for other factors (e.g. gender, age, weight status category, weight status screening tool).
It is notable that a significant effect of gender was found, with the PR for female participants being significantly lower than for male participants (0·791 v. 0·862), which reveals that, when BMIsr was used for estimating the prevalence of overweight and obesity, the underestimation bias was more severe for females than for males. Put differently, it was more accurate to use BMIsr to monitor the prevalence of overweight and obesity for males than for females. This finding is consistent with some previous studies reporting that females show a stronger tendency of over-reporting height and under-reporting weight than males, which would lead to a greater underestimation bias of the prevalence of overweight and obesity( Reference Aasvee, Rasmussen and Kelly 24 , Reference Brettschneider, Rosario and Ellert 27 ). With respect to weight status category, we found that the PR for overweight was significantly higher than for obesity (0·855 v. 0·799). This finding indicates that use of the BMIsr method would lead to a greater underestimation of the prevalence for obesity condition than for overweight condition. This is consistent with the findings from a number of studies reporting that BMIsr tends to be underestimated to a greater degree by heavier children and adolescents( Reference Bae, Joung and Kim 25 , Reference Charalampos, Michael and Antonia 28 , Reference Elgar, Roberts and Tudor-Smith 30 , Reference Seghers and Claessens 40 , Reference Beck 46 , Reference Ekström, Kull and Nilsson 47 , Reference Wang, Patterson and Hills 49 , Reference Brault, Turcotte and Aimé 60 , Reference Robinson, Suminski and Perez 65 , Reference Fortenberry 68 ), so it would be less accurate to use BMIsr for evaluating obesity than for overweight.
As for the effect of weight status screening tools, the results show that the highest PR was from the studies using WHO (1·006), followed by those using national-specific standard (0·886) and CDC (0·831), while those studies using IOTF showed the lowest PR (0·760). As there is no previous literature concerning the comparison of these references by using both BMIsr and BMIm, the finding of the current meta-analysis indicates that when BMIsr would be used to monitor the prevalence of overweight and obesity, the WHO reference might have the least underestimation of the prevalence, followed by national-specific standard, CDC and IOTF in that order.
Regarding the effect of age, previous studies have reported inconsistent findings. Some studies reported that BMIsr was less reliable for estimating overweight and obesity in older children compared with younger children( Reference Yoshitake, Okuda and Sasaki 37 , Reference Zhou, Dibley and Cheng 41 , Reference Wang, Patterson and Hills 49 ). However, other studies reported no age difference( Reference Rodrigues, Gonçalves-Silva and Pereira 38 ), or even that the prevalence estimate based on BMIsr tended to be more accurate for older children( Reference Aasvee, Rasmussen and Kelly 24 , Reference Beck 46 ). The result of our meta-analysis (i.e. regression slope for age: B PR=−0·051; P<0·05) revealed a significant negative relationship between age and PR. As the overall PR (i.e. 0·823) represents an underestimation of the prevalence of overweight and obesity based on BMIsr, this finding (i.e. negative relationship between age and PR) indicates that PR would decrease in value with the increase of age, suggesting that the underestimation of the prevalence rate of overweight and obesity by BMIsr would be more severe for older children.
Limitations
There are two likely limitations of the current meta-analysis. The first is related to the moderator variable of weight status screening tools. Because of the small number of studies (k=3) for the condition of WHO reference, the high PR (i.e. 1·006) for the WHO reference condition should be considered tentative, and caution is warranted in the interpretation of this finding. The second limitation concerns some potential moderator variables reported in previous studies, but not included in our moderator analyses (e.g. race( Reference Himes, Hannan and Wall 33 , Reference Pérez, Gabriel and Nehme 44 )), mainly because too few studies contained the relevant information to allow us to conduct moderator analysis for these variables. However, these potential moderators should be examined in the future when sufficient studies have the relevant information about these moderator variables.
Conclusion
Overall, the prevalence of overweight and obesity estimated by BMIsr was significantly lower than the prevalence based on BMIm. The degree of underestimation of BMIsr, however, could vary depending on gender, age, weight status category and weight status screening tool. More specifically, more severe underestimation is associated with female (in contrast to male), older age (in contrast to younger age), obesity (in contrast to overweight condition), CDC and IOTF (in contrast to WHO and national-specific standards). We believe that such a meta-analysis at the population level will provide very useful information for future epidemiological studies when researchers consider the use of BMIsr to estimate the prevalence of overweight and obesity for children and adolescents.
Acknowledgements
Financial support: This research received no specific grant from any funding agency in the public, commercial or not-for-profit sectors. Conflict of interest: The authors have nothing to disclose. Authorship: J.H. designed the research; J.H., Z.C. and X.F. conducted the research; J.H. and Z.C. analysed the data; J.H., Z.C. and X.F. wrote the paper. All authors read and approved the final manuscript. Ethics of human subject participation: Not applicable.
Supplementary material
To view supplementary material for this article, please visit https://doi.org/10.1017/S1368980018000368


