


Introduction
Winter wheat is an important agricultural commodity that supports production of wheat grain and cattle in Kansas and Oklahoma, both of which are the most valuable agricultural products in terms of dollar value in both states (USDA-NASS 2021a, 2021b). In Oklahoma in 2019, about 1.7 million ha were planted with winter wheat, with approximately 1.1 million ha harvested, and an average grain yield of 2,690 kg ha−1 (USDA-NASS 2021a). In contrast, about 2.8 million ha of winter wheat were planted in Kansas in 2019, with nearly all being harvested for grain and an average grain yield of 3,496 kg ha−1 (USDA-NASS 22021b). Wheat that is not harvested for grain is grazed out by cattle, hayed, or terminated and followed by a spring-planted crop. Because of the multiple functionalities that wheat offers (forage, hay, and/or grain), many growers in the southern Great Plains, especially Oklahoma, produce wheat continuously. Continuous wheat rotations often result in an increased prevalence of cereal pests, diseases, and grass weeds. In addition, herbicides with the same sites of action are often used repeatedly, which contributes to the selection for herbicide-resistant weed biotypes.
Winter annual grass weeds are the primary challenge for many wheat producers because they germinate in the fall and have a similar life cycle as winter wheat. The most common and difficult-to-control grass weeds in winter wheat in Oklahoma include cheat (Bromus secalinus L.), Italian ryegrass [Lolium perenne L. spp. Multiflorum (Lam.) Husnot], feral rye (Secale cereal L.), and rescuegrass (Bromus catharticus Vahl). Other economically important annual grass weeds include Japanese brome (Bromus japonicus Houtt), jointed goatgrass (Aegilops cylindrical Host), and wild oat (Avena fatua L.). Fast et al. (Reference Fast, Medlin and Murray2009) documented that season-long interference of Italian ryegrass, feral rye, and jointed goatgrass at densities of 158, 80, and 170 plants m−2 caused wheat yield losses of 20%, 55%, and 21%, respectively. That study also described cheat as the most prevalent weed in Oklahoma, causing wheat yield reductions of up to 19% at densities of 89 plants m−2. The grain price discount caused by individual quality factors (grade, test weight, foreign material, dockage, and moisture) from cheat interference increased by US$0.15 hectoliter−1 from 0 to 89 plants m−2.
During the last two decades, the only herbicide-resistant wheat available to farmers has been Clearfield® or Clearfield® Plus (both of which are resistant to the herbicide imazamox). Imazamox inhibits acetolactate synthase when applied to wheat for both preemergence (PRE) and postemergence (POST) control of many susceptible broadleaf and grass weed species. Since its introduction in the early 2000s, it has been the most used herbicide for managing feral rye populations in Oklahoma because no other herbicides labeled for use in conventional wheat have activity on this weed. In recent years, many agricultural stakeholders have complained about poor control of feral rye following imazamox applications in imazamox-resistant wheat. Furthermore, imazamox-resistant downy brome (Bromus tectorum L.), Italian ryegrass, and cheat populations have been reported in wheat fields in the Great Plains and Pacific Northwest (Heap 2021). These challenges with imazamox-resistant wheat prompted the development of a new herbicide-resistant cultivar of wheat.
The CoAXium® (quizalofop resistant) Wheat Production System was developed by the Colorado Wheat Research Foundation, Albaugh® LLC, and Limagrain Cereal Seeds (Windsor, CO). The system allows for POST applications of quizalofop-P-ethyl (QPE) formulated as the herbicide Aggressor® (Quizalofop-P-ethyl; Albaugh LLC, Ankeny, IA) to wheat varieties containing the AXigen® trait, which was developed through mutagenesis and selection procedures. Tolerance is conferred by a target-site resistance mutation in the Acc1 gene (Ala-2004-Val) that results in a single amino acid substitution on the A, B, or D genome. All commercially available varieties have two homologous gene mutations (Hildebrandt Reference Hildebrandt, Haley, Shelton, Westra, Westra and Gaines2022). The QPE herbicide inhibits acetyl-CoA carboxylase and provides POST control of many spring and winter annual grasses. Currently, 18 wheat varieties are commercially available that contain the AXigen® trait, and QPE herbicide can be applied to them with minimal crop damage when used within the labeled application window.
A challenge that growers will encounter is the risk for off-target movement of QPE herbicide by physical drift, tank contamination, or misapplication. If a grower has only some fields planted with the AXigen® trait or another susceptible grass species nearby, it is critical that proper tank cleanout procedures are followed when using the same sprayer in a wheat field that does not contain the AXigen® trait. Physical movement of QPE herbicide at the time of application also can be a concern, especially during poor spray conditions (high winds, high boom height, improper nozzle selection, etc.). Because CoAXium® wheat is relatively new, no information exists regarding the response of non-AXigen® wheat to off-target applications of QPE herbicide.
Sensitivity of conventional corn, grain sorghum, rice (Lancaster et al. Reference Lancaster, Norsworthy and Scott2018), and aryloxyphenoxypropionate-resistant grain sorghum (Abit et al. Reference Abit, Al-Khatib, Stahlman and Geier2012) to low rates of QPE herbicide has been evaluated. Lancaster et al. (Reference Lancaster, Norsworthy and Scott2018) reported a 58% reduction in corn plant height when exposed to QPE at 16 g ha−1 as compared with a nontreated control. However, QPE herbicide applied at the same rate at tassel and silk reproductive stages reduced corn plant height by only 4% and 5%, respectively. Similarly, QPE applied at 16 g ha−1 at the 2- to 3-leaf, boot, and panicle emergence stages of grain sorghum reduced plant height by 92%, 2%, and 23%, respectively. In the same study, rice responded differently than corn and grain sorghum and showed no observable damage irrespective of QPE herbicide rates tested at various rice growth stages (Lancaster et al. Reference Lancaster, Norsworthy and Scott2018). Abit et al. (Reference Abit, Al-Khatib, Stahlman and Geier2012) also reported grain sorghum injury ranging from 2% to 68% with QPE herbicide at 62 g ai ha−1 applied during early-, mid-, and/or late-POST timings.
Currently, no published information exists on the sensitivity response of conventional wheat (non-AXigen®) to QPE herbicide. Considering the potential increase in use of QPE herbicide with recent commercialization of AXigen® wheat, it is critical to understand the potential injury concerns from QPE herbicide with off-target movement to conventional wheat varieties. Therefore, the main objective of this research was to evaluate the response (visible injury, biomass, and grain yield) of non-AXigen® wheat to QPE herbicide applied at two application timings and five rates. The two highest rates [1× (92 g ai ha−1) and 1/10×] represent possible misapplication or tank contamination rates, whereas the three lowest rates (1/50×, 1/100×, and 1/200×) represent physical drift exposure rates. A secondary objective was to examine the relationship between percent visible injury and grain yield loss. Establishment of a relationship between visible injury and yield loss is to enable growers to determine whether economic grain yield is still possible following wheat crop damage from QPE. This relationship will allow growers to decide whether they should use the crop for livestock production (e.g., grazing, hay, silage) or focus on grain yield.
Materials and Methods
Field experiments were conducted during the 2018–2019 and 2019–2020 winter wheat growing seasons (October to June) in the towns of Lahoma (36.23086°N, 98.06464°W; elevation 380 m), Perkins (35.59164°N, 97.02542°W; elevation 273 m), and Stillwater (36.07153°N, 97.05193°W; elevation 300 m) in Oklahoma; and in Hays, Kansas (38.51238°N, 99.20122°W; elevation 616 m). The Lahoma site consisted of a Grant silt loam (fine-silty, mixed, superactive, thermic Udic Argiustolls) with an average pH of 6.3 and 1.8% organic matter (OM). The Perkins site consisted of a Teller loam (fine-loamy, mixed, active, thermic Udic Argiustoll) with an average pH of 6.4 and 0.8% OM. The Stillwater site consisted of a Kirkland silt loam (fine, mixed, superactive, thermic Udertic Paleustolls) soil with an average pH of 6.4 and 2.1% OM. The Hays site consisted of a silt clay loam soil with an average pH of 7.8 and 2.1% OM.
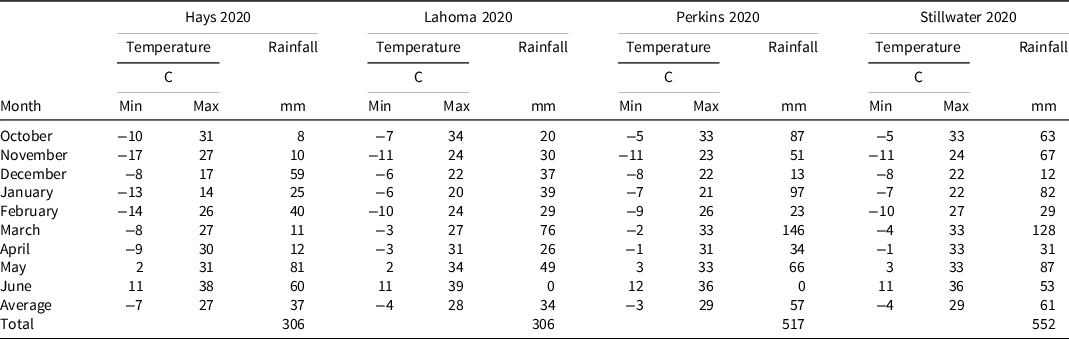
Winter wheat was seeded at a rate of 67 kg ha−1 using a grain drill with 19-cm row spacing at all field sites in Oklahoma. At the Kansas site, wheat was drilled at the same seeding rate using a 25-cm row spacing. All studies were designed as a two-way factorial (application timing × QPE herbicide rate) and arranged in a randomized complete block design with four replications. Information on wheat variety, planting date, herbicide application dates, and harvest date for all locations is summarized in Table 1. Winter wheat varieties were selected based on traits that were best adapted to each location. In-season monthly maximum and minimum temperatures and rainfall amounts are included in Tables 2 and 3. Individual plots at each site were 2.1 or 3 m wide by 9.1 m in length. Five QPE herbicide (Aggressor®; Albaugh, LLC) rates (1×, 1/10×, 1/50×, 1/100×, and 1/200×; where 1× = 92 g ai ha−1) were applied POST in either the fall or the spring. A nontreated control also was included. The 1× QPE rate is the maximum single application rate according to the Aggressor® label (Anonymous 2020). The 1× and 1/10× rates of QPE herbicide were selected to simulate misapplication or tank contamination events, while the three lowest rates represented physical drift scenarios. Fall treatments were applied to 2- to 3-leaf wheat, whereas spring treatments were applied when wheat was at the 3- to 4-tiller stage. All treatments were applied using a CO2-pressurized backpack sprayer calibrated to deliver 140 L ha−1 using Turbo 11002 nozzles (TeeJet®; Glendale Heights, IL) and included a crop oil concentrate at 1%.
Agronomic practices at the four test sites during the 2018–2019 and 2019–2020 winter wheat growing seasons.

a Winter wheat was seeded at all locations using a drill at 67 kg ha−1 with a drill spacing of 19 cm at Oklahoma locations and 25 cm at the Hays, KS, location.
b Quizalofop-P-ethyl was applied to winter wheat plots either in the fall or spring.

Wheat injury was visually estimated in late winter (10 to 13 wk after application) and prior to harvest using a scale of 0% to 100% (where 0% equaled no crop injury and 100% equaled complete plant death). Prior to harvest at all site-years except Hays in 2020, aboveground wheat biomass was determined by harvesting two 0.10-m2 quadrats from the center of each plot and dried in an oven at 50 C for at least 2 d. Finally, wheat was harvested with a small-plot combine (Wintersteiger Inc., Salt Lake City, UT) to determine wheat yield.
A univariate analysis was performed on all response variables to test for stable variance using SAS software (version 9.4; SAS Institute Inc., Cary, NC). No data sets were transformed because transformation did not increase stabilization. Data sets were analyzed using the MIXED procedure in SAS software with the pdmix 800 macro described by Saxton (Reference Saxton1998), and treatments were separated using Fisher’s protected LSD at an α level of 0.05. In the model, fixed effects included application timing and QPE rate, and random effects included replication. Due to significant year by treatment interactions, each site-year was analyzed independently. Finally, to evaluate the secondary objective of our study, both percent visible injury assessment timings (an independent variable) were plotted against wheat yield loss (a dependent variable). Positive linear relationships were observed, and correlation analysis was then performed to fit trend lines to the data.
Results and Discussion
Wheat Visible Injury
Prior to spring, “greenup” is a critical observation timing in Oklahoma because it correlates to when a producer might remove cattle from wheat fields to focus on grain yield production from dual-purpose wheat crops. The effect of QPE rate was significant for wheat visible injury in late winter at all site-years (Table 4). The 1× (92 g ai ha−1) rate resulted in 99% to 100% visible injury at all sites in both years. At the 1/10× rate, injury was still severe at 74% to 99%; however, only 12% injury was recorded at the Lahoma location in 2019. Relatively low visible injury recorded at the Lahoma site in 2019 can be attributed to dry conditions that occurred shortly after planting when only 15 mm of rain fell from planting to the time of the fall application (Table 2). At the three lowest rates (1/50×, 1/100×, and 1/200×), visible injury was similar for each site-year and never exceeded 10%.
Late winter percent visual wheat injury in response to quizalofop-P-ethyl rate at the Oklahoma test locations during the 2018–19 and 2019–20 winter wheat growing seasons.a,b
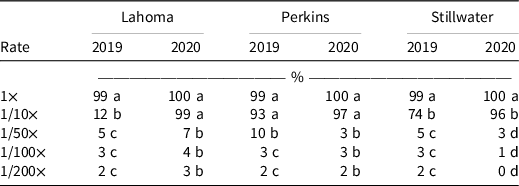
a The 1× rate equaled 92 g ai ha−1 of quizalofop-P-ethyl. All herbicide treatments were applied using water as the carrier and included a crop oil concentrate at 1% (v/v).
b Means within one column followed by a common letter were similar according to Fisher’s protected LSD at P < 0.05.
A significant interaction between application timing and QPE rate was observed for end-of-season wheat visible injury at the Lahoma and Stillwater locations in 2019 and Perkins and Stillwater locations in 2020 (Table 5). The field-use rate (1× = 92 g ai ha−1) caused 100% visible injury at the Lahoma and Stillwater locations in 2019 and in Perkins in 2020 regardless of application timing (both fall and spring). In Stillwater in 2020, although complete plant death was observed following fall application at the 1× rate, only 75% injury occurred for the same rate when applied in the spring. Similar to the 1× rate, the 1/10× rate applied in the spring caused high percent visible injury (89% to 100%) at all sites in both years. Conversely, the 1/10× rate applied in the fall resulted in 7%, 82%, 8%, and 25% visible injury at the Lahoma 2019, Perkins 2020, Stillwater 2019, and Stillwater 2020 site-years, respectively. A decrease in wheat response to the fall application in 2019 compared with 2020 may have been due to limited rainfall received prior to application in 2019 (Table 2). At the Perkins location in 2020 and Stillwater in 2019 and 2020, QPE applied at the 1/50× rate in the spring caused four-times greater injury to wheat compared with the same rate applied in the fall. Conversely, in Lahoma in 2019, visible injury was similar at 4% to 5% following the 1/50× rate in the spring, regardless of application timing. Finally, regardless of site, year, or application timing, the two lowest rates never caused more than 6% injury.
End-of-season percent visual wheat injury in response to quizalofop-P-ethyl treatments during the 2018–19 and 2019–20 winter wheat growing seasons.

a The 1× rate equaled 92 g ai ha−1 of quizalofop-P-ethyl. All herbicide treatments were applied using water as the carrier and included a crop oil concentrate at 1% (v/v).
b Means within one or two columns for each site-year followed by a common letter were similar according to Fisher’s protected LSD at P < 0.05.
At the Hays and Perkins sites during both seasons, only the main effect of QPE rate was significant for winter wheat visible injury (Table 5). QPE applied at the 1× and 1/10× rates injured wheat by 98% to 100% and 71% to 99%, respectively, averaged across application timing. For all four site-years, no more than 12% injury was recorded when QPE was applied at 1/50×, 1/100×, and 1/200× rates. These results are consistent with those reported by Lancaster et al. (Reference Lancaster, Norsworthy and Scott2018), who observed 31% to 58% visible injury on corn and grain sorghum when exposed to QPE (16 g ai ha−1) at the 2- to 3-leaf application timing.
Winter Wheat Yield and Biomass
For grain yield and end-of-season wheat biomass, significant interaction of QPE herbicide rate and application timing was observed for four site-years: Lahoma and Stillwater in 2019 and Perkins and Stillwater in 2020 (Tables 6 and 7). In 2019 at the Lahoma and Stillwater locations and Perkins in 2020, there was complete or near complete biomass and grain loss following the 1× rate of QPE applied in the fall and spring and in the spring at the 1/10× rate. However, when QPE herbicide was applied at the 1/10× rate at the Stillwater site in spring 2020, grain yield was reduced only 79% and biomass 72% when compared with the nontreated control. In Lahoma in 2019 and Stillwater in 2020, the 1/10× rate applied in the fall resulted in a 33% and 27% decrease in wheat biomass but similar grain yields compared to respective nontreated controls and the three lowest QPE rates tested. However, at the Perkins location in 2020 and Stillwater in 2019, both biomass and grain yield were reduced. In Perkins in 2020, biomass and grain were reduced by 41% and 50%, and in Stillwater in 2019 biomass and grain were reduced by 15% and 30%, respectively, compared with their respective nontreated controls.
Winter wheat yields.

a The 1× rate equaled 92 g ai ha−1 of quizalofop-P-ethyl. All herbicide treatments were applied using water as the carrier and included a crop oil concentrate at 1% (v/v).
b Means within one or two columns for each site-year followed by a common letter were similar according to Fisher’s protected LSD at P < 0.05.
End-of-season winter wheat biomass at the Hays, KS, site in 2018–19 and Lahoma, Perkins, and Stillwater, OK, during the 2018–19 and 2019–20 growing seasons.

a The 1× rate equaled 92 g ai ha−1 of quizalofop-P-ethyl. All herbicide treatments were applied using water as the carrier and included a crop oil concentrate at 1% (v/v).
b Means within one or two columns for each site-year followed by a common letter were similar according to Fisher’s protected LSD at P < 0.05.
Grain yield and end-of-season wheat biomass following application of QPE at 1/50×, 1/100×, and 1/200× rates commonly did not differ from those of the nontreated controls regardless of application timing. There were, however, a few exceptions: grain yield was reduced 15% and 17% following the spring application at the 1/200× rate in Stillwater in 2019 and at the 1/50× rate in Stillwater in 2020, respectively. Wheat biomass also was reduced by 28% in Stillwater in 2020 following application of QPE at the 1/50× rate.
The main effect of herbicide rate was significant at the Hays location in 2019 and 2020, Perkins in 2019, and Lahoma in 2020 for grain yield and end-of-season biomass, where complete or near-complete crop loss occurred following the 1× rate of QPE (Tables 6 and 7). QPE applied at the 1/10× rate resulted in 95%, 86%, 100%, and 86% yield loss compared with their respective nontreated controls for Hays in 2019, Hays 2020, Perkins 2019, and Lahoma 2020, respectively. At the same rate, end-of-season biomass for Hays in 2019, Perkins in 2019, and Lahoma in 2020 was reduced by 69%, 100%, and 73%, respectively (biomass data was not collected from the Hays location in 2020). Grain yield in plots treated with QPE at the three lowest rates (1/50×, 1/100×, and 1/200×) did not differ from that of nontreated controls at any of the four site-years with one exception: at the Perkins location in 2019, QPE applied at the 1/50× rate resulted in 8% reduction in grain yield. End-of-season biomass results at the Hays location in 2019, Perkins in 2019, and Lahoma in 2020 also were similar to their respective nontreated controls. Lancaster et al. (Reference Lancaster, Norsworthy and Scott2018) observed similar yield reductions in corn and grain sorghum when the highest QPE rate (16 g ai ha−1) resulted in a yield reduction of 58% in corn at the 2- to 3-leaf application timing and 45% and 71% in sorghum at the 2- to 3-leaf and panicle exertion timings, respectively.
At the Lahoma site in 2019 and Perkins in 2020, weather conditions were quite similar and can help explain end-of-season biomass and grain yield response (Tables 2, 3, 6, and 7). Both locations experienced low temperatures during December when herbicides are typically applied and when the average minimum temperature was −8 C, which resulted in wheat plants that were not actively growing. Conversely, during the spring application months of February and March, maximum temperatures reached 26 C and even higher in the weeks following application. The more ideal temperatures following the spring application resulted in biomass and grain yields of 90 and 114 kg ha−1 or less, respectively. When wheat was treated with 1/10× rate of QPE in the fall the biomass and grain yields were ≥610 and 2,165 kg ha−1, respectively. At both sites, weather conditions during fall applications were not conducive for the wheat plants to uptake and translocate QPE herbicide. QPE herbicide activity requires actively growing plants, with herbicide translocation to the growing points restricted when plant growth is restrained (Shaner Reference Shaner2014).
Conversely, temperature and rainfall patterns were better suited for actively growing plants and subsequent QPE activity at the Hays site in 2019 and Perkins in 2019. Both site-years had low average temperatures of 5 C throughout the growing season and an average high of 27 C. Average monthly rainfall was 37 mm at the Hays site and 97 mm at Perkins (Table 2). As a result, regardless of application timing, wheat yields following the 1× and 1/10× application rates were similar and significantly lower than the nontreated control and three lowest herbicides rates (Table 6). The other two sites, Hays and Lahoma in 2020, had similar yield reductions and trends as Hays and Perkins 2019. Both locations had an average low temperature of −6 C and an average high of 28 C throughout the growing season. Average monthly rainfall over the season for both locations was between 34 and 37 mm (Table 3).
The relationships between the environment and end-of-season wheat biomass and grain yield support the theory that environmental conditions that are favorable for wheat growth will result in increased QPE injury to non-AXigen® wheat. Low temperatures accompanied by reduced rainfall appear to be two major factors that contributed to the variable response following the 1/10× rate of QPE in this study. Additionally, favorable environmental conditions contributed to winter wheat recovery from the 1/10× rate applied in the fall at the Stillwater site in 2019 and 2020 (Tables 4 and 5). Recovered wheat still yielded less than nontreated checks, but there was a threefold decrease in visible injury symptoms from late winter to the end of the season. Crop recovery is likely linked to the adequate rains that were received in Stillwater in 2019 and 2020 following 1/10× fall treatment applications. However, it is unclear why little wheat recovery was observed following the fall 1/10× rate applied at the Perkins site in 2020, especially when considering the proximity of Perkins and Stillwater locations, similarities in variety selection, and application and harvest dates. The most logical explanation would be soil type differences because the Stillwater site had a higher water-holding capacity due to increased OM and silt compared to the Perkins location.
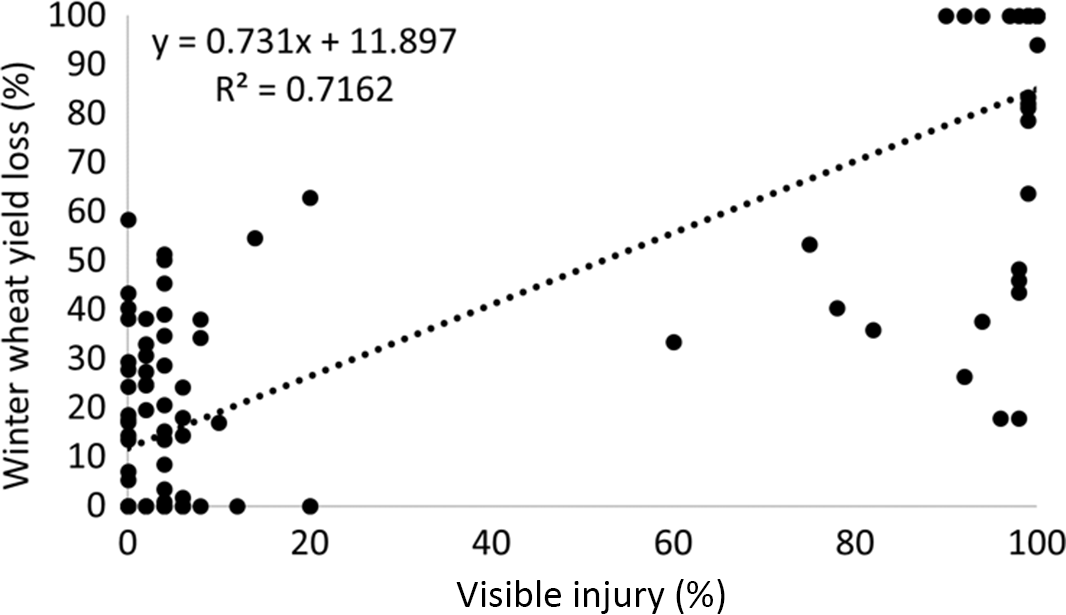
The secondary objective of this work was to determine whether a relationship existed between visible injury (late winter and end-of-season) and wheat yield loss. There is a moderate positive linear relationship between late winter visible injury and wheat yield loss (Figure 1) for the six Oklahoma site-years. The relationship between the two variables likely would have been stronger if wheat recovery didn’t take place at Stillwater sites in 2019 and 2020. Still, percent visible injury in late winter is a moderate predictor of grain yield and may influence a producer’s decision to graze out or hay a wheat field or remove cattle and harvest the field for grain in the summer.
Winter wheat grain yield loss (kg ha−1) as a function of late winter percent visible injury across six site-years (Lahoma, Perkins, and Stillwater, OK, in 2018–19 and 2019–20).
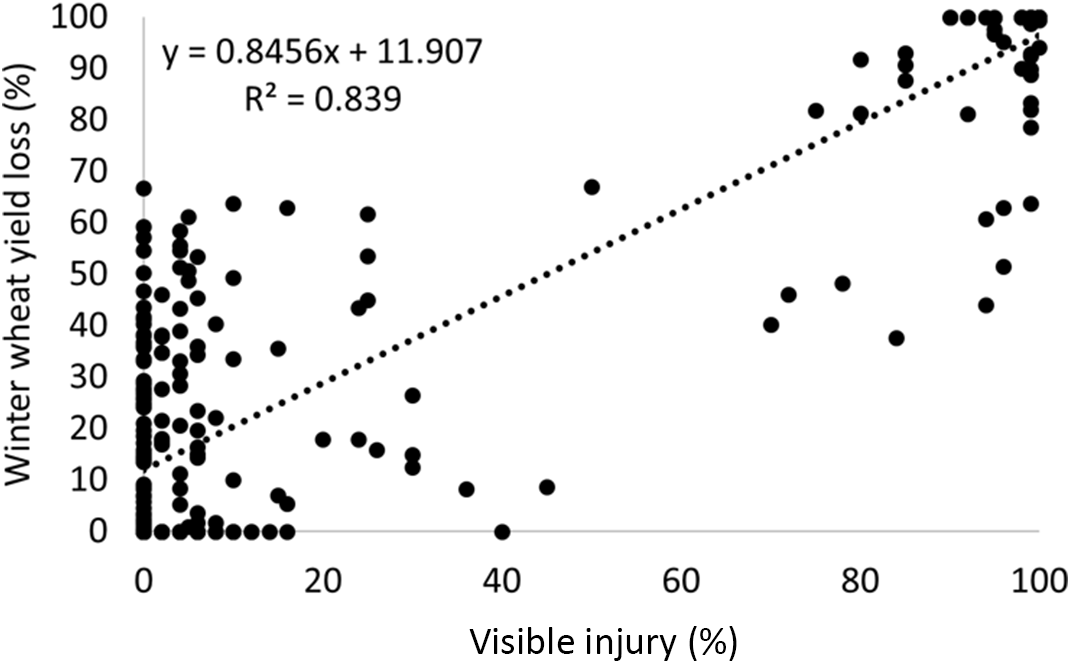
The relationship between visible injury and wheat yield loss improved by the end of the season (Figure 2). There is a moderate positive linear relationship between the two variables for all eight site-years where generally, as end-of-season percent visible injury increases, wheat yield loss increases. Similar to Figure 1, the relationship between the two variables would have been stronger with the inclusion of rates between 1/10× and 1× that resulted in mid-range visible injury values (i.e., 40% to 60%). The highest rate (1× = 92 g ai ha−1) often resulted in complete yield loss and the next highest rate (1/10×) resulted in a variable wheat yield response previously described. Although different wheat classes and varieties were used (Table 1), correlation did not improve when analysis was performed within wheat classes or varieties (data not shown) suggesting that these two variables were not critical when assessing the relationship between visible injury and grain yield loss.
Winter wheat grain yield loss (kg ha−1) as a function of end-of-season percent visible injury across all eight site-years (Lahoma, Perkins, and Stillwater, OK, and Hays, KS, in 2018–19 and 2019–20).
If considering the two highest QPE rates represent possible misapplication or tank contamination scenarios, and if the three lowest rates represent the effects of physical drift, then our results indicated that QPE damage to non-AXigen® wheat will be limited as long as the proper Aggressor® application guidelines are followed. However, misapplication or tank contamination could be major concerns and should be carefully considered by growers who plant both AXigen® and non-AXigen® wheat varieties. To support identification of traits planted within a field, growers should adopt proper flagging of wheat fields with AXigen® and non-AXigen® traits to avoid any misapplication or tank contamination of QPE herbicide to non-AXigen® wheat varieties.
Acknowledgments
We are grateful to the Oklahoma Agricultural Experiment Station for allowing this research to be conducted at the Cimarron Valley, North Central, and Stillwater Research Stations. This publication is contribution no. 22-056-J from the Kansas Agricultural Experiment Station. Work on this project has been enhanced by technical support from Caitlyn Carnahan, Hannah Lindell, Lane Newlin, Jodie Crose, Blain Ball, Madi Baughman, Deacon Burleson, Jarrett Selman, Ethan Moreau, and Erick Moreau. No conflicts of interest have been declared. This research received no specific grant from any funding agency, commercial or not-for-profit sectors.


 Open access