





Introduction
Defining life is an infamously difficult task. This is an issue for astrobiologists, because in order to be able to identify and categorize life in the universe, first being able to define what it is that you’re talking about is something of a necessary prerequisite (Benner, Reference Benner2010; Cowie, Reference Cowie2023; Dunér, Reference Dunér, Cavalazzi and Westall2019; Gillen et al., Reference Gillen, Jeancolas, McMahon and Vickers2023).
To get an idea of how troublesome of a problem finding one definitive definition of life is, Edward Trifonov was able to find one hundred and twenty three different ways to do so (Trifonov, Reference Trifonov2011). He took a somewhat unorthodox approach to the problem from there, using a linguistic analysis to synthesize these many definitions down to simply:
“Life is self-reproduction with variations.”
In practice, as this approach emphasizes, many definitions of life are strongly conceptually overlapping, often unintentionally (Cornish-Bowden, Reference Cornish-Bowden2015; Cornish-Bowden and Cárdenas, Reference Cornish-Bowden and Cárdenas2019; Letelier et al., Reference Letelier, Cárdenas and Cornish-Bowden2011). Many of these attempts have looked at life through the lens of information (Bartlett et al., Reference Bartlett, Eckford, Egbert, Lingam, Kolchinsky, Frank and Ghoshal2025; Helman, Reference Helman2022; Miller et al., Reference Miller, Baluška and Reber2023; Walker et al., Reference Walker, Davies and Ellis2017).
This has been a point of some criticism; for example, Assembly Theory, an attempt to empirically quantify a concept of life (Sharma et al., Reference Sharma, Czégel, Lachmann, Kempes, Walker and Cronin2023), has been noted to be reducible to Shannon’s Information Theory, which has been used to totally dismiss said definition (Abrahao et al., Reference Abrahao, Santiago Hernández-Orozco, Kiani, Tegner and Zenil2024; Ozelim et al., Reference Ozelim, Uthamacumaran, Abrahão, Hernández-Orozco, Kiani, Tegnér and Zenil2024; Uthamacumaran et al., Reference Uthamacumaran, Abrahão, Kiani and Zenil2024).
As the authors noted in a previous publication (McCrum and Kee, Reference McCrum and Kee2024), the approach of turning to the general concept of information as an attempt to resolve the question of defining life can be seen as analogous to parallel trends in neuroscience. The model of Integrated Information Theory is a high-profile attempt to empirically quantify a concept of consciousness through the parameter of integrated information Φ (Albantakis et al., Reference Albantakis, Barbosa, Findlay, Grasso, Haun, Marshall, Mayner, Zaeemzadeh, Boly, Juel, Sasai, Fujii, David, Hendren, Lang and Tononi2023; Tononi, Reference Tononi2004), although this has faced savage criticism on a variety of conceptual and structural fronts (Barrett and Mediano, Reference Barrett and Mediano2019; Doerig et al., Reference Doerig, Schurger, Hess and Herzog2019; Herzog et al., Reference Herzog, Schurger, Doerig, Herzog, Schurger and Doerig2022; Klincewicz et al., Reference Klincewicz, Cheng and Schmitz2025; Merker et al., Reference Merker, Williford and Rudrauf2021; Nizami, Reference Nizami2019).
In said previous publication, drawing on arguments in another publication in the same issue by the authors (Kee and McCrum, Reference Kee and McCrum2024), the authors made the case for a broader definition of life, or rather livingness, than is colloquially adopted. This is not a novel concept; Trifonov’s definition is far broader than biological life, and IIT extends the concept of consciousness to many systems generally regarded as inanimate. Another similar thesis is the concept of ‘Lyfe’ that contains as one example the familiar organic-biological life of terrestrial ecosystems but is not solely comprised of that (Bartlett and Wong, Reference Bartlett and Wong2020).
On the basis that many definitions of life are as noted strongly informational, the authors defined a set of broad, abstract biosignature concepts and then attempted to search for these in the class of simple mathematical systems known as Lifelike Cellular Automata (LCAs). This publication will further elaborate on that approach, correct previous work and attempt to consider the reverse; can patterns in the set of LCAs be used to define biosignatures in other living systems?
Cellular automata. Rulesets and evolving patterns
A cellular automaton (CA) is a mathematical system that acts as a generalized abstraction of the principles of biological living things. A CA consists of a group of discrete units, referred to as ‘cells’. Each cell has a finite number of internal states and a finite number of neighbors to which it is connected. Each cell evolves in discrete jumps of time, referred to as ‘generations’, updating its internal state according to an internal ruleset and the internal states of its neighbors. This results in complex collective behavior of the cells.
The basic idea of units that interact in this way can be used as a mathematical abstraction of the interactional principles that underly neural interactions in the brain, flocking behavior of birds, replication of bacteria, or a litany of other biological processes, and they can be used as models thereof. The authors would contend (McCrum and Kee, Reference McCrum and Kee2024) that CAs can in fact be seen as an example of livingness in and of themselves, parallel to, but not simply a reduced model of, biological life.
The most famous example of biology-like behavior in CAs is Conway’s Game of Life (CGOL), discovered by John Horton Conway in 1970 (Gardner, Reference Gardner1970; Izhikevich et al., Reference Izhikevich, Conway and Seth2015). CGOL is remarkable because despite its very simple ruleset – especially relative to the first CAs, which were far more elaborate in comparison (Von Neumann and Burks, Reference Von Neumann and Burks1966) – it can display behavior that seems to the qualitative observer exceedingly complex and ‘lifelike’, hence the name.
Conway’s game of life was discovered by Conway during a quest to find in mathematical state-space a ‘universal’ cellular automata. This CGOL is universal in the sense that it is Turing complete, which means that any computer program that an idealized computer can carry out can be carried out using Conway’s Game of Life. Moreover, it is not in general possible to predict the evolution of a configuration in CGOL for the same reason that it is impossible to predict when a computer running a program will get caught in a loop (Rendell, Reference Rendell2014).
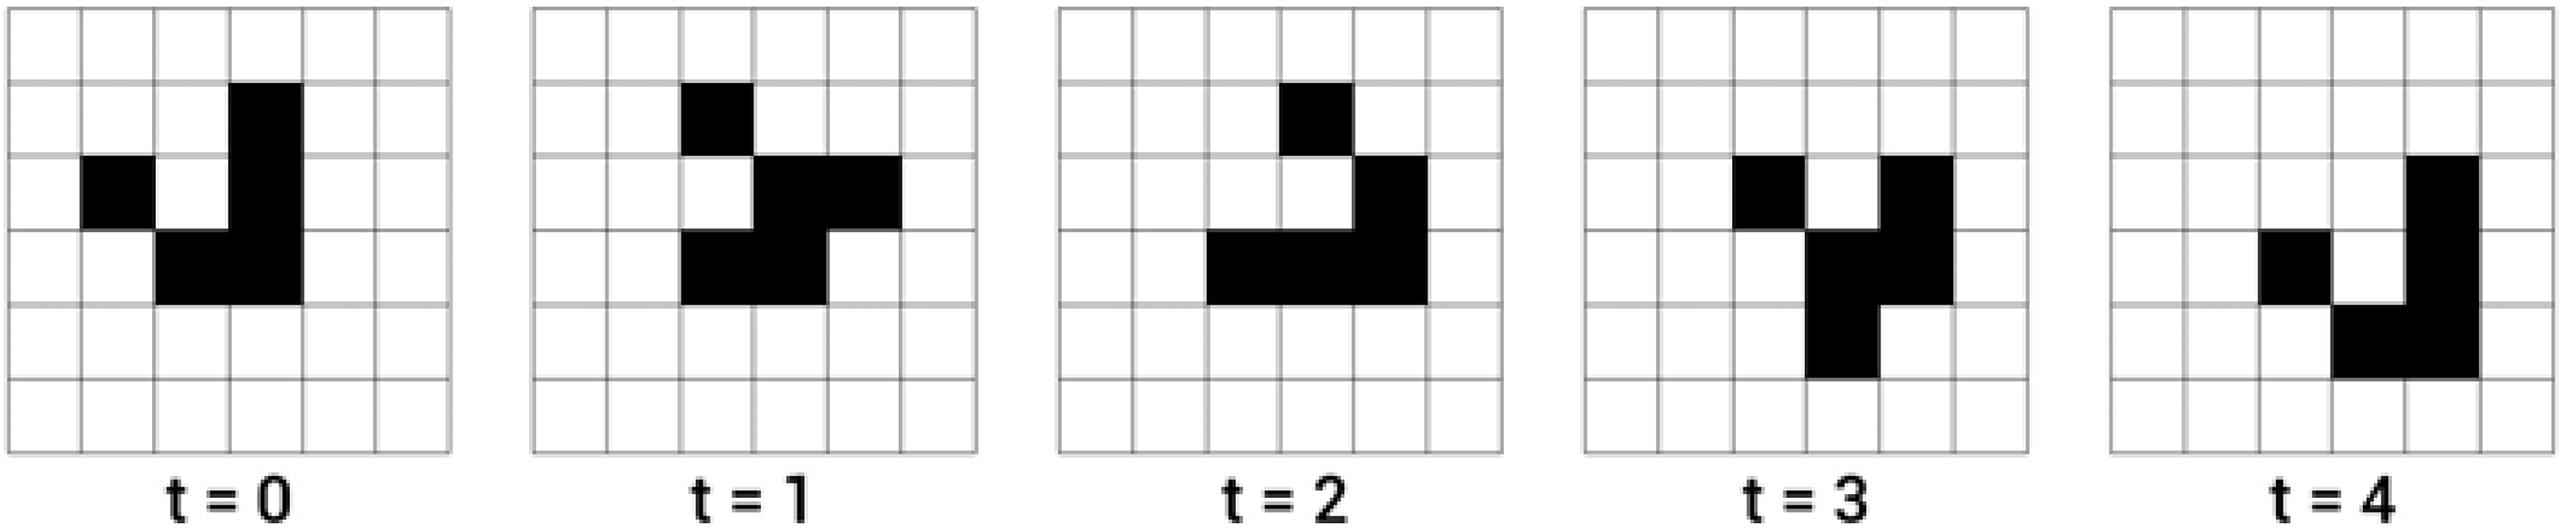
Figure 1 shows what is arguably the most famous pattern in CGOL, the ‘glider’. From a quantitative perspective, this serves as a form of information transfer; it is key to the proof of Turing completeness, and its presence was what caused Conway to realize he had found a special ruleset. From a qualitative perspective, the glider’s motion across the board evokes the behavior of a small biological lifeform. Conway remarked that had he been able to see the pattern in action at the time he named it, he would have called it ‘the ant’ (Conway, Reference Conway2014).
A CGOL glider in motion (Dorin et al., Reference Dorin, McCabe, McCormack, Monro and Whitelaw2012).

Conway’s Game of Life is the namesake and founding example of a broader class of cellular automata, Lifelike Cellular Automata (LCAs). This is the special class of cellular automata with the following traits:
-
(i) A simple binary state space; each cell can only be off or on, usually referred to as live or dead.
-
(ii) Board consisting of a two-dimensional grid of squares.
-
(iii) Neighbors to each cell consisting of only of the 8 cells immediately adjacent in the grid- these are referred to as its Moore Neighborhood.
-
(iv) The state of a cell at generation T + 1 depends only on its state at generation T and its total number of live neighbors.
A particular CA within the LCA class has a given ruleset, defined as the set of responses of live and dead cells to different total numbers of live neighbors. This can be summarized as a pair of binary strings of length 9, meaning that there are ${2^{18}}$
distinct LCAs. For example, CGOL is the specific LCA whose ruleset is:
${2^{18}}$
distinct LCAs. For example, CGOL is the specific LCA whose ruleset is:
(0, 0, 1, 1, 0, 0, 0, 0, 0)
(0, 0, 0, 1, 0, 0, 0, 0, 0)
Which should be read as ‘a live cell will live if it has two or three live neighbors and die otherwise. A dead cell will become alive if it has three live neighbors and remain dead otherwise’.
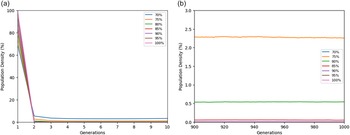
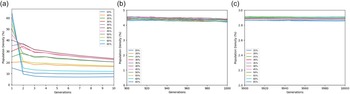
An LCA is defined on a finite grid, which can be toroidal – that is to say, the top left cell is bordered by the bottom right cell to its top left – or boxed – that is to say, the top left cell has no top left neighbor. The specific cells in a grid that are live or dead are referred to as a configuration; these are rotation-symmetric. The percentage of live cells in a given configuration is referred to as its density. The most striking feature of CGOL from a broad perspective across all configurations is a distinct set of phases, dependent on initial configuration density. When the density of a configuration is <15%, CGOL behaves completely unpredictably. Tiny variations in initial configuration mean the difference between a pattern that explodes in size, a pattern that dies out, or a pattern that stabilizes. Much of the computational behavior and interesting constructions of CGOL are seen in this domain. When the density of a configuration is 15–70%, the initial configuration will display long-lasting and complex evolutions that nonetheless have a strong and predictable attractor at around 2.87%, referred to in the previous publication (McCrum and Kee, Reference McCrum and Kee2024) as the Flammenkamp value, after its discoverer (Flammenkamp, Reference Flammenkamp2004). After a very large number of generations, the vast majority of possible CGOL configurations will evolve towards a density very close to this value. When the density of a configuration is over 70%, the initial configuration will be drawn much more rapidly towards an attractor somewhere lower in density than the Flammenkamp value. For configurations higher than around 85%, this attractor is zero, because highly overpopulated initial configurations will rapidly die out. These phase behaviors are shown in Figures 2 and 3.
The short-term (a) and long-term evolution (b) of random configurations of initial density >70% in CGOL. As can be seen, the highest density configurations die out nearly instantly; the slightly lower density configurations are rapidly drawn to very small density attractors. This data was produced in Fortran 90 (code available upon request).

The short-term (a), long-term (b) and very long-term (c) evolution of random configurations of initial density 15–70% in CGOL. As can be seen, all of the configurations move gradually and continually towards a value of 2.87 – the Flammenkamp Attractor. This data was produced in Fortran 90 (code available upon request).

Wolfram has produced a fourfold categorization of 1D and 2D cellular automata rulesets (Wolfram Reference Wolfram1984):
-
(i) CA where almost all patterns die out.
-
(ii) CA where almost all patterns stabilize into frozen ‘still lifes’ or endlessly repeating oscillators.
-
(iii) CA where almost all patterns explosively grow to fill the board
-
(iv) CA where a combination of growth and decay produce rich and complex behavior.
He placed CGOL in the fourth category, arguing that gliders are only possible in this category.
In the previous publication (McCrum and Kee, Reference McCrum and Kee2024), the authors argued for three distinctive features of living behaviors that could be identified in CGOL more strongly than other LCAs:
-
• Self-Ordering. Highly living systems are anti-entropic, such that they become more ordered over time in apparent defiance of the Second Law of Thermodynamics. The authors associated this with the Flammenkamp attractor; a wide variety of highly disordered initial states, referred to as ‘soups’, will inevitably evolve into a specific subset of ordered final states, referred to as ‘ashes’. It was shown that while a sample of LCAs often also have ordering attractors, CGOL’s is somewhat further from equilibrium than average.
-
• Criticality. Living systems exist near phase transitions, which allows them to maximize information processing and transfer. The authors associated this with the complex behavior of CGOL in the 0–20% density range and Wolfram’s classification, arguing that there is an analogy between, for example, the brain existing on the cusp of a phase of explosive electrical signal propagation and exponential electrical signal decay, and CGOL existing somewhere between categories of explosive pattern growth and decay. It was shown that in the 0–20% density range a set of random initial configurations have more varying outcomes in CGOL than on average for other LCAs.
-
• Integration. Living systems have parts that are in strong communication such that to remove any one part is to strongly affect the whole. The authors associated this with an interpretation of the Φ parameter from Integrated Information Theory as a direct measurement of this systemic feature.
These are all well-established features of biological living systems (Ansell and Kovács, Reference Ansell and Kovács2024; Arsiwalla and Verschure, Reference Arsiwalla, Verschure, Villa, Masulli and Pons Rivero2016; Aguilera and Di Paolo, Reference Aguilera and Di Paolo2018; Christensen and Moloney, Reference Christensen and Moloney2005; Havlin et al., Reference Havlin, Buldyrev, Goldberger, Mantegna, Ossadnik, Peng, Simons and Stanley1995; Phillips Reference Phillips2020; Khajehabdollahi et al., Reference Khajehabdollahi, Prosi, Giannakakis, Martius and Levina2022; Kim and Lee, Reference Kim and Lee2019; Kurakin, Reference Kurakin2011; Losa, Reference Losa2009; Mandelbrot, Reference Mandelbrot1982; Niizato et al., Reference Niizato, Sakamoto, Mototake, Murakami and Tomaru2024; Popiel et al., Reference Popiel, Khajehabdollahi, Abeyasinghe, Riganello, Nichols, Owen and Soddu2020; Pross, Reference Pross2013; Schrödinger, Reference Schrödinger1944; Tian et al., Reference Tian, Tan, Hou, Li, Cheng, Qiu, Weng, Chen and Sun2022; Wallace, Reference Wallace2015; Walter and Hinterberger, Reference Walter and Hinterberger2022), and it is already known that CGOL displays criticality (Akgün et al., Reference Akgün, Yan, Taşkıran, Ibrahimi, Mobaraki and Lee2024; Bak et al., Reference Bak, Chen and Creutz1989; Bak, Reference Bak1996; Kayama, Reference Kayama2013; Peña and Sayama, Reference Peña and Sayama2021; Reia and Kinouchi, Reference Reia and Kinouchi2014). However, in retrospect, the correspondence stated between these features and features of CGOL may not be as exact as implied.
It’s not entirely clear that the criticality of CGOL can be equated exactly to Wolfram’s phases of growth and decay. As noted, most of the initial configuration’s decay slowly towards the Flammenkamp value (Figure 3), and a newer classification of CAs (Eppstein, Reference Eppstein1999) is more exacting about definitions, dividing them into those where no pattern can contract, no pattern can expand, and patterns can both expand and contract.
While both the human brain and CGOL balance growth and decay in a similar fashion, the measurement of variance from initial conditions is not a robust test of criticality (even if CGOL is already known to be critical). Although strong sensitivity to external perturbations is a hallmark of criticality, it is completely possible for a system to be highly sensitive to initial conditions while not being critical, and it is important to be specific in defining criticality (Beggs and Timme, Reference Beggs and Timme2012). The wider application of this result should be taken with care, especially as there is some evidence that living systems do not always optimally operate at exactly the point of criticality (Khajehabdollahi et al., Reference Khajehabdollahi, Prosi, Giannakakis, Martius and Levina2022).
The results in computing Φ were also problematic. Putting aside the criticisms of IIT, a major practical criticism of IIT is that calculating Φ is extremely computationally intensive. The study (McCrum and Kee Reference McCrum and Kee2024) was only able to look at Φ for extremely small networks of cells interacting under CGOL rules, and the results were non-rotation-symmetric – which seems likely erroneous – and placed CGOL below the average of Φ. CGOL is already known to be a critical system, and there is some evidence that Φ is maximized at the point of criticality in living systems, which may further indicate problems in the calculations (Niizato et al., Reference Niizato, Sakamoto, Mototake, Murakami and Tomaru2024).
Overall, while the previous publication was important in that it established the concept of a biosignature defined using outlier testing of CGOL in an LCA set, it was flawed and limited. This publication looks to build on that basis. Instead of using already established features of living systems and trying to map them to moderately outlier traits of CGOL, it would be more useful to now look at a much more distinctly extreme – relative to other LCAs – feature of CGOL and instead try to derive a possible biosignature concept from it.
Injectivity, surjectivity and informational memory
In the 1960s, before Conway even discovered CGOL, Moore (Moore, Reference Moore1962) and Myhill (Myhill, Reference Myhill1963) proved that a broad class of cellular automata – including all LCAs – have equality of two properties: injectivity and surjectivity. Their proof is referred to as the Garden of Eden theorem.
LCAs are deterministic, so that any given configuration, ${c_T}$
, will always predictably evolve into the same configuration in the succeeding generation,
${c_T}$
, will always predictably evolve into the same configuration in the succeeding generation, ${c_{T + 1}}$
. However, this does not make them necessarily reversible, in that knowing
${c_{T + 1}}$
. However, this does not make them necessarily reversible, in that knowing ${c_T}$
does not inherently tell you
${c_T}$
does not inherently tell you ${c_{T - 1}}$
. It is possible for two or more configurations to evolve into the same end-state, which means that there is a degeneracy in possible parents for a configuration in general.
${c_{T - 1}}$
. It is possible for two or more configurations to evolve into the same end-state, which means that there is a degeneracy in possible parents for a configuration in general.
To say that an LCA is injective is to say that it is completely reversible, such that for any given ${c_T}$
there is only one possible
${c_T}$
there is only one possible ${c_{T + 1}}$
and one possible
${c_{T + 1}}$
and one possible ${c_{T - 1}}$
; there is never a degeneracy in possible parents for any possible configuration. To say that an LCA is surjective is to say that every configuration has a possible predecessor and therefore can evolve naturally into existence over the course of ordinary play, without external interference.
${c_{T - 1}}$
; there is never a degeneracy in possible parents for any possible configuration. To say that an LCA is surjective is to say that every configuration has a possible predecessor and therefore can evolve naturally into existence over the course of ordinary play, without external interference.
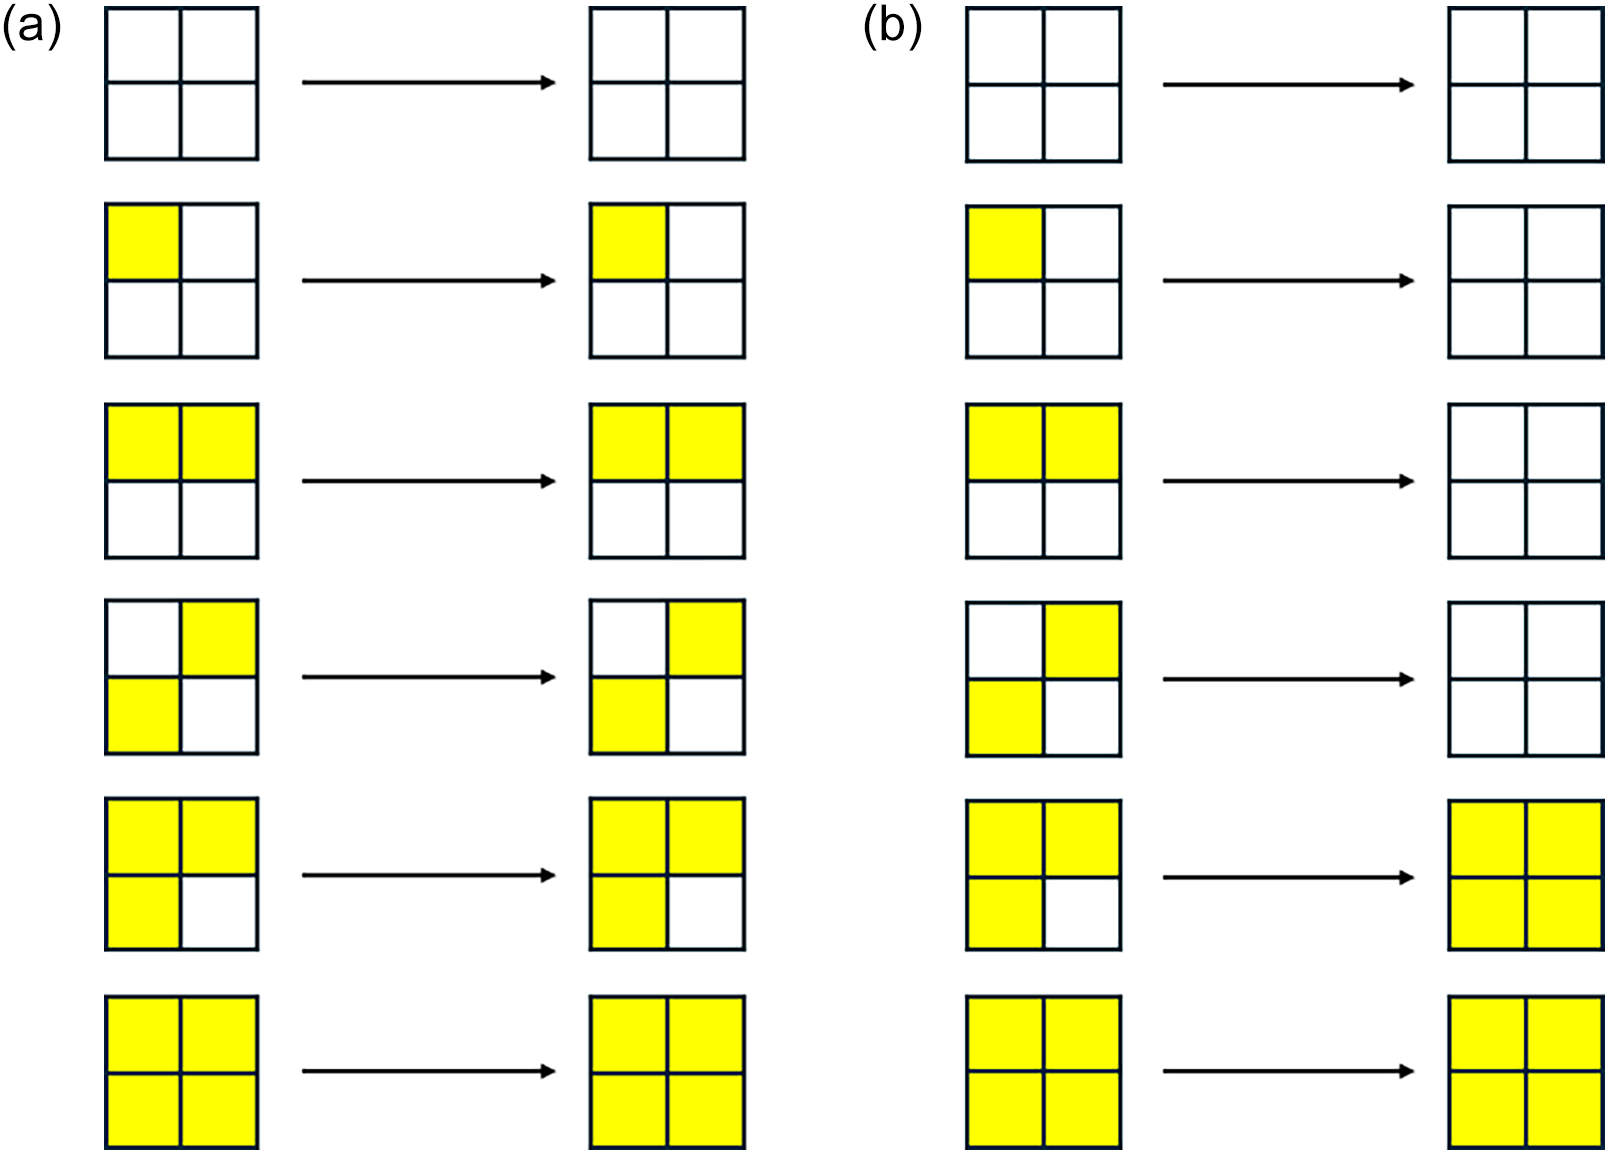
To demonstrate in real terms what this means, Figure 4 shows a set of evolutions for a trivially injective-surjective LCA – the identity LCA, which maps any input configuration to itself – and for CGOL, which is not injective – as is shown by the fact that the vast majority of input states converge to the relatively small number of configurations that have densities close to the Flammenkamp value – and therefore not surjective.
(a) The first evolution of every single rotation-distinct possible configuration of a 2 × 2 box grid under the identity LCA. Note that the system begins with six distinct configurations and ends with six distinct configurations, and that each of the successor configurations has exactly one predecessor. (b) The first evolution of every single rotation-distinct possible configuration of a 2x2 box grid under CGOL. Note that the system begins with six distinct configurations and ends with two distinct configurations, and that as a result there are six – two = four configurations that have no possible predecessor; these are referred to as Gardens of Eden.

It’s able to be gathered from Figure 2 why the Garden of Eden theorem is true. Taking the total set of possible configurations of some finite grid ${C_0}$
and running one iteration of an LCA, an injective LCA will map each configuration to exactly one other, ensuring that each will have a single parent and a single child. A non-injective LCA will map some configurations repeatably onto the same child configuration, leaving others without parents – the Garden of Eden patterns, which do not appear in the second generation and cannot be created through evolution of any possible configuration of the system. They are so called because they can only appear through the outside ‘divine’ intervention of a player.
${C_0}$
and running one iteration of an LCA, an injective LCA will map each configuration to exactly one other, ensuring that each will have a single parent and a single child. A non-injective LCA will map some configurations repeatably onto the same child configuration, leaving others without parents – the Garden of Eden patterns, which do not appear in the second generation and cannot be created through evolution of any possible configuration of the system. They are so called because they can only appear through the outside ‘divine’ intervention of a player.
From a naïve perspective, if one wanted to define the concept of ‘memory’, or retention of information about the system’s past, in an LCA, one could think that the subclass of injective-surjective LCAs has perfect memory. Given a configuration, it is always possible to define exactly which configuration came before, and before that, and so on. This contrasts with CGOL, which is irreversible in a way that destroys information; because the trajectories of separate starting points in configuration space merge, there is no way to tell from the end point which state the system started in.
From an information theory perspective, one could define the information entropy, H (Shannon and Weaver, Reference Shannon and Weaver1948) of a configuration in an LCA as being: $H = {p_1}log\left( {{1}\over{{{p_1}}}} \right) + \;{p_2}log\left( {{1}\over{{{p_2}}}} \right).. + \;{p_n}log\left( {{1}\over{{{p_n}}}} \right)$
Where ${p_n}$
is the probability of the nth possible parent configuration being the predecessor of that state. In the case that there is only one possible predecessor:
${p_n}$
is the probability of the nth possible parent configuration being the predecessor of that state. In the case that there is only one possible predecessor: $H = 1log\left( {{1}\over{1}} \right) = 0$
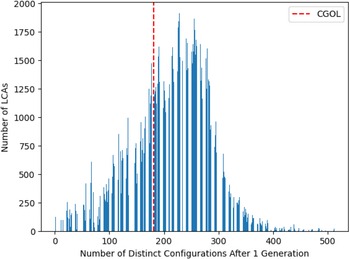
Therefore, any configuration in an injective-surjective LCA has perfect minimization of information entropy, defined this way. The vast majority of LCAs are not injective-surjective (Figure 5). However, what is important to recognize is that CGOL, despite not having perfect reversibility, has a sense of its past that an injective-surjective LCA cannot possibly have. Once an LCA enters a loop or becomes frozen, it ceases to have a sense of time. There is no way to tell if the system has been progressing for 10 generations or for 10,000 generations. Successive states passing through the system do not deposit any information in the system (Figure 6).
Number of distinct configurations after one evolution of every single LCA on a 3 × 3 grid. As a 3 × 3 grid has 9 cells, it has ${2^9} = 512$
possible initial distinct configurations. Only those LCAs with 512 configurations after one evolution are injective-surjective; as can be seen, this is a tiny number at the extremity of a distribution that resembles a skewed bell curve. CGOL is just to the left of the peak of the curve; it has 181 distinct configurations after one evolution. This data was produced in Fortran 90 (code available upon request).
${2^9} = 512$
possible initial distinct configurations. Only those LCAs with 512 configurations after one evolution are injective-surjective; as can be seen, this is a tiny number at the extremity of a distribution that resembles a skewed bell curve. CGOL is just to the left of the peak of the curve; it has 181 distinct configurations after one evolution. This data was produced in Fortran 90 (code available upon request).

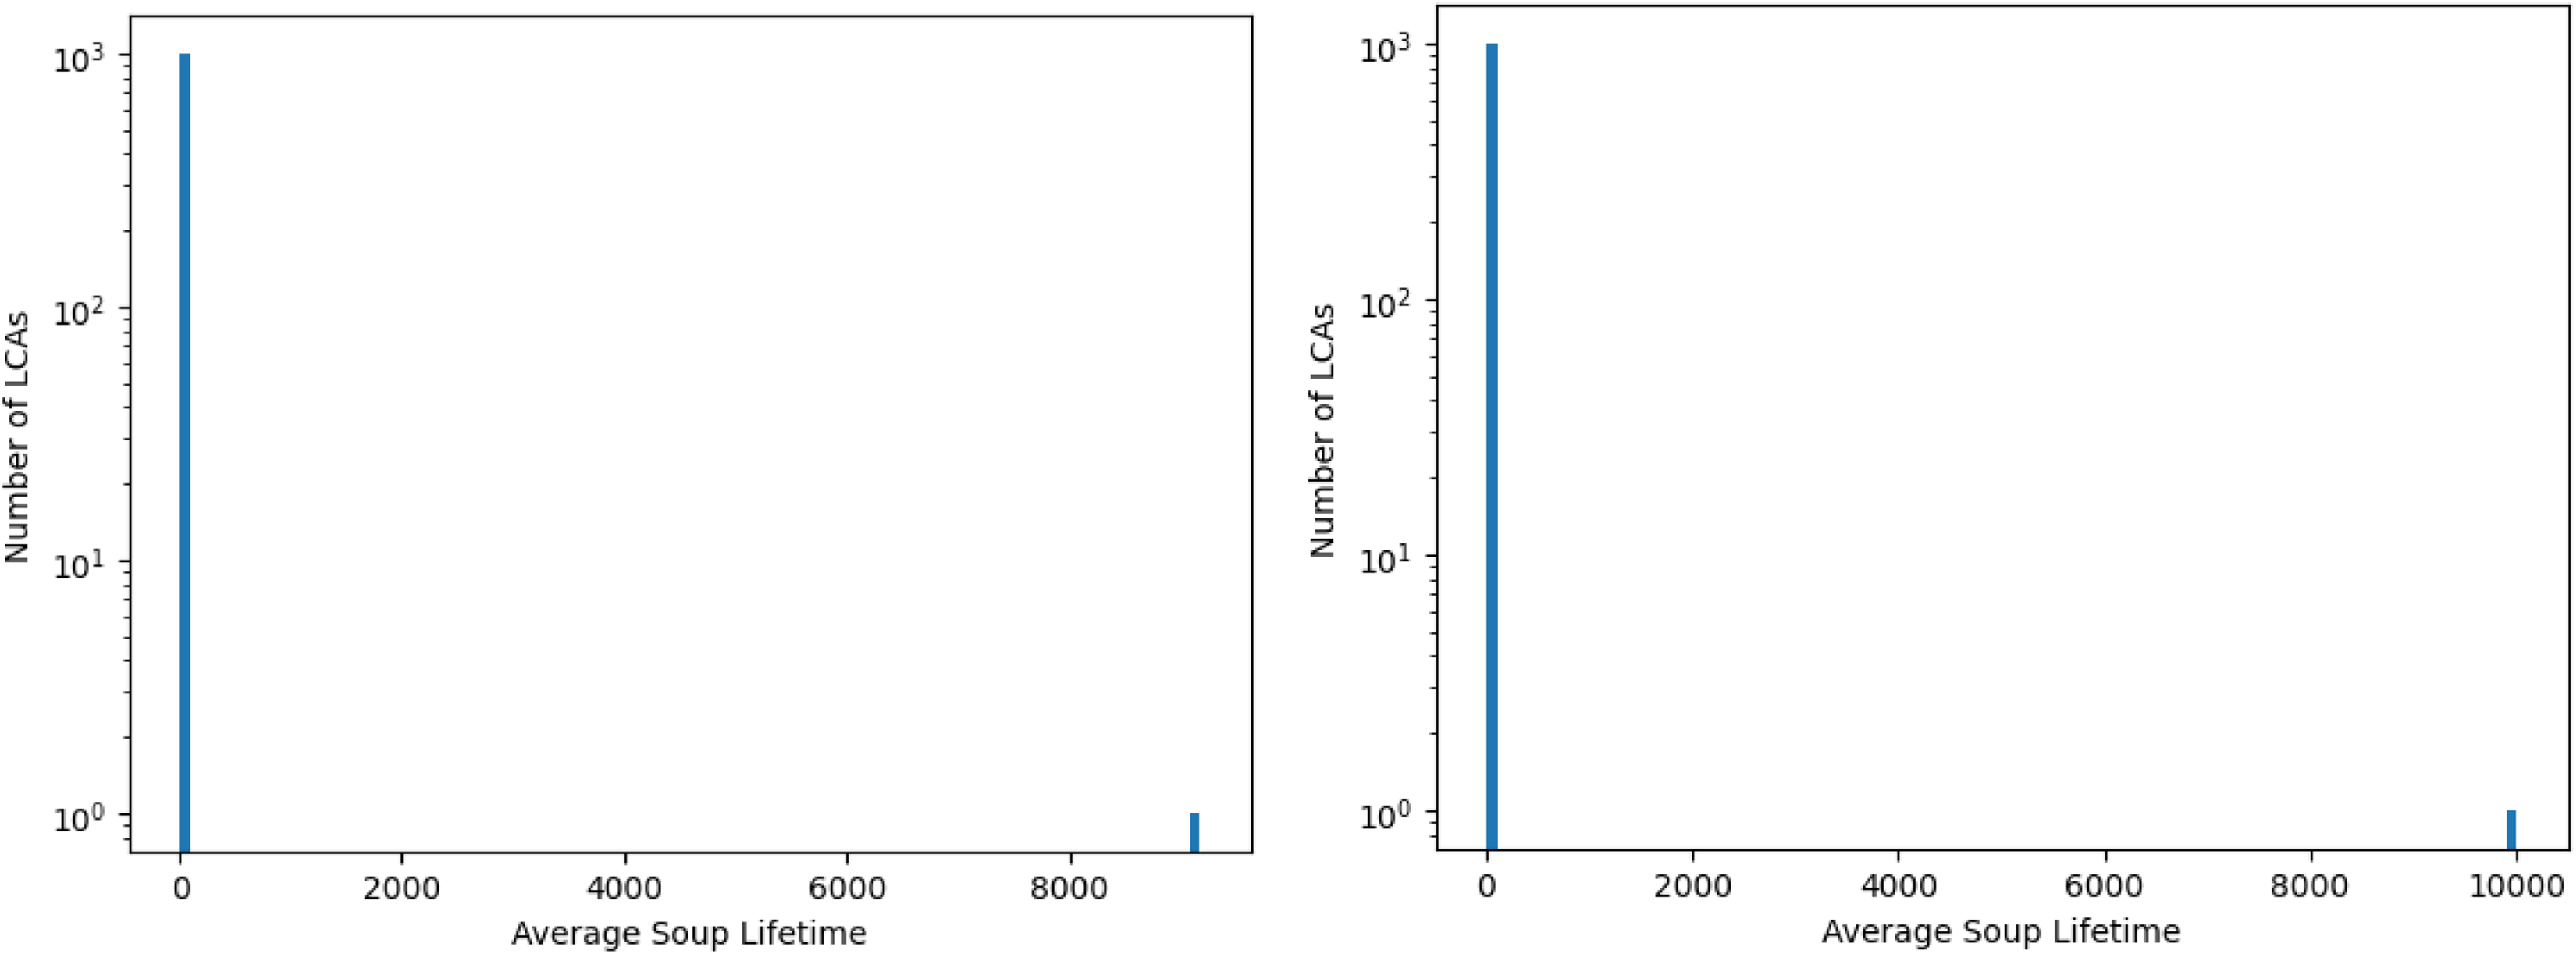
The average (over 10 samples per ruleset) soup lifetimes (measured until a grid is emptied or enters an oscillation) of 1000 non-CGOL LCA rulesets and CGOL, for a box grid (left) and a torus grid (right), both of size 2048. CGOL’s lifespan – the single instance in the right bar on both histograms- is enormously larger than every single other LCA considered – the other 1000 rulesets in the left bar on both histograms. This data was produced in Fortran 90 (code available upon request).

CGOL is extremely unusual in that for the vast majority of its initial configurations, it continues to have a sense of time for a very large number of generations. This can be seen in Figure 3, which shows a much more extreme outlier behavior than was identified in the previous study (McCrum and Kee Reference McCrum and Kee2024).
The fact that CGOL is not injective-surjective is not a defect but can be considered an aspect of its biosignature. An injective-surjective LCA does not preserve evidence of external intervention in Garden of Eden states, nor does it allow for the age of a system to be determined. Because every state has a parent, there is no end or beginning; any given state can feasibly be located within a loop. While some states in CGOL occupy loops in configuration space, others can be traced back to Garden of Eden states, indicating a definitive earliest point where the game began.
Furthermore, the fact that CGOL narrows the configuration space over time produces an ‘arrow of time’ of sorts in the system. The previous publication drew an analogy between this and the evolution of biological systems to more ordered and complex states. Examining a set of CGOL configurations evolving over many generations, the number of distinct configurations will decrease over time, and the density will most likely tend towards the Flammenkamp value; this is clearly asymmetric in time, as is shown in Figure 3.
An injective-surjective LCA will not demonstrate these behaviors, and even other non-injective, non-surjective LCAs, as Figure 4 shows, will very rapidly enter a loop or freeze and cease to evolve in time. CGOL is unusual because its initial configurations either evolve for a very long time before stopping or never cease to evolve; some configurations studied by the authors were still changing after tens of thousands of generations.
Temporal retention of information as a biosignature
The previous section has shown that Trifonov’s definition of life as self-replication with variations is perfectly captured in the long-term behaviors of Conway’s Game of Life.
The term that we will use for this is ‘temporal retention of information’. It’s tempting to refer to it as ‘memory’, but the case of injective-surjective LCAs provide a warning against using that language. Injective-surjective LCAs can be said to have perfect memory, in that configuration ${C_T}$
‘remembers’ that it came from configuration
${C_T}$
‘remembers’ that it came from configuration ${C_{T - 1}}$
and previously from configuration
${C_{T - 1}}$
and previously from configuration ${C_{T - 2}}$
, and so on. However, what these systems lack is a sense of time. For example, the identity LCA does have perfect information transfer in the sense that nothing is lost from generation to generation, but no actual meaningful information is being passed on, because the system is not changing. Additional generations do not bring anything new to the system, and the passage of time is not registered. Therefore, we will use the term temporal retention of information to convey that such a system does not just have an (albeit imperfect) informational link (Vogel, Reference Vogel, Walker, Davies and Ellis2017) to its past but also registers the passing of time through changes in the inter-generational transfer of information.
${C_{T - 2}}$
, and so on. However, what these systems lack is a sense of time. For example, the identity LCA does have perfect information transfer in the sense that nothing is lost from generation to generation, but no actual meaningful information is being passed on, because the system is not changing. Additional generations do not bring anything new to the system, and the passage of time is not registered. Therefore, we will use the term temporal retention of information to convey that such a system does not just have an (albeit imperfect) informational link (Vogel, Reference Vogel, Walker, Davies and Ellis2017) to its past but also registers the passing of time through changes in the inter-generational transfer of information.
Any analogy to biological systems should not be treated as a 1:1 correspondence. While the authors would argue that there is no conceptual distinction in terms of the phenomenon of livingness between CGOL and a human brain, a human brain is not evolving towards a continuous fixed point in the same way that CGOL is.
What is important here is that CGOL balances both replication – that is, the perfect passage of information from present to future – and evolution – that is, the temporally asymmetric alteration of information from present to future. In one sense CGOL can be said to rest on a knife-edge between growth and decay, as Wolfram argued. However, in another sense, it rests on a knife-edge between remembering and forgetting, and this is also true of biological systems.
For example, the glider cannot exist in systems that rapidly explode or decay every pattern. Although these systems have short-term strong temporal asymmetry, essentially all initial configurations will end up the same way, and at that point the system ceases to evolve. The glider maintains its form only in systems that allow for both the copying and the mutation of information forwards in time. In one sense, it is the same structure, and in another sense, an entirely different one. This is a philosophical concept referred to by Deleuze as ‘difference and repetition’ (Deleuze, Reference Deleuze and P.2014; Grosz, Reference Grosz2007). The broader idea that a optimal living system’s memory should not have perfect fidelity is not novel to this publication (Levin, Reference Levin2024) To quote Levin directly:
There is a paradox which points out that if a species fails to change, it will die out, but if it changes, it likewise ceases to exist.
Although this may seem like a purely philosophical or even semantic argument, it can be placed in more precise terms by noting that the idea of temporal retention of information is somewhat of a generalization of the concept of integration established by IIT. The parameter of Φ is, mechanically, a measurement of the responsivity of a system to damage; it measures the divergence in state of a system if part of that system is severed from the rest of the system. Although originally conceived in terms of neural networks, this can be equally thought of as measuring the immune response of the body to a cut, or response of a group of people to an injured member. A system is more integrated when a change in one of its parts produces a response in the system. Nonetheless, this response cannot be overly enhanced; that would correspond, for example, to an overcritical state of the brain where a single firing neuron triggers an electric cascade. For another good example, reproduction by cloning or familial inbreeding ensures perfect fidelity in transmission of a signal but does not allow for suppression of error propagation or evolution.
Purely in terms of the interactions between the cells in a cellular automaton, there is integrated information that is definable using Φ, but temporal retention of information goes beyond this. There is also information stored in, for example, the presence of a Garden of Eden in a configuration’s tree of possible histories or the changing density over time. This is a broader and more complex form of memory, and one that is strongly analogous to that seen in the evolution and growth of biological living things.
One important caveat, previously noted as a strong criticism of IIT (Fleming et al., Reference Fleming, Frith, Goodale, Lau, LeDoux, Lee, Michel, Owen and Slagter2023; Nizami, Reference Nizami2019, is that information is observer dependent. Although a game of CGOL destroys information as it moves from generation to generation even under ideal circumstances, if there is no knowledge of the ruleset, there is no way whatsoever to reconstruct a parent configuration from a child configuration. The information about previous states is not explicitly stored in a configuration but in the known ruleset that was used to produce that configuration. For example, the possible parents of a configuration under the identity ruleset and CGOL differ completely.
For an equivalent example, it is possible to use carbon dating to reconstruct the age of matter taken from a biological organism. However, this information is not freely accessible in the matter itself, but instead it requires existing knowledge of nuclear physics. A person without knowledge of the ‘ruleset’ of radioactivity decay would not be able to inherently deduce anything about the history of the matter in its current state. Even just a few centuries ago, humans would not have had this information.
Therefore, it is important when discussing temporal retention in an informational sense to ensure that the same amount of information is accessible about all systems under comparison. For example, one can only compare two cellular automata if you know both their rulesets.
Conclusion
In a previous publication, the authors drew an analogy between CGOL, which is an outlier in the broader set of LCAs, and a world with a biosignature, which is as an outlier in the broader set of abiotic worlds (McCrum and Kee, Reference McCrum and Kee2024). If this was only an analogy, then this would be of little use to astrobiologists. It’s perfectly possible for two situations to look alike on a surface level but fundamentally have little in common. Two things being outliers in their sets can be a meaningless comparison.
However, the point of that paper was to argue that the specific outlier traits of a biologically active world and of CGOL are shared. A set of traits known to be especially characteristic of biological organisms were identified, and their presence in CGOL tested for. The paper had some partial success in showing that CGOL is not just an outlier like biological life is, but it is an outlier in the same way that biological life is.
The major objection to considering LCAs is that they are trivial – mere toy models. In one sense, this is completely true; Conway’s Game of Life does not remotely approach the complexity of functioning of even the simplest biological organism’s brain. In another sense, this misses the point. Because they are ‘trivial’, they provide an avenue into understanding fundamental principles of life in a way that more complex systems make difficult. To quote Trifonov, discussing his definition of what ‘life’ is:
‘One unforeseen property of the minimalistic definition is its generality. It can be considered as applicable not just to ‘earthly’ life but to any forms of life imagination may offer, like extraterrestrial life, alternative chemistry forms, computer models, and abstract forms. It suggests a unique common basis for the variety of lives: all is life that copies itself and changes.’
CGOL and other LCAs are contained by Trifonov’s definition, as are many esoteric conceptions of forms or categories of life that predate this paper; to list only a few, astrophysical life (Matloff, Reference Matloff2016; Smolin, Reference Smolin2004; Vidal, Reference Vidal2016; Vidal, Reference Vidal2020; van Duin, Reference Van Duin, LePoire, Grinin and Korotayev2025), the shadow biosphere (Cleland, Reference Cleland2007; Davies et al., Reference Davies, Benner, Cleland, Lineweaver, McKay and Wolfe-Simon2009), the Gaia system (Lovelock, Reference Lovelock1972), dynamic kinetic stability (Cutts, Reference Cutts2025; Pross, Reference Pross2004 & Reference Pross2013), and autocatalytic sets (Hordijk et al., Reference Hordijk, Hein and Steel2010; Hordijk, Reference Hordijk2013). With these previous concepts in mind, the idea of a broader conception of life or livingness (used here and in previous publications by the authors similarly to how the term ‘Lyfe’ is used by Bartlett and Wong to mean concepts that go beyond the standard biological understanding of the term life (Bartlett and Wong, Reference Bartlett and Wong2020) should not seem overly shocking or problematic.
It may be of value to abandon the implicit assumption that life is a binary, as discussed in another previous publication (Kee and McCrum, Reference Kee and McCrum2024). Viruses present just one example of how a strict living/non-living binarism can be problematic (Forterre, Reference Forterre2010; de la Higuera and Lázaro, Reference de la Higuera and Lázaro2022; Koonin, Reference Koonin2012; Koonin and Starokadomskyy Reference Koonin and Starokadomskyy2016; Lwoff, Reference Lwoff1957; Rybicki, Reference Rybicki1990). Furthermore, while CGOL is an outlier – especially with regards to the extreme outlier behaviour shown in this paper – it exists on a continuum, often sharing some of its most distinctive traits with other members of the LCA. This is equally true of biosignatures, of course; they arise as continuous points within a landscape of different features of worlds in the universe, not totally aberrant and separated phenomena unlike anything else seen. Biological systems, philosophically, are said to be natural kinds (Papale and Montminy, Reference Papale and Montminy2023) The way that biosignatures are understood is already well-disposed for a spectrum approach.
Ultimately, neuroscience may provide a useful model. As noted, IIT is not necessarily a good model of consciousness in its functional aspects. However, it has been argued that one can use a form of ‘weak IIT’ (Mediano et al., Reference Mediano, Rosas, Bor, Seth and Barrett2022), or perhaps an ‘IIT inspired’ approach (Leung and Tsuchiya, Reference Leung and Tsuchiya2023), that takes inspiration from the philosophy of IIT without necessarily being slavishly adherent to its more criticized aspects. In this way, IIT does not distinguish in binary terms between the conscious and non-conscious but instead defines a quantitative spectrum of the parameter Φ – which ‘strong IIT’ takes as directly equivalent to consciousness, but weaker approaches may take as only a correlate – that is equally applicable to a computer circuit or to a dog.
Perhaps this is a useful approach for astrobiology to consider adopting. Instead of the binary distinction of life/non-life that causes both severe philosophical difficulties of definition and practical difficulties of detection, one could imagine instead defining a spectrum of livingness in terms of an informational correlate. This would be analogous to Φ and could be used to place different systems on different levels of biosignature, being able to compare like with like using the universal language of information, even if the underlying structures are functionally very different.
Future research may consider looking at the possibility of using measurements such as criticality, Φ (or a modification thereof) or the concept of temporal retention proposed in this study to place different forms of systems on a spectrum. It should be possible to hopefully move from the understanding offered by cellular automata – which are, as noted, a very important case study, but only one singular example – of how different systems can be differentiated informationally to an operational ranking of physical, astronomical systems in terms of degree of livingness. In other words, it should be possible to develop a broader and more comprehensive understanding of what life is without ever having to have left Earth itself.
Acknowledgements
The authors would like to thank Gaelan Steele (University of St Andrews) for her help at every stage in this process, as well as Sina Khajehabdollahi, Eve Moore and Mia Corliss for their helpful insights and commentary. This work received no funding.


 Open access

