


If there is an interest group understood to be powerful in American politics, it is business. Decades ago, following classic accounts of private power in American government (e.g., Lowi Reference Lowi1969; McConnell Reference McConnell1967; Schattschneider Reference Schattschneider1960), many political scientists converged on the view that business held a privileged position in the pressure group system and that this posed unique challenges to American democracy (Dahl and Lindblom Reference Dahl and Lindblom1976; Lindblom Reference Lindblom1977; see Vogel Reference Vogel1987). Much has changed in American politics since then, but more recent assessments of interest group activity in Washington, DC, find much the same: a massive overrepresentation of corporations and business interests and—in the modern era—a relatively small presence of labor organizations (e.g., Drutman Reference Drutman2015; Hacker and Pierson Reference Hacker and Pierson2010; Schlozman, Verba, and Brady Reference Schlozman, Verba and Brady2012).
As for the effects of business influence, there is some debate, but one prominent conclusion is that in the United States, it mostly works to push policy to the right—in a conservative direction, in favor of Republicans and smaller government. Although there have been cases of businesses and business associations supporting expansion of the American welfare state (Hertel-Fernandez, Skocpol, and Lynch Reference Hertel-Fernandez, Skocpol and Lynch2016; Swenson Reference Swenson2002; Reference Swenson2018) and there is heterogeneity in the policy preferences of business associations and elites (Broockman, Ferenstein, and Malhotra Reference Broockman, Ferenstein and Malhotra2019; Crosson, Furnas, and Lorenz Reference Crosson, Furnas and Lorenz2020; Hersh Reference Hersh2023), much of the modern American politics literature generally portrays business associations and corporations as constituencies of the Republican Party, right-leaning forces working against unions, and entities with economically conservative policy preferences, such as less regulation and lower taxes and spending (e.g., Franko, Kelly, and Witko Reference Franko, Kelly and Witko2016; Gilens, Patterson, and Haines Reference Gilens, Patterson and Haines2021; Hacker et al. Reference Hacker, Hertel-Fernandez, Pierson, Thelen, Hacker, Hertel-Fernandez, Pierson and Thelen2022; Hacker and Pierson Reference Hacker and Pierson2016; Hertel-Fernandez Reference Hertel-Fernandez2019; Martin and Swank Reference Martin and Swank2012; Rahman and Thelen Reference Rahman, Thelen, Hacker, Hertel-Fernandez, Pierson and Thelen2022; Smith Reference Smith2000; Vogel Reference Vogel2003).
As vast as the literature on business power is, however, it has neglected an important part of American government: its tens of thousands of local governments. Collectively, America’s cities, counties, school districts, and special districts spend roughly $2.2 trillion each year and employ more than 11 million people on a full-time basis—far more than the 2.9 million employed by the federal government in 2023 or the 3.9 million full-time employees of the states (US Census Bureau 2023; 2024). At the turn of the twentieth century, moreover, US local governments constituted most of what government was: they raised more revenue and had higher expenditures than the federal and state governments combined (Derthick Reference Derthick, Schuck and Wilson2008). Perhaps most importantly, local governments have primary policy-making authority in areas including housing, policing, fire protection, public education, and infrastructure. And although there has been a surge in research on US local politics in recent years (Trounstine Reference Trounstine2020; Warshaw Reference Warshaw2019), much of it has focused on questions related to partisanship, ideology, and the political representation of voters. Little work has investigated the representation of business or businesses’ positions on local government policies like taxes and public services.
This essay starts to bridge these gaps. First, I develop a theory of business’s relationship to local governments, such as cities. To align with a major emphasis of scholarship on business power in national government—namely, business’s stances on the taxing and spending associated with the welfare state—I focus on business’s stances on local government taxing and spending. In contrast to the prominent view of the US business community as anti-government, I propose that business’s city-specific relationship to government often puts it in a position of supporting government—and in alignment with unions.
To see why, it is important to adopt a policy-focused approach and consider what local governments do (Anzia Reference Anzia2022; Hacker and Pierson Reference Hacker and Pierson2014). The areas in which local governments have policy authority are mostly different from those of the federal government. Most cities, for example, do not engage in much redistributive policy and spend exceedingly little on welfare (Einstein and Kogan Reference Einstein and Kogan2016; Peterson Reference Peterson1981). They are, however, heavily involved in economic development and land use, building and maintaining sewers and roads, and providing public services like public safety. Many of these services are important to the success and smooth operation of business. Furthermore, because of the relatively small geographic scale of local government, when there are improvements or deteriorations in local services, the business community experiences those changes directly. Some may be in positions to “vote with their feet” (e.g., Tiebout Reference Tiebout1956), but the feasibility of “exit” is limited for many others (e.g., Hirschman Reference Hirschman1970; see Fischel Reference Fischel2001). Regardless, local chambers of commerce exist to represent the interests of the businesses that are in the city (Anzia Reference Anzia2022). Thus, in local government, there is reason to expect business to favor well-funded, competent government.
Second, I take preliminary steps to evaluate this argument empirically, although doing so is challenging. As a general matter, acquiring data on local governments is difficult, and measuring local interest group activity is especially so. Moreover, my argument is about more than the activity of interest groups: it is also about their preferences and interests, which are even more difficult to ascertain (see Bonica Reference Bonica2013; Broockman Reference Broockman2019; Crosson, Furnas, and Lorenz Reference Crosson, Furnas and Lorenz2020; Hartney and Kogan Reference Hartney and Kogan2025). Because of these challenges, quantitative analyses commonly rely on assumptions about business preferences, rather than measuring them directly (e.g., Anzia Reference Anzia2022; Martin and Swank Reference Martin and Swank2012). Yet in this case, one of the goals of the empirical analysis is precisely to interrogate assumptions common in the literature.
As a way of overcoming some of these challenges and making headway, I focus on tax ballot measures in California cities. Because state and local tax arrangements vary considerably across states, it is worthwhile to focus on a single state to hold constant many of those legal and political structures. California is a large, diverse state with several hundred local governments varying in size, including many larger cities. Especially helpful for this analysis is that California’s constitution requires local tax increases to be supported by a requisite share of voters in an election. The California Elections Data Archive (CEDA), moreover, compiles basic information about all local ballot measures in the state for the last two decades.
There is much to be learned from these data, but most importantly for my purposes here, groups and individuals can and do contribute money to the campaigns for and against these ballot measures. To gain visibility into who contributes funds in favor of and in opposition to proposed tax increases, I acquired and hand-entered data from itemized campaign disclosure forms for 115 unique ballot measures in California cities that proposed increases to local sales or business license taxes. The data reveal considerable activity by businesses and unions, particularly municipal employee unions. Strikingly, the overwhelming majority of business contributions are made in support of local tax increases. In addition, in a thorough review of the websites of 185 California local chambers of commerce, I find that local business associations support local tax and bond ballot measures much more often than they oppose them.
Together, these findings reveal a context within the United States where business appears to be supportive of government and on the same side as unions. They also underscore the need for more research on a host of important questions, such as how business support for government varies across place, time, type of business, and policy issue—including at the levels of federal and state government. As I discuss in the concluding section, research along these lines would broaden our understanding of the American political economy, and it could also inspire further theory-building on business–government relations in democracies around the world.
Literature and Theory
In research on interest groups and representation in modern American politics, numerous studies have found that corporations and trade associations have a greater presence in Washington, DC, than labor unions and other groups with less privileged members (Baumgartner and Leech Reference Baumgartner and Leech2001; Schattschneider Reference Schattschneider1960; Schlozman, Verba, and Brady Reference Schlozman, Verba and Brady2012; Walker Reference Walker1991), especially when it comes to money in politics (Drutman Reference Drutman2015; Witko Reference Witko2017; Witko and Newmark Reference Witko and Newmark2005). Moreover, a large swath of the literature argues that this superior position of business works to push policies to the right, in a conservative direction. One reason for this is the long-standing alliance between business and the Republican Party (Brunell Reference Brunell2005; Vogel Reference Vogel2003; Waterhouse Reference Waterhouse Benjamin2013). Another is the perception that class conflict looms large in American politics, with labor or the working class on one side and business and the wealthy on the other (see Hacker et al. Reference Hacker, Hertel-Fernandez, Pierson, Thelen, Hacker, Hertel-Fernandez, Pierson and Thelen2022). Quantitative analysis also shows a Republican bent to American business: members of executive teams in US firms give more in contributions to Republican candidates (Bonica Reference Bonica2016; Fos, Kempf, and Tsoutsoura Reference Fos, Kempf and Tsoutsoura2026). Corporate contributions appear to help Republicans get elected to state legislatures (Hall Reference Hall2016). In addition, research shows that members of Congress and state legislative candidates from business backgrounds are more conservative and pro-business than their counterparts from working-class backgrounds (Carnes Reference Carnes2013; Reference Carnes2018; Witko and Friedman Reference Witko and Friedman2008). The result, multiple studies conclude, is that corporate influence leads to more conservative policies and outcomes favorable to the wealthy (Franko, Kelly, and Witko Reference Franko, Kelly and Witko2016; Gilens, Patterson, and Haines Reference Gilens, Patterson and Haines2021; Hertel-Fernandez Reference Hertel-Fernandez2019).Footnote 1
Other research, however, suggests there is nothing fixed nor inevitable about any conservative or right-leaning orientation of business, even on matters of government spending.Footnote 2 Martin and Swank (Reference Martin and Swank2012) argue that business support for social spending in a country depends on the ways in which business organizations first took shape. Swenson (Reference Swenson2002; Reference Swenson2018) finds that even American businesses varied in how they viewed the New Deal expansion of the welfare state and the adoption of Medicare. Hacker and Pierson (Reference Hacker and Pierson2016) show that the relationship between American business and government dramatically changed between the mid-twentieth century, when major national business associations supported the “mixed economy,” to the late twentieth century, when the US Chamber of Commerce and other business associations allied with the Republican Party. Smith (Reference Smith2000) also theorizes about why the US Chamber is conservative: it only takes positions on issues that unify American business, which tend to be ideological matters dealing with the role of government intervention in the economy.Footnote 3 Thus, in addition to offering theories of why American business leans conservative, this literature, viewed as a whole, suggests that business’s relationship to government depends on the context.
What, then, of the context of US local government in the modern era? To date, there is strikingly little theory or empirical research that addresses this question. Although business executives and local chambers of commerce played important roles in supporting the growth of local governments in the early twentieth century (e.g., Amsterdam Reference Amsterdam2016), few have studied the stances of businesses in local government today, and the most relevant literature presents a confusing and mixed picture. The urban regime tradition underscores the importance of business to city governance but focuses almost exclusively on land use and development (e.g., Logan and Molotch Reference Logan and Molotch1987; Stone Reference Stone1989). Other research examines local government revenue and spending but focuses on partisanship and ideology, such as Kirkland (Reference Kirkland2021), who proposes that electing business executives as mayors should lead to lower taxes and more conservative policies. In my work, I have offered a different take, arguing that partisanship and national ideology are less important in the local context and finding that business and labor are rarely on opposite sides of the same issues in city politics (Anzia Reference Anzia2022). It is worth underscoring, moreover, that throughout this small literature, there is no attempt to directly measure businesses’ positions on local taxes and services.
It is also not clear that theories built to explain business–government relations in national politics are a good fit for local government. Much of that national literature focuses on business associations’ positions on social spending and the welfare state (e.g., Hacker and Pierson Reference Hacker and Pierson2002; Martin and Swank Reference Martin and Swank2012; Skocpol Reference Skocpol1995; Swenson Reference Swenson2002; Reference Swenson2018) and reasonably so: roughly two-thirds of federal spending goes toward mandatory spending, mainly Social Security and the major national healthcare programs. But these are not major functions of US city governments (Einstein and Kogan Reference Einstein and Kogan2016; Peterson Reference Peterson1981). Other theories point to the dilemmas that national business associations confront in trying to represent a massive, heterogeneous set of business constituencies (e.g., Smith Reference Smith2000), especially in an era of partisan polarization and pressure from competing business associations (Hacker and Pierson Reference Hacker and Pierson2016). But if these are proposed reasons why US national business associations came to favor limited federal government, we might not expect the same to have happened to local business associations, which are smaller, have less heterogeneous membership, and deal with local governments—most of which are formally nonpartisan.
To theorize about local interest groups’ preferences, it is more productive to adopt a local-level, policy-focused approach. Consider labor—a mostly straightforward, intuitive case. We should expect that public-sector unions will be highly active in local politics and that they should generally favor larger local government (Anzia and Moe Reference Anzia and Moe2015; DiSalvo Reference DiSalvo2015; Hartney Reference Hartney2022; Moe Reference Moe2011). Most of the operating funds of city government go toward paying employees to provide public services like police and fire protection. More funding for city governments therefore means more money for union members and their compensation. It is true that labor has long allied itself with the Democratic Party in national and state politics (Dark Reference Dark1999) and that the Democratic Party has been the major party more favorable toward a greater role of government. But public-sector unions’ locally based interests are equally if not more important. I expect public-sector unions to be supportive of increases in taxes unless the additional money is slated for a purpose that does not benefit unionized employees. Even unions of police officers and firefighters, whose members and leaders may lean Republican in national politics (Ba et al. Reference Ba, Ge, Kaplan, Knox, Komisarchik, Lanzalotto, Mariman, Mummolo, Rivera and Torres2025; Zoorob Reference Zoorob2019), can be expected to support increases in revenue for city governments.
What, then, should we expect the stances of businesses and business associations to be on matters of local taxation and the size of government? To answer this question, it helps to think about (1) the nature of the taxes, what those taxes go to pay for, and how all of that aligns with the interests of business and (2) the relatively smaller scale and scope of local government.
As a starting point, it is important to state clearly that businesses almost certainly prefer lower tax environments to higher tax environments, all else equal. Moreover, cities must be attuned to the tax environment to attract and retain tax-paying individuals and businesses (see Peterson Reference Peterson1981). That said, not all taxes are equally burdensome to businesses. Even in national politics, the business community takes different stances on corporate taxes than, for example, excise taxes on cigarettes. In cities, states have different arrangements for how their local governments can raise revenue, but by comparison, city revenue-raising capabilities are much more constrained, and cities depend more on property taxes and sales taxes than, for instance, income taxes.Footnote 4 One possibility, then, is that business preferences on local taxes depend on the type of tax. Specifically, the business community might have more negative views toward taxes that disproportionately affect business, such as business license taxes.
Just as important are considerations of the benefits business gets from city government and what city revenue is used to pay for. Businesses have a strong stake in many of the services city governments provide, including police protection, fire protection, infrastructure maintenance such as roads and sidewalks, and refuse collection and street sweeping. Not only are these the responsibilities of most cities but they also make up a very large share of city spending, especially police and fire protection. The success of businesses hinges critically on cities providing these services effectively (see Burns Reference Burns1994).
Notably, some of the ways businesses benefit from city government are particularistic, such as the material benefits or rents that city services can provide to them. For example, when a city builds, repairs, and maintains infrastructure, that city activity generates jobs in construction and civil engineering and business for asphalt companies and land-use law firms. Many cities also contract with refuse-collection companies, street-sweeping companies, and other businesses, and those businesses also benefit from a well-funded city able to pay for those contracts.
But business interests in city government go beyond procurement and contracts. The viability and profitability of businesses can very much depend on the collective goods that cities are responsible for providing. Businesses rely on cities’ provision of public safety and emergency response services. Their operations are affected by the quality and maintenance of infrastructure and public spaces: roads and sidewalks, clean streets, traffic and parking management, functioning sewers, and more. Businesses want local governments to have the capacity to carry out these responsibilities, which requires adequate revenues to pay police officers and repair sewers—and these kinds of functions are a large share of city government expenditures. Because businesses benefit from and depend on city services, moreover, I expect that they engage in city politics in pursuit of those interests. Perhaps, moreover, they sometimes support higher taxes to fund them.
A skeptic might point to the mobility of business as a reason why it would not invest in city politics, especially in favor of higher taxes. This is an important consideration, of course. A large national or multinational firm would rarely feel compelled to invest in the politics of a particular city, even if it did benefit from the city’s services; even a regionally or locally based business probably would not invest either if it could easily bring that business to another city with a more favorable environment. This is likely the case for many businesses. At the same time, the ease of business mobility should not be overstated. Many businesses, especially those that are locally and regionally based, cannot easily move their operations to another city. Because of this, a local arborist, construction company, or restaurant is probably more likely to participate in city politics than corporations like Walmart or Citibank. Moreover, local chambers of commerce are set up to represent the businesses that are located in that area. They cannot move to another state if services, taxes, or government relations deteriorate in their city; they exist to represent the interests of business in that city.
The smaller scale and scope of city government probably also make a difference. The business community of a municipal government is naturally a smaller group than the business community of the United States, and that should make it easier for businesses in a municipal government to overcome the collective action problem and invest in local public goods (Moe Reference Moe1981; Olson Reference Olson1965). For businesses in the area, moreover, the effects of city government actions hit close to home. If a business is concerned about rising property crime in the area, and that business and others around it support an initiative to increase city revenue, there is a reasonable chance that revenue will go toward policing (because that is a major function of city government), and the business will feel the effects of that quite directly. Although the business may not like the increase in taxes such as the sales tax, the smaller scale of city politics (as compared to state or national) makes it more likely that the marginal benefit of the tax increase exceeds the marginal cost for that business.Footnote 5 Because of this, it stands to reason that businesses would support local taxes and city revenue generation more than they would for larger governments.
This, then, is the core of my argument about businesses’ positions on matters of city government funding. They prefer lower taxes to higher taxes but also place high value on some of the services cities provide. When it comes to local government, the business community has a strong stake in government being effective and well-funded. This may imply that businesses do not regularly mount strong opposition to efforts to increase city revenue, and it could even mean that they sometimes support them.
A Test Case: City Tax Ballot Measures
To preliminarily evaluate these expectations, I examined patterns of interest group contributions to campaigns in support of and opposition to local tax ballot measures (Anzia Reference Anzia2026). My goal was not to test expectations about influence nor to evaluate the effect of money on local ballot measures but instead to examine data on groups’ support for or opposition to key local issues. Notably, with this approach, instead of assuming businesses’ positions on local policy matters, one can observe them.
Because it focuses on proposed changes to taxes, this approach is also a departure from much of what is done in the local politics literature. There is already a large amount of research examining patterns in city spending thanks to US Census Bureau data on local government expenditures by functional category. Although the census also provides data on local revenue by source (e.g., amounts from sales taxes), it does not track efforts to change taxes at the local level, such as by expanding the base or increasing rates. By focusing on local tax proposals, my analysis therefore examines an aspect of local politics that remains understudied.Footnote 6
States vary greatly in the types of local governments they have and the responsibilities of each type; local governments’ abilities to raise revenue also differ considerably by state. For this reason, it makes sense to begin with a single state and a single type of local government to hold constant much of that variation (see Nicholson-Crotty and Meier Reference Nicholson-Crotty and Meier2002). I focus mainly on California city governments for several practical reasons. California has 482 municipal governments, and they vary in population size, population diversity, and political leanings in national politics. Because of California’s Proposition 13, any new local tax proposed to fund specific programs has to be approved by two-thirds of the voters in the jurisdiction; Proposition 218 (passed in 1996) further stipulates that any new general tax (to fund general services) must be approved by a majority of voters.Footnote 7 Typically, this means that the legislature governing the jurisdiction votes to put the tax increase measure on the ballot, but tax increase measures can also be put on the ballot through citizen initiative. These requirements are useful for my purposes because they mean that California cities have elections in which constituents vote on whether to increase local taxes—and groups and individuals can give money to those ballot measure campaigns.
Moreover, the California Elections Data Archive (CEDA) compiles data on the elections for counties, cities, and school districts throughout the state, including local ballot measures. This is a valuable resource in that it provides a list of the measures that appeared on local ballots since the late 1990s, along with basic information about them. In what follows, to provide context for my campaign contribution data collection and analysis, I provide some background on California city taxes and the local ballot measures that California residents voted on during the three-year period of 2018 to 2020.
Background on California City Taxes
Cities in California, as elsewhere, are limited in their ability to raise revenue. Although a considerable share of city revenue comes from fees (such as utility and user fees), their unrestricted (discretionary) revenue comes from taxes, and property taxes are typically the largest source. However, because of Proposition 13, cities’ ability to raise property tax revenue is severely constrained: assessed value growth and rates are capped unless the city gets two-thirds of voters’ approval to fund a general obligation (GO) bond. GO bonds are used to finance large capital projects such as roads, bridges, water systems, and school buildings, and property taxes are increased to repay the bonds (Institute for Local Government 2016).
After property taxes, the largest source of discretionary revenue for California cities is the transaction and use tax, or “sales tax.” The state imposes a 7.5% sales tax rate statewide, and a small portion of that revenue is distributed to the cities of the transactions. But cities and counties can also impose additional sales taxes up to a cap of 10.25% in total, such that the revenue generated by the additional tax remains in the jurisdiction. Proposals to increase sales taxes must be supported by a majority of voters if the revenue is for general purposes and two-thirds of voters if the revenue will be designated for a specific purpose.Footnote 8
In addition to property and sales taxes, most cities in California also have a business license tax. The specifics of business taxes vary, however, and are harder to characterize in a general way. Although most are levied on gross receipts, these taxes can also target specific aspects of businesses. Most cities also have a transient occupancy tax (hotel tax), many have utility user taxes, and some also have parcel taxes (a form of property tax), documentary transfer taxes, and other less common taxes (Institute for Local Government 2016). In addition to tax revenue, cities get substantial revenue from fees, but for most of that fee revenue, there are requirements that the funds generated by them go toward the provision of those services, such as utilities.
Overview of Local Ballot Measures, 2018–20
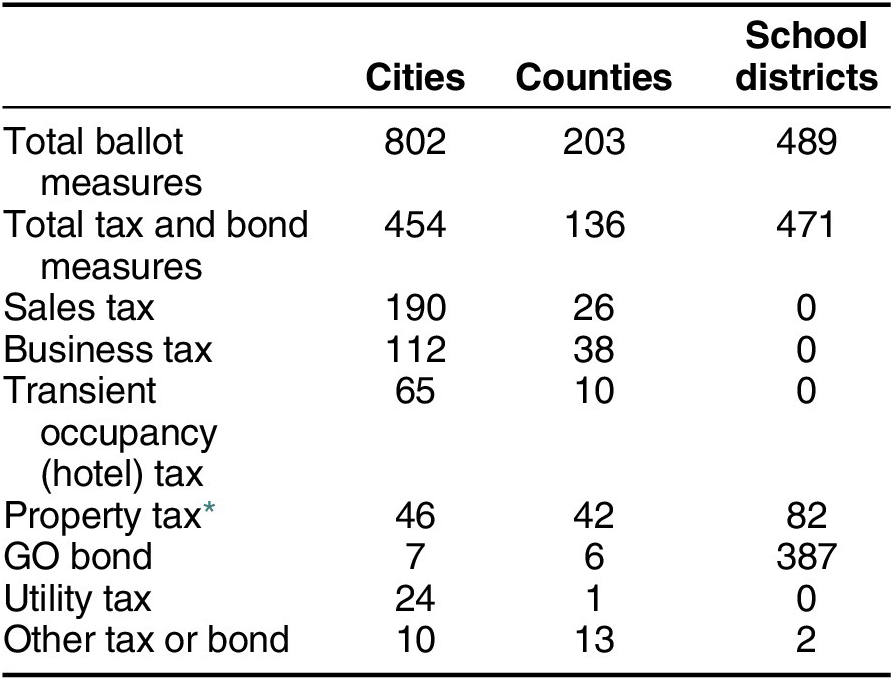
In California, many local governments have proposed revenue increases in recent years, and most of those proposals have passed. Table 1 shows the total number of local ballot measures from 2018 to 2020 broken down into cities, counties, and school districts. Of the 1,494 ballot measures during that period, the largest set—802—were on the ballot in cities. Of those, 454 were tax and bond measures. For cities, the most common kinds of tax and bond measures were sales and business license taxes. There were also several hotel and property taxes on the ballot in cities, but few GO bond measures. In contrast, the modal tax and bond measure in counties was a property tax measure, whereas the most common type in school districts was a GO bond.
California Local Ballot Measures, 2018–20

Table 1 Long description
The table consists of four columns: Category, Cities, Counties, and School districts.
Total ballot measures: Cities 802, Counties 203, School districts 489.
Total tax and bond measures: Cities 454, Counties 136, School districts 471.
Breakdown by tax type:
Sales tax: Cities 190, Counties 26, School districts 0.
Business tax: Cities 112, Counties 38, School districts 0.
Transient occupancy hotel tax: Cities 65, Counties 10, School districts 0.
Property tax including parcel and documentary transfer taxes: Cities 46, Counties 42, School districts 82.
G O bond: Cities 7, Counties 6, School districts 387.
Utility tax: Cities 24, Counties 1, School districts 0.
Other tax or bond: Cities 10, Counties 13, School districts 2.
* Includes parcel taxes and documentary transfer taxes.
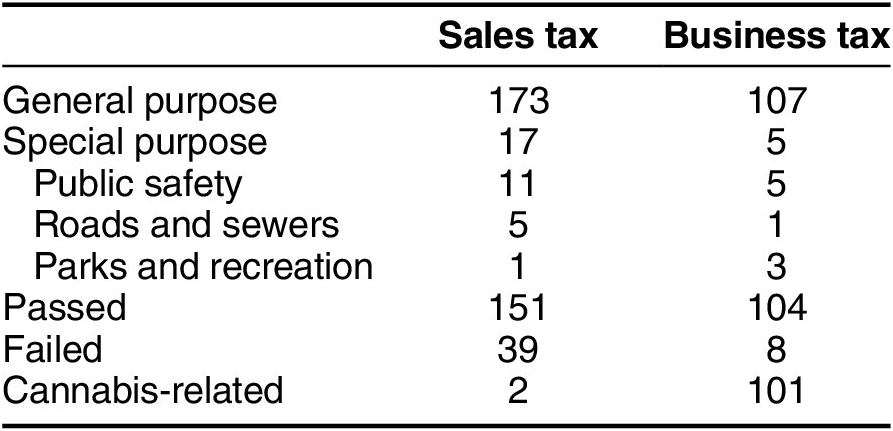
Table 2 provides additional information about the 302 sales and business tax measures in cities. A small number in each category were “special taxes,” meaning taxes for specific purposes, most of which were to fund public safety (police, fire, or emergency services); a few were for roads and sewers or parks and recreation (sometimes both). However, the vast majority of the tax increases were proposed to fund “general services,” meaning the resulting funds would not be formally tagged for specific budget items. The primary reason for the greater popularity of general taxes is likely that the threshold for passage is lower: 50% of voters compared to two-thirds for special taxes. It is also generally understood that general taxes would help fund public safety: in most cities, a majority of operating expenditures goes toward police and fire protection, and the ballot measure language for almost all the “general services” tax measures features public safety (e.g., 911 emergency response, paramedics, community policing, crime investigation) as services that would be shored up by the additional funding.Footnote 9
Sales and Business Tax Ballot Measures, 2018–20

Table 2 Long description
The table consists of three columns: Category, Sales tax, and Business tax.
* General purpose: Sales tax has 173 measures; Business tax has 107 measures.
* Special purpose: Sales tax has 17 measures; Business tax has 5 measures. This is further broken down into:
* Public safety: 11 Sales tax, 5 Business tax.
* Roads and sewers: 5 Sales tax, 1 Business tax.
* Parks and recreation: 1 Sales tax, 3 Business tax.
* Outcomes:
* Passed: 151 Sales tax, 104 Business tax.
* Failed: 39 Sales tax, 8 Business tax.
* Cannabis-related: 2 Sales tax, 101 Business tax.
Most of the sales tax measures passed, as did nearly all the business tax measures. Importantly, all but 11 of the business tax measures were cannabis business taxes. (Proposition 64, which legalized the recreational use of cannabis in California, passed in November 2016, leading to a flurry of cities proposing cannabis business taxes in subsequent years.) Of all these ballot measures, moreover, only one (which failed) proposed to decrease or repeal taxes; the rest proposed tax increases or extensions of sunsetting tax increases.
Conditional on being on the ballot during these three years, then, tax increases passed at very high rates. Because of the selection issues—they were probably put on the ballot in places where council members believed they would succeed, a point I return to later—we should not draw much from the high passage rates; yet at a minimum, we can see that for this period in California local governments, there were many efforts to increase these local taxes.Footnote 10
Campaign Contributions to Local Tax Ballot Measures
To evaluate interest groups’ stances on local tax increases, I set out to collect all campaign finance records for the 302 sales and business tax measures on the ballot in cities between 2018 and 2020. Collecting these records is time consuming and difficult. First, local governments in California have a wide range of practices for keeping and sharing the records. Some city clerks had online databases of campaign disclosure forms for these three years that could be searched for records. However, some had those public information portals for only the most recent years, not as far back as 2018, and other cities did not provide any website with 2018–20 disclosure data. For the latter two types of cases, I submitted public records requests for the relevant disclosure forms and sent follow-up requests when the city clerks’ offices did not respond.
Second, organizations and individuals can contribute funds in a variety of ways, which complicates efforts to track the flow of money. For most of the measures, committees called “primarily formed” committees are established to support or oppose a particular ballot measure (or sometimes two ballot measures). These committees indicate the ballot measure and position in their name and file regular reports of contributions received and expenditures made. In addition, “general-purpose” committees can support or oppose ballot measures. Sometimes called “issues” committees, these are formed to raise and spend funds over a longer period and for a variety of elections and ballot measures. They, too, report contributions and expenditures (Fair Political Practices Commission 2024). Finally, individuals or entities that use their funds to make independent expenditures of over $1,000 must also report those within 24 hours.
Of the 302 tax measures I targeted, I acquired campaign contribution forms for 115: these covered 105 cities and included 94 sales tax measures (including the sole repeal proposal) and 21 business tax measures (18 related to cannabis). The forms I acquired were typically PDF scans, sometimes handwritten, and so I hand-entered the itemized data. I entered all itemized monetary and nonmonetary contributions to primarily formed committees but excluded loans. In the small number of cases where a general-purpose committee devoted resources to a measure that did not go through a primarily formed committee, I reviewed the expenditures sections of its reports to determine the amounts spent on the ballot measure. Although I entered all itemized contributions from individuals or organizations and institutions, my focus was on the groups, organizations, and businesses, so I did not enter the names of the individual contributors. Finally, for the few ballot measures that had independent expenditures, I also entered these amounts, including whether they were in support of or in opposition to the measure, and what they were for—typically, yard signs, mailers, and Facebook ads.
I recorded 2,387 itemized contributions from individuals, groups, and organizations for a total of almost $10 million. The vast majority of the contributions came through primarily formed or general committees: $9,384,126 in total, compared to $339,823 spent through independent expenditures. A much larger amount was contributed in support of these taxes than in opposition to them. In all, $7,212,727 was spent in support (counting opposition to the repeal as support) compared to $2,511,221 in opposition.
The total amounts of spending varied considerably across ballot measures, however. For some, contribution totals amounted to merely a few hundred dollars. For 53% of the 302 measures, moreover, the city clerks reported that there were no filings for the measure, suggesting little to no money in those campaigns.Footnote 11 However, for most of the measures in the dataset, tens of thousands of dollars were contributed. At the high end, Fresno Measure P saw approximately $522,000 in opposition and more than $2.3 million in favor. One final feature of the overall dataset worth noting is that, for most of the 115 ballot measures, there was only spending on the support side. Table A4 of the online appendix lists each of the measures, their type, and the total amounts spent in support and opposition. Only 18 measures had spending in opposition, one of which was the proposed sales tax repeal. Table A4 also shows that there were only 10 measures with spending on both the support and opposition sides.
Interest Group Contributions
My main goal was to evaluate the positions of businesses and unions on local tax increases, but first it was important to establish whether these interest groups were even regular contributors to such measures. If most of the money came from individual donors, it would be difficult to infer interest groups’ positions from patterns of contributions. American politics scholarship also focuses much more heavily on political parties than interest groups, so a critical step was to evaluate how much of the non-individual contributions came from political parties.
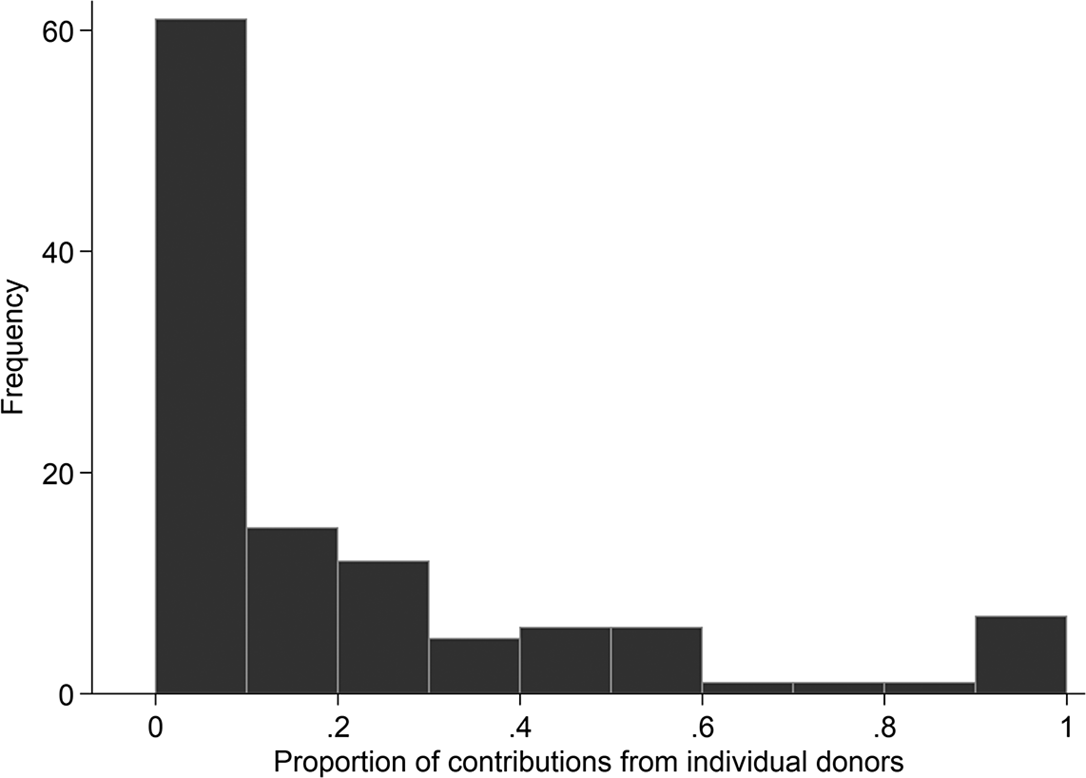
To do this, I hand-coded the source of each of the 2,387 contributions to identify all contributions from individuals and political parties. Figure 1 presents the distribution of the proportion of all money for each of the 115 ballot measures that came from individual donors. It shows that for most of these ballot measures, the share contributed by individuals is small: the median is 6%. There are only 16 measures for which individual contributors gave more than 50% of the funds toward the ballot measure and only 5 for which individuals were responsible for all the contributions. By comparison, 37 measures had no contributions from individuals. Of the total amount contributed to these 115 ballot measures, $2,199,445 was from individual contributors compared to $7,524,504 from non-individuals.
Proportion of Each Ballot Measure’s Contribution Amount from Individual Donors

Were political party organizations responsible for most of the non-individual money? These data show clearly that the answer is no. Of the roughly $7.5 million from non-individuals, less than $30,000 came from political parties: $20,000 from the Democratic Party and $5,810 from the Republican Party. Widening the net to include ideological groups like the Lincoln Club only yielded two more contributions of relatively small amounts. When they did give, these party and ideological groups behaved as one would expect, with Democratic and liberal groups supporting taxes and Republican and conservative groups opposing them. However, their contributions are a very small share of the total funds contributed.
Labor Unions
I also identified all contributions in the dataset made by labor unions and coded the unions by type. I created separate codes for unions of police officers, firefighters, other city employees (when I could verify that the union had a contract with the city or the union was solely government employees, such as AFSCME), and teachers. In addition, I created codes for unions of healthcare workers and the building trades, as well as a final code for other private-sector workers. In some cases, contributions came from a larger labor organization and could not be coded as representing a particular type of employee or a particular sector.
In total, labor unions contributed funds to 78 of the 115 tax ballot measures, and for those 78 measures, their contributions amounted to an average of 56% of total contributed funds in the election and 62% of the funds contributed by non-individuals. Labor unions are therefore prominent organizations in efforts to increase city revenue in California.
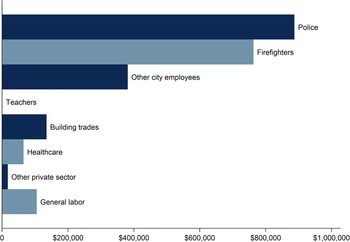
Figure 2 shows the total contribution amounts from each type of labor group. The figure makes it clear that city employee unions, especially police and firefighters’ unions, are by far the largest labor contributors. Police officers’ unions contributed more than $887,000 in total to these measures, firefighters’ unions gave almost $763,000, and other city employee unions another $381,000. In total, unions of city employees were responsible for 86% of the $2.35 million given by labor groups. Moreover, funding from public safety and other city employee unions was not concentrated among a few ballot measures. For almost all the measures with contributions from labor, most or all the funds were contributed by city employee unions (see the online appendix). Teachers, however, who are employed by independent school districts in California, barely gave anything to these city measures, and healthcare and other private-sector unions gave relatively smaller amounts. After public employees, the next largest groups of contributions came from building trades unions and general labor.
Total Contributions by Union Type

All these labor contributions went toward supporting taxes (and opposing the repeal) except for Fresno Measure P, which is the exception that proves the rule. That proposal was the sole special sales tax to fund city parks and facilities, as well as arts programs (see table 2). Police and firefighters’ unions each gave about $30,000 to oppose the measure, and other city employees’ unions, building trades unions, and general labor groups gave smaller amounts in opposition as well. Some in the city lamented that the proposed new revenue would not benefit public safety. There was also a perception that increasing taxes for parks, recreation, and arts programs would make it more difficult to increase taxes for public safety in the future (GV Wire 2018). In this case, then, opposition from city employee unions likely stemmed from these perceptions that the revenue would not benefit them.
Business
To explore whether and how businesses contribute to these campaigns, I identified all contributions coming from businesses or business association PACs. Whenever possible, I also coded the type of business by conducting a brief internet search of the company name reported on the form. Many businesses were straightforward to code and included restaurants and entertainment businesses, local businesses like auto repair shops, utility companies, refuse-collection and street-sweeping companies, transportation and shipping companies, homebuilders, construction companies and civil engineering firms, architects, property management companies, and real estate development firms. There were others, however—particularly some LLCs—where a brief search of the name did not yield any information about the nature of the business. Although I could categorize all such contributions as businesses, unfortunately I was unable to code them as anything more precise.
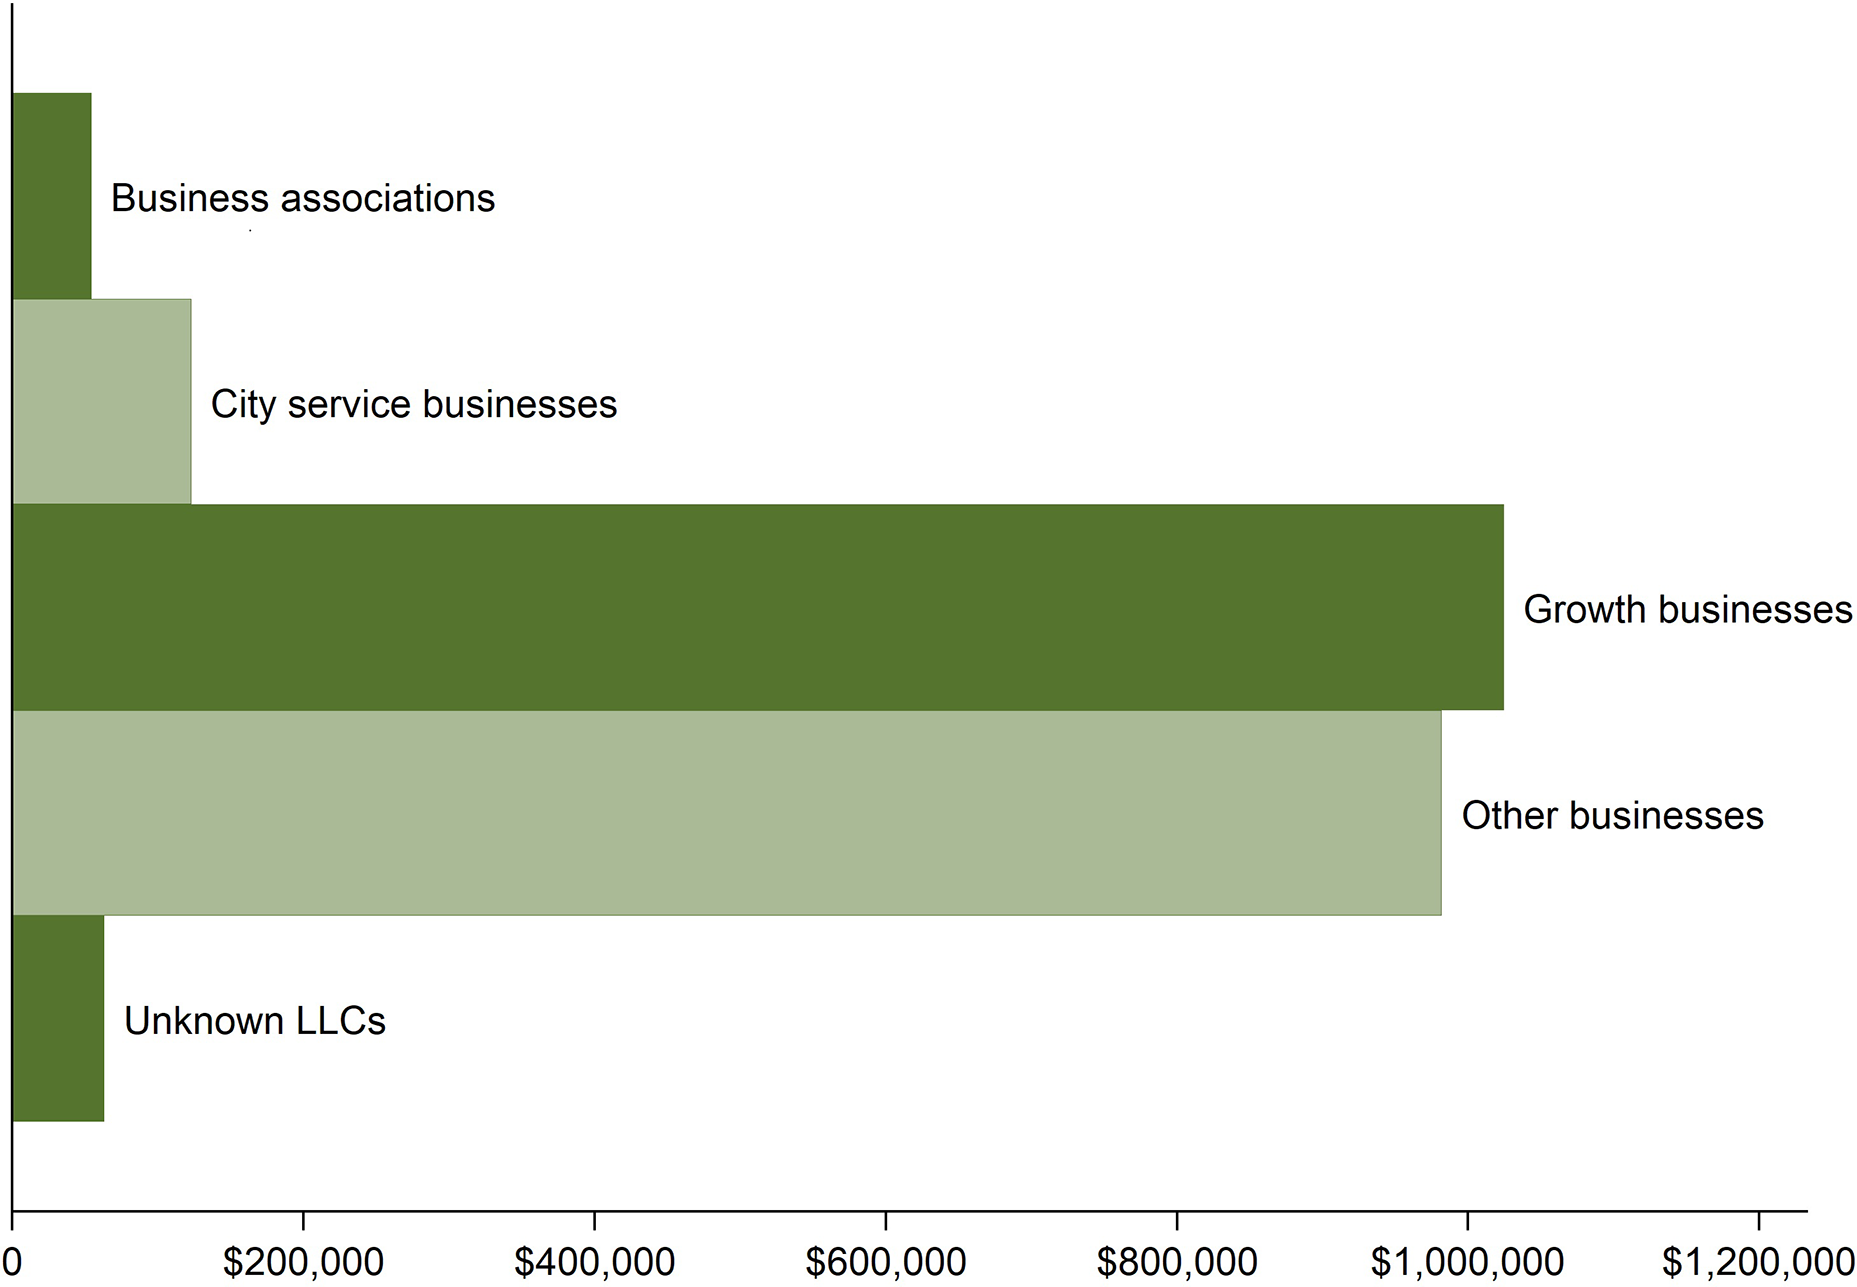
In total, businesses or business groups contributed to 83 of these 115 tax measure campaigns. For the average of those 83 ballot measures, business contributions amounted to 64% of the non-individual contribution amounts and 52% of the total contribution amounts. What kinds of businesses and business groups were contributing? Figure 3 presents a summary, breaking down contributions from businesses into those from (1) local chambers of commerce and other business associations; (2) businesses that likely provide city services, most notably garbage and recycling companies but also street-sweeping companies; (3) businesses clearly associated with growth, development, and land use (including homebuilders, real estate development firms, property management firms, construction companies, and civil engineering firms); (4) all other businesses I was able to code, including restaurants, hotels, law firms, cannabis dispensaries, consulting firms, and car dealerships; and (5) all those that I could not precisely code (the unknown LLCs). Figure 3 shows that local chambers of commerce do sometimes contribute money to these tax measures, but the incidence and amounts are relatively small. City service businesses such as waste management companies also provide a non-negligible amount to these ballot measures, as do LLCs that I could not code precisely. However, these amounts pale in comparison to those coming from businesses clearly related to growth (such as realtors) and the catch-all category that includes other businesses.
Total Contributions by Business Type

Most importantly, the vast majority of this money from business was given in support of the tax increases. In total, $1,725,506 was given by business in support of these sales and business tax increases, compared to $521,924 given in opposition. When I broke this down by measure, calculating the share of business money going to support the tax increase, I found that of the 83 measures in which business contributed, in 75 of them, all the business money was given in support, and in another 2, 95% and 96% of the money were given in support. There were only six ballot measures in which less than half of businesses’ contributed amounts were in support, one of which was Fresno Measure P.
Figure 4 shows, for each of the 83 ballot measures to which business contributed, the total amount of money contributed by businesses or business groups, broken down into whether the money was given in support of or in opposition to the tax increase. It presents these ballot measures in four sets, starting with the ballot measures that garnered the smallest amounts from business at the top left. For those 29 measures, where businesses gave less than $5,000 in total per measure, the business money was entirely supportive of the tax increases in 27. In the top-right corner are the next 22 measures, those with between $5,000 and $20,000 in contributions from business. Only in Lodi and San Bernardino was a fraction of business money opposed to the tax increase. Next, in the bottom left, are 22 measures with business contributions between $20,000 and $45,000. Except for Jurupa Valley, all the business money was in support of tax increases. And in the bottom-right corner are the final 10 measures. Fresno Measure P stands out with almost $500,000 in business money, mostly opposed to the tax. But other than that, the only measure with most business money opposed to the tax increase was a 2018 sales tax measure in Sacramento.
Business Contributions by Measure

Figure 4. Long description
The figure consists of four panels arranged in a two-by-two grid. Each panel features a horizontal bar chart where the Y axis lists city names followed by an initialism and a year, and the X axis represents the numerical measure of contribution. A legend at the bottom indicates green bars represent Support and red bars represent Oppose.
Top-Left Panel. The X axis ranges from 0 to 5,000. It contains 30 entries. Most bars are green, showing a steady increase in support from Carpinteria X 2018 at near zero to Manteca Z 2020 at approximately 4,500. Small red segments indicating opposition are visible for Claremont C R 2019, Santa Cruz S 2018, and Turlock A 2020.
Top-Right Panel. The X axis ranges from 0 to 20,000. It contains 25 entries. Support increases from San Bernardino S 2020 at approximately 2,000 to Lemon Grove S 2020 at 20,000. Notable red opposition segments appear for San Bernardino S 2020 and Lodi L 2018.
Bottom-Left Panel. The X axis ranges from 0 to 40,000. It contains 24 entries. Support levels start at approximately 21,000 for Commerce V S 2020 and rise to 40,000 for Santa Ana X 2018. Jurupa Valley U 2020 is uniquely represented by a solid red bar at approximately 34,000.
Bottom-Right Panel. The X axis ranges from 0 to 500,000. It contains 10 entries. This panel shows the highest values. Most entries show support between 50,000 and 180,000. Sacramento U 2018 is shown as a solid red bar at approximately 80,000. Fresno P 2018 shows a small green support segment followed by a very large red opposition segment extending to 460,000.
From these years in California, then, it does not appear that business is anti-government or anti-tax: businesses overwhelmingly contributed money in support of these recent city government proposals to increase taxes.
Local Chambers of Commerce Endorsements
One finding that may strike some as surprising is that a relatively small share of the business contributions come from local chambers of commerce. Moreover, it is possible that many of the individual businesses, including those in the “other businesses” category, contribute to these campaigns because they stand to gain in a direct financial way, such as through a contract with the city, whereas local chambers of commerce are more likely to be focused on collective goods and city service provision. As a way of assessing whether local chambers of commerce engaged in these tax ballot measure campaigns in other ways, during the fall of 2024, I reviewed the website content of all 185 local chambers of commerce listed in CalChamber’s Local Chambers Lookup.Footnote 12 For each, I coded a number of features, including whether (1) it mentioned having a PAC; (2) it claimed to engage in local government advocacy; (3) it provided specifics about the chamber’s issue priorities or policy positions; and (4) there was any mention of the chamber’s positions on local tax and bond ballot measures.
Only 34 of these 185 local chambers (18%) reported having a PAC, which likely explains why so few of these tax ballot measure campaigns received contributions from local chambers. However, a large majority of these chambers—81%—stated on their websites that they engage in advocacy at the local government level. Moreover, 94 of the 185 chambers’ websites featured some kind of description of local issues they focus on (in addition to economic development and promoting a business-friendly environment, which virtually all do).Footnote 13
Many of the local chambers’ websites (68 in total) also had statements about their stances on taxes. Almost universally, these statements were quite broad. No chamber in this set of 68 made a strong statement about opposing taxes or tax increases. Instead, most took the position that taxes should be fair and reasonable to business, should not be overly burdensome, and should not discourage business investment in the community. Some even underscored the necessity of taxes, such as two local chambers that stated on their websites, “Taxes are a fact of life” (Santee Chamber of Commerce 2024; Truckee Chamber of Commerce 2023), and another that stated, “Taxes are essential to the governmental system” (Torrance Area Chamber of Commerce 2024).
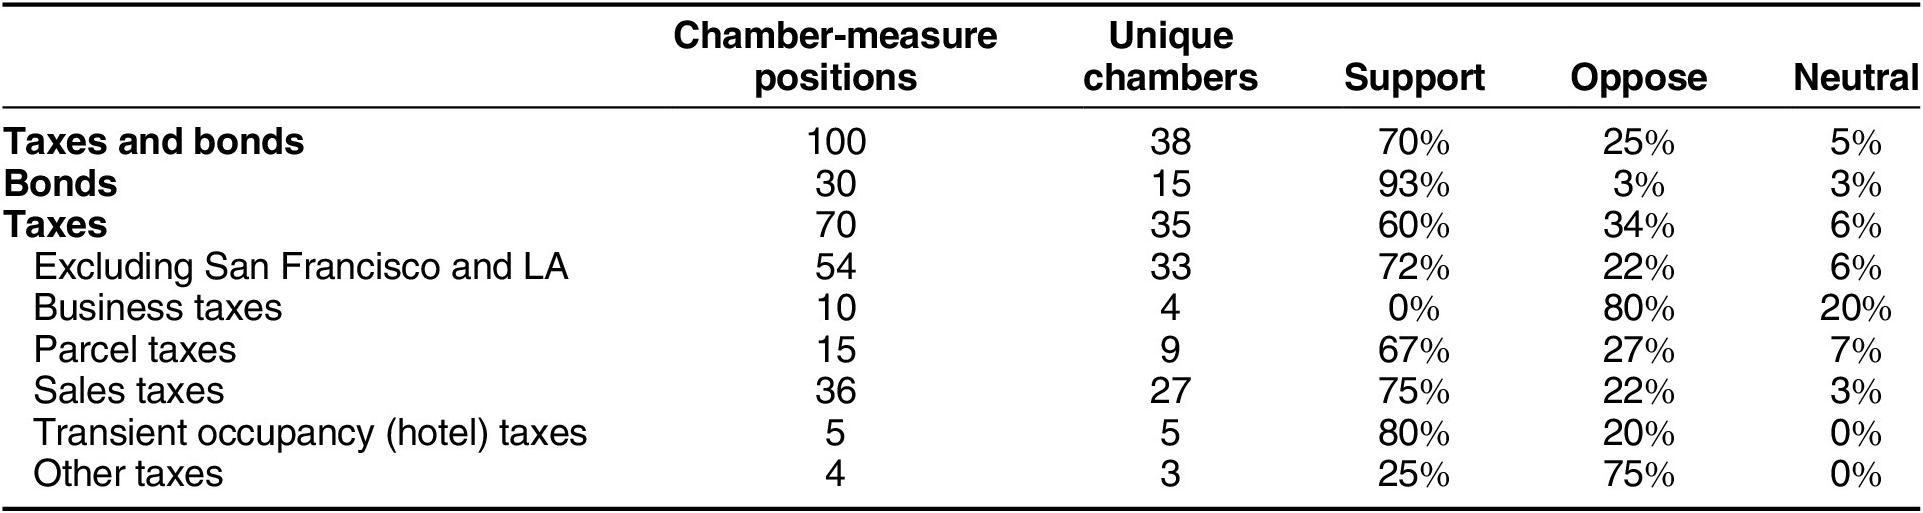
In addition, for 38 of the chambers, I found statements of their positions on specific local government tax and bond ballot measures. For most of those chambers, I was only able to find a position on one or two such ballot measures, typically those that had been on the ballot within the last five years. For a small number of chambers, however—most notably in San Francisco, Los Angeles, and Los Altos—their websites presented their positions on many measures, in some cases going further back in time. As I show in table 3, I found a total of 100 chamber positions on efforts to increase taxes or issue bonds (backed by taxes).Footnote 14 The local chambers took supportive positions in 70% of those cases.
California Local Chambers of Commerce’s Positions on Local Tax and Bond Ballot Measures

Table 3 Long description
The table consists of six columns: Measure Category, Chamber-measure positions, Unique chambers, Support percentage, Oppose percentage, and Neutral percentage.
* Taxes and bonds: 100 positions, 38 unique chambers, 70 percent support, 25 percent oppose, 5 percent neutral.
* Bonds: 30 positions, 15 unique chambers, 93 percent support, 3 percent oppose, 3 percent neutral.
* Taxes: 70 positions, 35 unique chambers, 60 percent support, 34 percent oppose, 6 percent neutral.
* Taxes excluding San Francisco and L A: 54 positions, 33 unique chambers, 72 percent support, 22 percent oppose, 6 percent neutral.
* Business taxes: 10 positions, 4 unique chambers, 0 percent support, 80 percent oppose, 20 percent neutral.
* Parcel taxes: 15 positions, 9 unique chambers, 67 percent support, 27 percent oppose, 7 percent neutral.
* Sales taxes: 36 positions, 27 unique chambers, 75 percent support, 22 percent oppose, 3 percent neutral.
* Transient occupancy (hotel) taxes: 5 positions, 5 unique chambers, 80 percent support, 20 percent oppose, 0 percent neutral.
* Other taxes: 4 positions, 3 unique chambers, 25 percent support, 75 percent oppose, 0 percent neutral.
In total, 30 of the measures were for issuing bonds, most of them for school or community college districts and some for other types of infrastructure. As I summarize in table 3, the local chambers of commerce supported passage for 93% of these bond measures.
The local chambers also supported tax increases in 60% of the cases, but further breakdown of the 70 chamber positions on tax increases suggests even broader support. Half of the opposing positions came from the San Francisco and Los Angeles Area Chambers of Commerce, where there were several unusual taxes on the local ballots, such as an oil production tax in Los Angeles and a commercial rent tax in San Francisco. As I show in table 3, when I exclude the large number of tax ballot measures in those two cities, the chamber support rate rises to 72%. Moreover, 4 of the 12 remaining oppositional stances were separate chambers opposing a specific countywide sales tax in Los Angeles County—Measure A of 2024, a citizen initiative proposed to fund homelessness services and affordable housing—the only measure of its kind in this dataset, as I discuss later.
In contrast, the many instances of chamber support came from a broad set of chambers on a wide array of tax initiatives. The 26 unique chambers that supported tax increases are in cities ranging from Sacramento and Long Beach to smaller cities like Walnut Creek, Lodi, San Leandro, and Santee. Moreover, although business taxes that made it on to the ballot were broadly opposed by local chambers (none endorsed), local chambers endorsed two-thirds of the parcel tax measures and four out of five hotel taxes. Moreover, of the 36 chamber positions on sales taxes, 27—or 75%—were supported by local chambers of commerce. In line with my findings from the campaign contribution analysis, the picture that emerges is one of local business associations supporting many efforts to increase local taxes.
Discussion
Political science scholarship commonly portrays business as a conservative force in the United States opposed to higher taxes and more government spending. That portrayal, however, is not only debated but also rooted in observations of national politics, and the pattern that emerges at the local level is quite different. Businesses and business associations are politically active in local politics, but in recent years in California, they have also actively supported efforts to increase local taxes. By doing so, they put themselves on the same side as unions (which are also quite politically active), forming a local kind of cross-class alliance.
Naturally, these findings raise many new questions. For some of those questions, I sketch out preliminary answers here in hopes of laying the groundwork for future studies. For others, my hope is that the theory and data I presented inspire new lines of research in both American and comparative politics and that such work will lead to, as Swenson (Reference Swenson2018, 23) writes, “a deeper understanding of the power of capitalists in capitalist societies.”
First, one might think these patterns could be unique to California. I expect not, however, because businesses in other states also benefit from the services that cities provide. Indeed, examples from other states suggest these patterns are not unique. In Seattle, when there was a sales tax increase on the ballot in 2020, businesses contributed roughly one-third of the funds in support (slightly less than the amount contributed by unions). In 2015 in Tacoma, Washington, businesses contributed a majority of the supportive funding for a sales tax increase.Footnote 15 Even in Tulsa, the local chamber of commerce supported a package of city revenue-raising measures called Improve Our Tulsa, including a sales tax (Morgan Reference Morgan2023). Although not dispositive, these examples suggest that the patterns I find here are not strictly a Californian phenomenon.
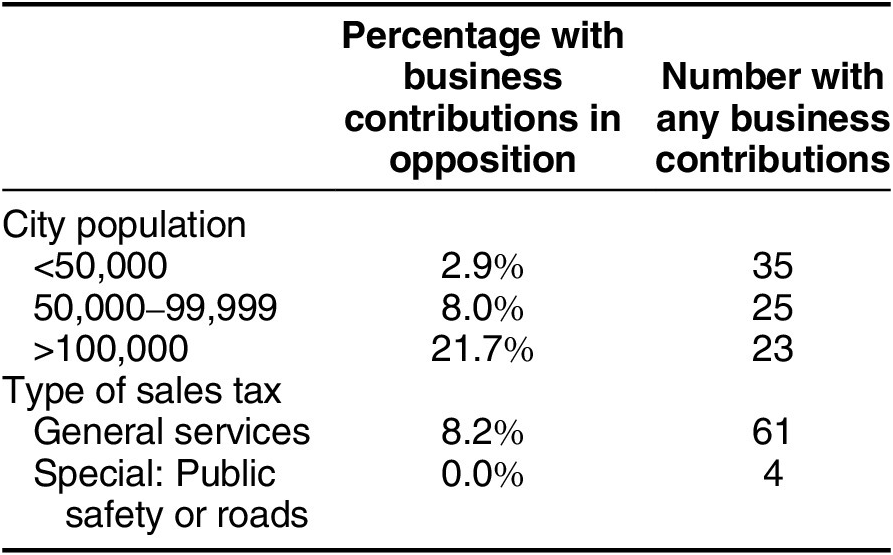
Second, how much of this pattern is due to the smaller scale of local government versus the functions of municipal government and the type of tax? I suspect both play roles, but the limited variation in businesses’ positions—which is perhaps the most striking result here—makes it difficult to evaluate each mechanism separately. The cities in my analysis do vary in population size, and as I show in table 4, business contributions in opposition to tax increases are somewhat more likely in larger cities than smaller cities. Even in the most populous cities, however, business support for tax increases is far more common than opposition. Furthermore, there are no extreme cases of city governments spanning disparate parts of the state that would allow for a better test of whether business support declines when the funding is to be distributed across a large geographic area. In the future, researchers could develop better designs to test this possibility.
Business Opposition to Measure by City Size, Services to Be Funded

Table 4 Long description
The table consists of three columns: Category, Percentage with business contributions in opposition, and Number with any business contributions.
Under the City population category:
* For populations less than 50,000: 2.9 percent opposition with 35 total contributions.
* For populations between 50,000 and 99,999: 8.0 percent opposition with 25 total contributions.
* For populations greater than 100,000: 21.7 percent opposition with 23 total contributions.
Under the Type of sales tax category:
* General services: 8.2 percent opposition with 61 total contributions.
* Special: Public safety or roads: 0.0 percent opposition with 4 total contributions.
I also expect that the particulars of city taxes and services—what type of taxes they are and what they fund—are an important explanation for this pattern of business support for city tax increases. Yet here, too, these data have limitations. The vast majority of these are sales taxes that were passed to fund “general government services.” As noted, California cities propose sales tax increases because it is one of the few levers they have to increase revenue, and they make them general rather than special taxes to take advantage of the lower passage threshold. It could also be, however, that certain proposals are more likely to appear on the ballot because they tend to be the ones that businesses will support. If business is influential in city politics, then city officials might reasonably avoid proposing taxes that businesses would be against—and such measures would then be rare in the CEDA, as well as in my campaign finance data. That, then, could generate the pattern observed here: business supports (and does not oppose) most of the tax increases that make it to the ballot.
The inference to be drawn from these data is therefore not that business nearly always prefers higher taxes, regardless of the rate, type of tax, or services to be funded. To the contrary, chambers appear less supportive of (non-cannabis) business taxes. And the few observed cases of proposed taxes that would fund services less prioritized by business do get opposed. Fresno Measure P is one. Another is LA County’s Measure A, which was more clearly redistributive.
Nonetheless, it is striking to see so many tax ballot measures actively supported by business. Presumably, businesses do not have to make these contributions in support of tax increases. Nor do chambers of commerce have to endorse them.Footnote 16 And although it is true that the data have limited variation, possibly because of these selection issues, they do provide clues as to why businesses are supporting these tax increases: because businesses value the city services they would help fund and are willing to stomach some additional taxes to see them maintained. As I said earlier, it is generally understood that city taxes to fund “general services” would create additional funding for public safety and infrastructure. Table 4 shows that there were 61 “general services” sales tax proposals that saw contributions from business, only 8.2% of which generated business contributions in opposition. Moreover, there were only seven “special” sales tax proposals for which I received contribution records. One was Fresno Measure P, and all six others were to fund public safety or roads. Table 4 shows that four of those public safety and roads measures saw contributions from business and that none of that business money was in opposition. Again, this is merely suggestive, but it hints at the conditions under which business will and will not support local tax increases—and why.
The case of Sacramento also offers evidence for some of these political dynamics. When city officials in 2012 proposed Measure U, a general sales tax increase, the Sacramento News & Review reported,
Business owners and the Sacramento Metro Chamber … remind that city council couldn’t resolve its budget’s structural imbalance even when it had healthy coffers, pre-2008, so why should it be entrusted with millions now, especially during a struggling economy?… The Downtown Sacramento Partnership and the Midtown Business Association are stuck in the middle of this tug-of-war. Neither group intends to take a stand on Measure U and their members are split. Businesspeople don’t want to pass a sales-tax increase onto their customers. Nor do they want to see fewer cops or dirty streets. (Miller Reference Miller2012; emphasis added)
That measure passed, but six years later, the tax was set to expire, and the city council put a new, larger tax on the ballot to replace it. A great deal of business money opposed that 2018 measure (see figure 4). This time, however, the Sacramento Metro Chamber endorsed the (larger) tax increase. Amanda Blackwood, CEO and president of the Metro Chamber, explained why: “With the current challenges that our business community is facing, we cannot afford the loss of essential city services including fire, police and parks.…We believe it is vital to support Measure U and ensure its funding is continued” (Sacramento Metro Chamber 2018).
This example shows that business support for city tax increases is not guaranteed and suggests that an important reason why businesses sometimes do support tax increases is their reliance on city services. It also highlights other promising areas for future research, including the potential role of budget deficits and possible differences between businesses acting as individual entities versus collectively through their local associations. This should also put the spotlight on local and state chambers of commerce as entities worthy of further research. Many of them predate the US Chamber of Commerce, and many are not members of it. Although I focused here on California local chambers’ positions on local taxes, future research should examine state and local chambers’ positions on other issues, such as housing development, infrastructure, public safety, and public education.
The theory and empirical findings here also suggest productive new directions for the American politics literature, especially work on subnational government. There has been a surge in state and local politics research in the last decade, much of it examining the roles of partisanship, ideology, and nationalization (e.g., Caughey and Warshaw Reference Caughey and Warshaw2022; de Benedictis-Kessner and Warshaw Reference De Benedictis-Kessner and Warshaw2016; Grumbach Reference Grumbach2022; Rogers Reference Rogers2023). The burgeoning American political economy literature also emphasizes the importance of American localism and federalism, and it stresses that partisanship and class are some of the dominant political divisions of modern American politics (e.g., Hacker et al. Reference Hacker, Hertel-Fernandez, Pierson, Thelen, Hacker, Hertel-Fernandez, Pierson and Thelen2022). My argument and findings suggest that politics can work differently in local government than at the federal or even state level—and that partisanship and class are not always the main political dividing lines. Because of the kinds of policies cities make, the interests of business and unions can align, and cross-class alliances are possible or even common (Anzia Reference Anzia2022; Swenson Reference Swenson2002; Reference Swenson2018; Yandle Reference Yandle1983). Moreover, the interesting coalition patterns found here suggest that local tax politics is an area ripe for future research.
These findings also raise questions about how political institutions might affect the nature of business engagement and support for government. For example, is business comparatively more supportive of government at the local level than at the national or state levels in the United States? If so, does the same hold in other countries, or is there something about the US political structure that causes this? Could it be that business support for local government lessens its support for national government or is perhaps related to the degree of local government fiscal autonomy? In the comparative political economy literature, for example, scholars show that the United States scores highly on various measures of fiscal decentralization, such as own-source state and local revenue as a share of total government revenue and local government autonomy over their tax rates and base (Reschovsky Reference Reschovsky2019; Rodden Reference Rodden2004). Going forward, scholars should examine this kind of variation and assess whether it helps explain variation in business stances on public policy, including taxes and social spending.
Clearly, there is much to be explored, and this essay raises more questions than answers. However, the preliminary theory and data analysis provided here can help us ask and answer those questions. Businesses and business associations are highly active in politics at all levels of American government. There is also the widespread understanding that business can be quite influential politically. We should therefore continue to ask: influential on what, to what ends, and under what conditions? Developing a better understanding of the conditions under which this occurs is of the utmost importance, especially in this moment of great change and uncertainty in American democracy.
Supplementary material
To view supplementary material for this article, please visit http://doi.org/10.1017/S1537592726105003.
Data replication
Data replication sets are available in Harvard Dataverse at: https://doi.org/10.7910/DVN/AMFTSC.
Acknowledgments
Thank you to Jack Maegden, Anna Weissman, Molly Cram, Ignacia Salas, Emma-Jane Burns, Riley Cooke, Ainslie Coughran, and Erin Lopez for excellent research assistance. Many thanks also to Rod Kiewiet and seminar participants at the University of California, Berkeley; New York University; Vanderbilt University; the Hoover Institution; and the University of Chicago for helpful comments, and to the California city clerks who provided documents.



 Open access

