

Long-distance endurance exercise (e.g. half-marathon and full-distance marathon) demands high levels of energy, and carbohydrate (CHO) is one of the chief energy sources drawn upon during exercise. The beneficial effect of pre-exercise CHO ingestion on endurance exercise performance is well established( Reference Correia-Oliveira, Bertuzzi and Kiss 1 , Reference Vandenbogaerde and Hopkins 2 ). In addition, the co-ingestion of protein (PRO) and CHO has been extensively investigated in relation to post-exercise recovery period( Reference Ivy, Goforth and Damon 3 – Reference Koopman, Pannemans and Jeukendrup 5 ). To date, relatively little research has been conducted on the performance efficacy of the co-ingestion of PRO and CHO before exercise. In theory, the combined ingestion of CHO and PRO increases insulin levels more effectively than the ingestion of CHO alone, which may also enhance glucose disposal( Reference Manders, Wagenmakers and Koopman 6 ). Therefore, it may be beneficial for sparing glycogen and suppressing the fat oxidation during the early phase of exercise( Reference Morifuji, Kanda and Koga 7 , Reference Coyle, Jeukendrup and Wagenmakers 8 ). Studies( Reference Saunders, Kane and Todd 9 – Reference Van Essen and Gibala 12 ) have reported inconsistent findings; however, a recent meta-analysis revealed that the addition of PRO in CHO solution improved exercise performance by 10·5 % when compared with the original CHO solutions. The findings also suggested a 3·4 % improvement in performance when PRO replaced a portion of CHO, whereas energy was matched between two trials( Reference Stearns, Emmanuel and Volek 13 ). It should be noted that the included studies in this meta-analysis have a high heterogeneity in study protocol, participants and nutritional strategy. Therefore, the results should be explained cautiously. However, it seems that co-ingestion of CHO and PRO may benefit the exercise performance when being consumed before endurance exercise.
α-Lactalbumin is a PRO derived from whey PRO. Compared with whey PRO, α-lactalbumin is rich in tryptophan, which is the only precursor of serotonin. Serotonin is a neurotransmitter in the central nervous system (CNS) with the biological function in the regulation of some essential life behaviour. Serotonin synthesis enhancement in the dorsal horn of the spinal cord and the hypothalamus is essentially a response for reducing pain( Reference Jacobs, Martı́n-Cora and Fornal 14 ). In most of the situations, physical exercise is not only terminated by energy substrate exhaustion but also by muscle exertion, especially muscle pain, which is a progressive discomfort relating to the inability to overcome the outflow of sensory information( Reference Noakes, Gibson and Lambert 15 ). A previous study( Reference Javierre, Segura and Ventura 16 ) reported that, compared with placebo control, tryptophan supplementation before exercise improved peak power output, as well as distance covered in the last 20 min of a self-selected speed time-trial (TT) test. α-Lactalbumin not only provides a more comprehensive amino acid profile compared with ingestion of pure tryptophan, but also prevents the possible side effects of pure tryptophan ingestion( Reference Kilbourne, Philen and Kamb 17 , Reference Porter, Gallagher and Watson 18 ). Therefore, public attention regarding the use of α-lactalbumin for endurance exercise should be increased.
In our previous study( Reference Qin, Wong and Sun 19 ), compared with a placebo, ingestion of α-lactalbumin significantly resulted in lower muscle pain and greater affective enhancement at 90 min of prolonged running exercise at constant individual intensity (70 % V̇O2max). In another study( Reference Qin, Wong and Sun 20 ), participants ingested α-lactalbumin and whey PRO within 2 h after 90 min of running. Compared with the results after ingestion of whey PRO, an elevation of pressure pain threshold (PPT) occurred at 2 h after the ingestion of α-lactalbumin. This change was associated with a relatively rapid recovery of fatigue. Thus far, few studies have investigated the effect of α-lactalbumin ingestion before exercise with regard to individuals’ TT performance, muscle damage and mood states. Therefore, this study was conducted to address the related research questions. The absorption of PRO can occur gradually through the gastrointestinal system, and the amino acids would appear in the blood stream in 15 min and peak at 75–120 min after ingestion. Accordingly, a hypothesis was established that ingestion of α-lactalbumin 2 h before exercise improves subsequent exercise performance, compared with the ingestion of whey PRO.
Methods
Ethics statement
All procedures in this study were performed in accordance with the Declaration of Helsinki and were approved by the Ethics Committee of the Chinese University of Hong Kong. The procedures and potential risks of the study were fully explained to the participants. During the briefing session, the participants were allowed to freely raise questions related to the study. All participants signed the informed consent forms after the briefing session.
Participants and experiment control
A total of thirteen participants were recruited initially. However, two participants dropped out during the trial period because of schedule conflicts. Finally, eleven healthy participants (age: 31 (se 3) year, height: 169·5 (se 4·4) cm, weight: 63·6 (se 5·1) kg, V̇O2max: 58·8 (se 6·3) ml/kg per min) eventually completed four separate tests, namely V̇O2max test, familiarisation test and two main trials separated by a wash-out period of 7–21 d. Participants were required to refrain from strenuous exercise, as well as caffeine and alcohol consumption, for 48 h before each day of participation in the experiment. In addition, participants observed an overnight fasting state of 10–12 h before the main trial days; in particular, after 20.00 hours on the day preceding a trial day, participants were only allowed to consume water.
Experimental protocol
Main trials and drinking protocol
For each main trial, one participant reported to the same experimental site between 07.00 and 07.30 hours. Approximately half an hour was arranged for the participants to change into their sports gear, and use the bathroom to empty their bladder and colon. The participants then returned to the lab and sat quietly for 2 h. During the 2-h pre-exercise rest, the prescribed drinks (carbohydrate+α-lactalbumin (CA), carbohydrate+whey protein isolated (CW)) for the two main trials were arranged in a double-blinded cross-over design. In the double-blinded arrangement, the drinks were marked as drink 1 or 2 by a research assistant. A drink was then randomly selected during the first trial; the remaining drink was applied in the next trial. The two types of PRO powders were purchased from the same manufacturer (Davisco®). CHO and PRO were served at 0·66 and 0·34 g/kg per h, respectively. CHO was served as a 6·6 % (w/v) solution (Pocari®; Otsuka Pharmaceutical Co. Ltd). PRO powder was dissolved in the CHO solution for each serving. The total amount of solution and PRO powder was divided equally and ingested every 30 min during the 2 h before exercise. For instance, a participant with a body weight (BW) of 75 kg would consume a total of 1500 ml of CHO solution and 51 g of PRO powder before exercise. At every 30 min, 300 ml of solution with 10·2 g of PRO powder would be served. In the study, after ingesting all assigned drinks, each participant ran on a treadmill at a self-selected speed for 21 km. While running, participants were blinded to the running speed, heart rate and elapsed time. They were required to run as fast as they could to complete the trial. Participants were also served pure water at 2·5 ml/kg BW at intervals of 8 and 16 km while they were running. The collection of BW data (MC-780U; TANITA®) and capillary blood and saliva samples, as well as the evaluation of perceptual responses (abdominal discomfort (AD), thirst, muscle pain, perceived exertion, mood states and PPT), was conducted 2 h before exercise (Pre-ex2h), immediately before exercise (Pre-ex0) and immediately after exercise (Post-ex0). Standardised meals (energy: 75·4 (se 2·1) kJ/kg; 57 % CHO, 15 % PRO, 28 % fat) were provided for the remainder of the main trial day. Other than the standardised food, only water consumption was allowed before the evaluation on the next day. In the morning after the experimental day (Post-ex24h), each participant returned to the lab for a single set of capillary blood sampling, muscle pain scale evaluation and PPT assessment.
Blood and salivary cortisol measurement
Participants submerged their hands in warm water for approximately 1 min. After the hand was dried with a clean swab, the sampling fingertip was sterilised and a capillary blood sample was withdrawn. For each sampling, 1 ml of capillary blood was obtained using two 600-μl K+-EDTA anti-clotting multivettes (Multivettes® 600K3E; Sarstedt AG & Co.). The blood samples were centrifuged (Primo™ R, Biofuge®; Heraeus Ltd.) for 10 min at 3500 rpm and 4°C. Plasma samples were collected and deposited into Eppendorf tubes to avoid repeat freezing and thawing. The samples were then stored at –80°C in an ultra-low-temperature freezer (Model MDFU52V, Sanyo™; Sanyo Electric Co. Ltd). Blood glucose (BG), lactic acid (LA), creatine kinase (CK), plasma IL-6, Hb and salivary cortisol were collected and measured using the methods described in our previous study( Reference Qin, Wong and Sun 20 ).
Pressure pain threshold
PPT was manually determined according to a previously described method( Reference Astokorki and Mauger 21 ). In brief, participants relaxed their legs in a supine resting position. A round metal probe was placed on the middle part of the rectus femoris. The force was increased by 3 N/cm2 per s until the participant signalled that they felt a weak pain.
Perception responses and mood states evaluation
Muscle pain, AD, thirst and perceived exertion were evaluated using rating scales that we applied in our previous studies( Reference Qin, Wong and Sun 20 , Reference Li, Wong and Sun 22 ). Mood states were measured using the Chinese version of Brunel Mood Scale (BRUMS-C)( Reference Zhang, Si and Chung 23 ). Briefly, the BRUMS-C encompasses six dimensions: anger, confusion, fatigue, tension, depression and vigour. In the present study, the range of each mood dimension was determined according to the raw score of each dimension, as well as the total mood disturbance (TMD), calculated as the sum of the scores of negative dimensions (anger, confusion, tension, depression and fatigue) with the positive dimension (vigour) score substracted.
Statistical analysis
All continuous data were analysed using IBM SPSS (version 20.0) and presented as means with their standard errors. Cross-over data for repeated measures were analysed using two-way repeated measures ANOVA. Treatment (CA, CW) and time (Pre-ex2h, Pre-ex0, Post-ex0 and Post-ex24h) were considered within-subject factors, and trial order (the sequence in which the participant received the treatments) was considered a between-subject factor. Simple effect analysis with a Bonferroni post hoc test was applied to determine the difference among treatment or time. The sample size was calculated and validated using G*Power (version 3.1.9). The type of study design was chosen as F test ANOVA repeat measures, within factors. The intraclass correlation was 0·80 between repeat measures. The effect size was estimated as 0·25 based on previous studies( Reference Coull, Chrismas and Watson 24 – Reference Gui, Sun and Si 26 ) with similar primary outcomes as those of the present study (in TT performance and mood states). The statistical power was determined as 80 %, and the two-sided significance level was 0·05. The minimum sample size for each trial was eight participants.
Results
Exercise performance
Completion time of the 21-km run was slightly less in the CA trial than in the CW trial; however, no significant difference was observed between both trials (CA v. CW: 115·85 (se 5·20) v. 118·85 (se 5·51) min, P=0·48).
Creatine kinase and IL-6
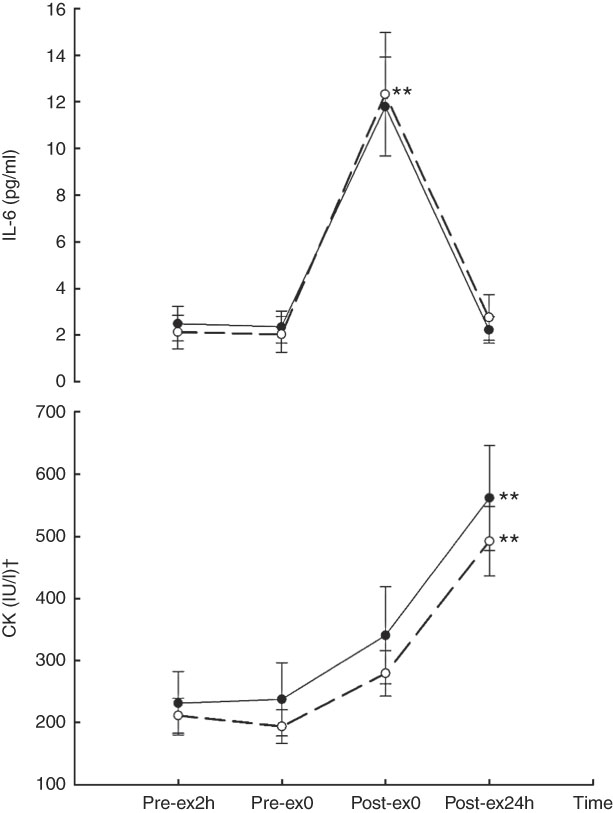
A main effect of time was found with CK (F 9,27=28·62, P<0·01) and IL-6 (F 9,27=27·446, P<0·01). Compared with Pre-ex2h, CK levels increased at Post-ex24h following both CA (9·37 (se 1·40) v. 3·86 (se 0·84) µkat/l, P<0·01) and CW (8·21 (se 0·93) v. 3·53 (se 0·46) µkat/l, P<0·01). Compared with Pre-ex2h, IL-6 was higher at Post-ex0 in both CA (11·80 (se 2·12) v. 2·49 (se 0·74), P<0·01) and CW (12·33 (se 2·64) v. 2·14 (se 0·72), P<0·01) treatments. No treatment effect or treatment×time interaction effect (F 3,27=0·688, P=0·567) was observed for CK (treatment: F 1,9=0·568, P=0·470; treatment×time: F 3,27=0·688, P=0·567) or IL-6 (treatment: F 1,9=0·339, P=0·575; treatment×time: F 3,27=0·855, P=0·476) (Fig. 1).
Creatine kinase (CK) and IL-6 concentration in two main trials. ** v. 2 h before exercise (Pre-ex2h, P<0·01).
![]() , carbohydrate+α-lactalbumin;
, carbohydrate+α-lactalbumin;
![]() , carbohydrate+whey protein; Pre-ex0, immediately before exercise; Post-ex0, immediately after exercise; Post-ex24h, after the experimental day. † To convert CK in IU to µkat, multiply by 0·0167.
, carbohydrate+whey protein; Pre-ex0, immediately before exercise; Post-ex0, immediately after exercise; Post-ex24h, after the experimental day. † To convert CK in IU to µkat, multiply by 0·0167.
Salivary cortisol
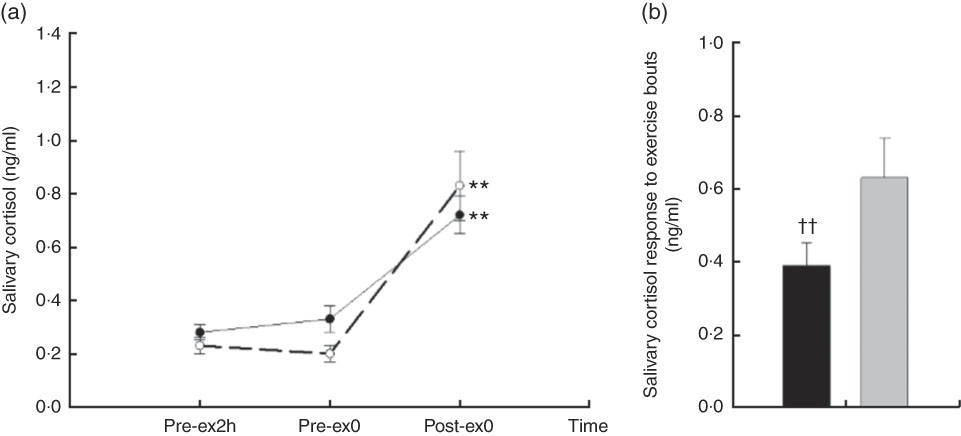
A main effect of time (F 2,18=25·88, P<0·01) and an interaction effect of treatment×time (F 3,27=5·29, P=0·016) were found on salivary cortisol. No difference was observed between the basal reference values at Pre-ex2h (P=0·174); however, there was a marginal difference in Pre-ex0 (P=0·068). Compared with Pre-ex2h and Pre-ex0, the salivary cortisol was higher at Post-ex0 in CW and CA (all P<0·01) (Fig. 2 (a)). To eliminate the potential difference in Pre-ex0 and, more importantly, to compare the cortisol response following two exercise trials, we compared the change of cortisol by subtracting the values in Post-ex0 with that in Pre-ex0. Compared with CW, the change of salivary cortisol in Post-ex0 was lower in CA (0·39 (se 0·06) v. 0·63 (se 0·11) ng/ml, P<0·01) (Fig. 2(b)).
Salivary cortisol responses in two main trials; (a) salivary cortisol concentration in different time points; (b) the change of salivary cortisol following exercise bouts (immediately after exercise (Post-ex0) minus immediately before exercise (Pre-ex0)). (a) ** v. 2 h before exercise (Pre-ex2h) and Pre-ex0 (P<0·01). CA (
![]() ), Carbohydrate+α-lactalbumin; CW (
), Carbohydrate+α-lactalbumin; CW (
![]() ), carbohydrate+whey protein isolated. (b) †† v. CW (
), carbohydrate+whey protein isolated. (b) †† v. CW (
![]() , P<0·01).
, P<0·01).
![]() , CA.
, CA.
Blood glucose and lactic acid
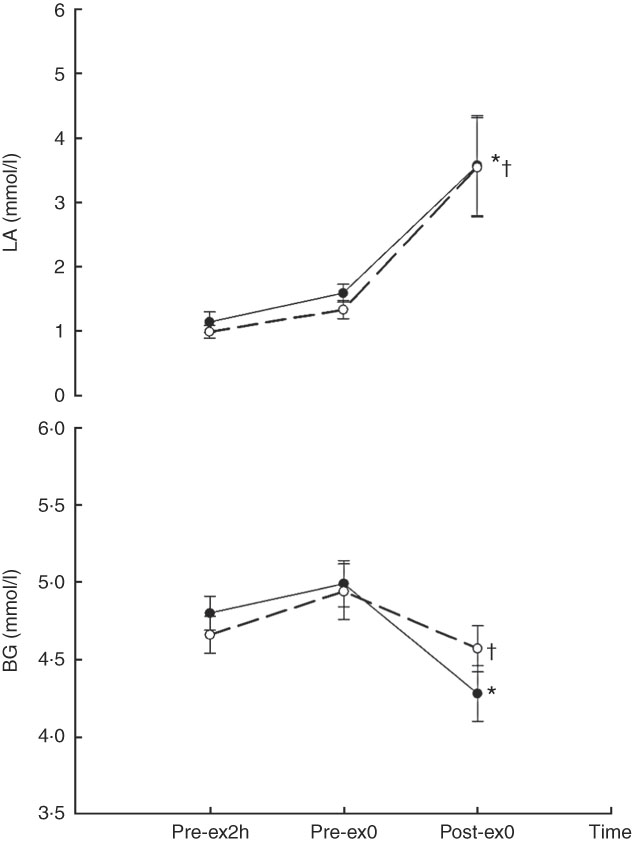
A main effect of time was observed for both BG (F 2,18=8·981, P<0·01) and LA (F 2,18=12·49, P<0·01). Compared with that at Pre-ex2h, BG was lower at Post-ex0 for both CA (4·28 (se 0·18) v. 4·80 (se 0·11), P=0·034) and CW (4·57 (se 0·15) v. 4·66 (se 0·12), P=0·037). Compared with that at Pre-ex2h, LA was higher at Post-ex0 in both of CA (3·57 (se 0·78) v. 1·14 (se 0·16) mmol/l, P=0·014) and CW (3·54 (se 0·77) v. 0·99 (se 0·10) mmol/l, P=0·014). Neither main effect of treatment nor interaction effect of treatment×time was observed for BG (treatment effect: F 1,9=0·011, P=0·092; treatment×time: F 2,18=2·562, P=0·105) and LA (treatment effect: F 1,9=1·577, P=0·241; treatment×time: F 2,18=0·176, P=0·840) (Fig. 3).
Blood glucose (BG) and lactic acid (LA) concentration in two main trials. * v. 2 h before exercise (Pre-ex2h, P=0·034). † v. Pre-ex2h (P=0·037).
![]() , Carbohydrate+α-lactalbumin;
, Carbohydrate+α-lactalbumin;
![]() , carbohydrate+whey protein; Pre-ex0, immediately before exercise; Post-ex0, immediately after exercise.
, carbohydrate+whey protein; Pre-ex0, immediately before exercise; Post-ex0, immediately after exercise.
Body weight and Hb
A main effect of time was found on both BW (F 2,18=172·56, P<0·01) and Hb (F 2,18=6·76, P<0·01). Compared with that at Pre-ex2h, BW was lower at Post-ex0 in both trials of CA (P<0·01) and CW (P<0·01) treatments. Compared with that at Pre-ex2h, Hb concentration was higher in CA (P<0·01) and CW (P<0·01). Neither main effect of treatment nor interaction effect of treatment×time was observed for BW (treatment effect: F 1,9=1·623, P=0·235; treatment×time: F 2,18=1·409, P=0·135) and Hb (treatment effect: F 1,9=0·126, P=0·731; treatment×time: F 2,18=1·657, P=0·219) (Table 1).
Body weight (BW) and Hb concentration in both trials (Mean values with their standard errors)

Pre-ex2h, 2 h before exercise; Pre-ex0, immediately before exercise; Post-ex0, immediately after exercise; CA, carbohydrate+α-lactalbumin; CW, carbohydrate+whey protein.
** v. Pre-ex2h (P<0·01).
Pressure pain threshold
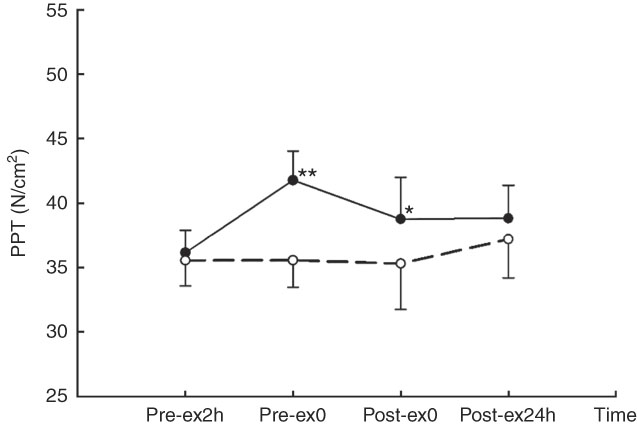
A main effect of treatment (F 1,9=13·92, P<0·01) and interaction effect of treatment×time was observed for PPT (F 3,27=6·604, P<0·01). Compared with that for CW treatment, PPT was higher at Pre-ex0 (41·77 (se 2·27) v. 35·56 (se 2·10) N/cm2, P<0·01) and Post-ex0 (38·76 (se 3·23) v. 35·30 (se 3·55) N/cm2, P=0·047) in CA (Fig. 4).
Pressure pain threshold (PPT) in two main trials. * v. carbohydrate+whey protein isolated (CW (
![]() ), P=0·047). ** v. CW (P<0·01).
), P=0·047). ** v. CW (P<0·01).
![]() , Carbohydrate+α-lactalbumin; Pre-ex2h, 2h before exercise; Pre-ex0, immediately before exercise; Post-ex0, immediately after exercise; Post-ex24h, after the experimental day.
, Carbohydrate+α-lactalbumin; Pre-ex2h, 2h before exercise; Pre-ex0, immediately before exercise; Post-ex0, immediately after exercise; Post-ex24h, after the experimental day.
Muscle pain, abdominal discomfort and thirst
Main effects of time were observed for muscle pain (F 3,27=21·16, P<0·01), AD (F 2,18=5·493, P=0·014) and thirst (F 2,18=24·677, P<0·01). Compared with that at Pre-ex2h, rating of muscle pain was higher at Post-ex0 (P<0·01) in both trials. Compared with that at Pre-ex0, AD and thirst were higher at Post-ex0 (P<0·01). Neither a main effect of treatment nor interaction effect of treatment×time was found on muscle pain (treatment effect: F 1,9=0·15, P=0·707; treatment×time: F 3,27=1·486, P=0·241), AD (treatment effect: F 1,9=1·196, P=0·303; treatment×time: F 2,18=2·585, P=0·103) or thirst (treatment effect: F 1,9=0·980, P=0·348; treatment×time: F 2,18=2·511, P=0·109) (Table 2).
Muscle pain, abdominal discomfort (AD) and thirst in both trials (Mean values with their standard errors)
Pre-ex2h, 2 h before exercise; Pre-ex0, immediately before exercise; Post-ex0, immediately after exercise; Post-ex24h, after the experimental day; CA, carbohydrate+α-lactalbumin; CW, carbohydrate+whey protein; pain, rating of muscle pain; AD, rating of abdominal discomfort; thirst, rating of thirst.
** v. Pre-ex2h (P<0·01).
Mood states
An interaction effect of treatment and time was observed for the feeling of fatigue (F 2,18=7·327, P<0·01). Compared with that in CW trial, feeling of fatigue was lower at Post-ex0 in CA trial (P<0·01). An interaction effect of treatment and time was observed for the feeling of confusion (F 2,18=3·743, P=0·044). Compared with CW, feeling of confusion was lower in CA at Pre-ex2h (P=0·039). A marginal main effect of time was observed for the feeling of fatigue (time: F 2,18=3·405, P=0·056). Additional multivariate test revealed that the time effect was marginal in the CW trial (P=0·073). Compared with Pre-ex0, there was a trend in increasing feeling of fatigue at Post-ex0 in CW (P=0·095). No main effect of time was identified on feelings of anger (time: F 2,18=1·968, P=0·169), confusion (F 2,18=0·771, P=0·477), depression (F 2,18=1·312, P=0·294), tension (F 2,18=1·587, P=0·232), vigour (F 2,18=0·213, P=0·810) and TMD (F 2,18=1·586, P=0·232). A marginal treatment effect was observed for the feeling of confusion (F 1,9=4·11, P=0·073). No main effect of treatment was observed for the feeling of anger (F 1,9=0·371, P=0·558), depression (F 1,9=0·096, P=0·763), fatigue(F 1,9=0·254, P=0·627), tension (F 1,9=0·103, P=0·755), vigour (F 1,9=1·768, P=0·216) and TMD (F 1,9=2·222, P=0·170) (Table 3).
Mood states in both trials (Mean values with their standard errors)

Pre-ex2h, 2h before exercise; Pre-ex0, immediately before exercise; Post-ex0, immediately after exercise; CA, CHO+α-lactalbumin; CW=CHO+Whey PRO; TMD, total mood disturbance.
* v. CW (P=0·039).
** v. CW (P<0·01).
† v. Pre-ex0 (P=0·044).
Discussion
The main findings of this study are summarised as follows: (1) A 21-km run following CA and CW ingestion increased CK and IL-6 levels; (2) no significant difference was observed between the 21-km TT performance for CA and CW treatments; (3) compared with that in CW, PPT was higher at Pre-ex0 and Post-ex0 in the CA trial; (4) compared with that in CW, the change of cortisol concentration was lower following the exercise bout in the CA trial; and (5) compared with that in the CW trial, feeling of fatigue was lower at Post-ex0 in the CA trial.
Time to exhaustion (TTE) and TT are widely applied in evaluations of endurance exercise performance( Reference Temesi, Johnson and Raymond 27 ). TTE is measured at a pre-determined exercise intensity, speed or power output. TT is evaluated by either the time to complete a pre-determined distance or the amount of work or distance completed within a predetermined time. Compared with that of TTE, the CV of TT is lower. In addition, TT is more relevant to situations of real-world competition. In two of our previous studies, an exercise protocol of 90 min running was used. This time duration is closer to the time required for trained runners to run 21 km. Therefore, a 21-km TT test was adopted in the present study to mimic a half-marathon race. The results suggested that CA and CW had similar effects on 21-km TT performance, contradicting our initial hypothesis that ingestion of α-lactalbumin enhances exercise performance. However, this initial hypothesis was based on the potential beneficial effect of α-lactalbumin to attenuate the muscle pain and enhance the mood states. The optimal mood for exercise performance can vary by individual and should be considered( Reference Lane and Terry 28 ), and it is also possible that this potential benefit may be more significant in more strenuous exercise such as full-distance marathon running.
PRO ingestion before exercise provides an abundant pool of amino acids during the exercise. Because amino acids, particularly the branched-chain amino acids, in whey PRO are important for energy substrate metabolism and muscle PRO synthesis, the increased availability of amino acids in the bloodstream may improve the substrate utilisation and attenuate muscle damage following exercise. Studies have demonstrated that improvements in exercise performance are associated with a reduction in the biomarkers of muscle damage (e.g. CK) and muscle pain/soreness( Reference Saunders, Kane and Todd 9 , Reference Saunders, Luden and Herrick 10 , Reference Millard-Stafford, Warren and Thomas 29 ). This suggested that the enhancement of exercise performance following the PRO ingestion was partly due to the reduction of muscle damage and muscle pain. In the present study, prescribed treatments (CA and CW) were served 2 h before the exercise. The amounts of CHO and PRO were identical; only the types of PRO differed between the two treatments. Similar BG responses (Fig. 3) suggested similar CHO availability in both trials. No difference between CA and CW trials was identified with regard to CK or IL-6 (Fig. 1). This result suggested that CA and CW exhibited similar effects on muscle damage when ingested before exercise.
Strenuous prolonged exercise induces an increase in metabolic and mechanical stress on the peripheral muscle. Increased production of ATP results in the activation the P2X purinoceptors, which subsequently enhances the excitability of the sensory neurons. In addition, both increasing metabolism and the muscle ischaemia induced by mechanical stress induces increasing metabolite concentration of LA, which can result in the elevation of the Na+ channel current in sensory responses. Moreover, the receptors of the transient receptor potential vanilloid type 1 and acid-sensing ion channel can be also up-regulated in sensory neurons( Reference Li and Xing 30 ). All those aforementioned responses cause the excitation of nociceptive afferents and predisposition to accelerating muscle pain. Thus, in the present study, the rating score of muscle pain increased following exercise in both trials (Table 2). In both situations before exercise (Pre-ex2h, Pre-ex0) and after exercise (Post-ex0), participants received no mechanical stimulus from exercise bout. The PPT assessment was applied as an external mechanical stimulation. At Pre-ex0 and Post-ex0, PPT was higher in the CA trial than that in the CW trial (Fig. 4). This indicated lower pain sensitivity after the ingestion of CA than after that of CW. Compared with whey PRO, α-lactalbumin possesses similar amounts of other large neutral amino acids (LNAA) in addition to high tryptophan content. The higher amount of tryptophan may enter either the muscle tissue or the CNS. The lower pain sensitivity may be attributed to the greater amount of amino acids available for muscle PRO synthesis. In this study, considering the mood states evaluation, invasive muscle biopsy was not conducted to avoid extra emotional stimulus. Histological characteristics and PRO expression levels in muscles therefore could not be observed. By contrast, total tryptophan:LNAA ratio in plasma may have increased following the ingestion of α-lactalbumin. Serotonin synthesis in the hypothalamus is positively associated with total tryptophan concentration( Reference Bloxam, Tricklebank and Patel 31 ); thus, the serotonin availability in the CNS, including the hypothalamus, may have increased following CA ingestion. Increased serotonin availability in the hypothalamus reduces the transmission of pain( Reference Kupers, Frokjaer and Erritzoe 32 ). The result presented herein is partly consistent with that of the aforementioned exercise performance study( Reference Javierre, Segura and Ventura 16 ).
Regarding the stress situation, cortisol is considered as an indicator of distressful affect. A previous study( Reference Markus, Olivier and Panhuysen 33 ) found that the ingestion of α-lactalbumin induced the enhancement of mood states and reduced the cortisol responses in stress-vulnerable subjects following experimental inducement of stress by noise. In addition, we have previously demonstrated that the ingestion of α-lactalbumin reduced cortisol and the feeling of the fatigue to a greater extent than did ingestion of CW during the 4-h post-exercise recovery( Reference Qin, Wong and Sun 20 ). In the present study, cortisol concentration increased in both trials following exercise, and there was an interaction effect of treatment×time (Fig. 2(a)). The change of cortisol concentration was higher in CW than CA at the end of exercise (Fig. 2(b)), which is consistent with the cortisol responses in other stress stimulations. It should be noted that the cortisol level seemed to be higher in CA than CW following 2-h pre-exercise rest (Pre-ex0), which was unusual in the experiment because participants were neither directly under exercise stimulation nor the after-effects of the exercise. As mentioned above, α-lactalbumin possesses higher tryptophan than whey, and therefore induces higher serotonin availability in CNS. In resting status without stimulation, increasing the amount of serotonin stimulates the production of corticotrophin-releasing factor in the hypothalamus, as well as adrenocorticotrophin in the anterior pituitary gland. The function of the hypothalamic–pituitary–adrenal (HPA) axis is therefore enhanced and induces the increased secretion of cortisol( Reference Axelrod and Reisine 34 , Reference Dinan 35 ). However, this speculation has to be further investigated before drawing any conclusion. Under the stimulation of prolonged strenuous exercise, the function of HPA axis was thoroughly activated. The activation effect of serotonin on the HPA axis results in an increase in the negative feedback of cortisol to HPA, dampening the sympathetic stress responses. In addition, PPT was higher at Post-ex0 in CA than CW. The attenuation of increasing fatigue following exercise tended to be greater in CA than CW, as reflected in a marginal time effect in the CW trial but not in the CA trial.
In summary, the pre-exercise ingestion of α-lactalbumin did not improve the 21-km TT performance. However, the pre-exercise ingestion of α-lactalbumin was superior to the pre-exercise ingestion of whey PRO in elevating PPT, and corresponded with lower feeling of fatigue and cortisol response following similar endurance exercise of similar duration.
Acknowledgements
The authors show their grateful appreciation to the participants’ diligent commitment in this study. Mr Chi Wai Lau offered his valued expertise in the laboratory practice.
This study was supported by Lee Hysan Foundation Research Grant Scheme and the supportive funding from the Department of Sports Science and Physical Education in the Chinese University of Hong Kong.
L. Q. and F.-H. S. were responsible for designing the study, conducting data analysis, interpreting the results, preparing for the submission and revising the manuscript. Y. H. offered his human physiology expertise and organised the biological sample evaluation. S. S. offered contributions in manuscript preparation and English proofreading. C. H.-P. S. provided her expertise in interpreting the experimental results of psychological measurements. S. H.-S. W. coordinated and supervised the study design, data analysis and manuscript preparation.
The authors declare that there are no conflicts of interest.


