


Numerous studies have supported the idea of a hierarchy in the satiety effect of macronutrients(Reference Paddon-Jones, Westman and Mattes1–Reference Doucet and Tremblay4). Proteins are believed to be the macronutrients with the strongest satiety effect in rats and human subjects(Reference Westerterp-Plantenga3, Reference Bertenshaw, Lluch and Yeomans5–Reference Bertenshaw, Lluch and Yeomans13), followed by carbohydrates and lipids. Indeed, Porrini et al. (Reference Porrini, Santangelo and Crovetti14) showed that in healthy men, energy intake at an ad libitum test meal was lower after the ingestion of a protein preload (omelette containing 53·5 % of energy supplied by proteins) than after the ingestion of a lipid preload (omelette containing 79·3 % of energy supplied by lipids). Moreover, Bertenshaw et al. (Reference Bertenshaw, Lluch and Yeomans5) demonstrated that healthy men were less hungry and had a lower food intake after ingesting a high-protein drink (50 % of proteins and 50 % of carbohydrates) than after ingesting a high-carbohydrate one (97·6 % of carbohydrates and 2·4 % of proteins). However, some studies are not in agreement with this hierarchy of satiety effect of macronutrients(Reference de Graaf, Schreurs and Blauw15–Reference Capaldi, Owens and Privitera18). Indeed, Rolls et al. (Reference Rolls, Kim and McNelis17) showed that a high-carbohydrate yoghourt (81 % of carbohydrates) and a high-fat one did not differentially impact food intake at test meal, and Capaldi et al. (Reference Capaldi, Owens and Privitera18) showed that food intake 40 min after the ingestion of a high-carbohydrate preload was not different from food intake after the ingestion of a high-protein one.
The discrepancies between these findings probably come from many other food properties that may influence appetite sensations and food intake in addition to the macronutrient content, such as energy density, texture and sensory properties, as well as from the knowledge and beliefs regarding the food being tested. Several studies have shown that food with a low energy density would be more satiating than food with a high energy density(Reference Drewnowski19, Reference Poppitt, McCormack and Buffenstein20). In his review, Poppitt et al. (Reference Poppitt, McCormack and Buffenstein20) showed that, independently of their lipid content, foods with a low energy density have a higher satiety effect than those with a high energy density, suggesting that the weight and volume of food consumed were important parameters that are to be taken into account in food behaviour studies. Results regarding the influence of the texture of food are sometimes controversial. Mattes & Rothacker(Reference Mattes and Rothacker21) concluded that a viscous drink leads to a higher decrease of hunger sensations than a low-viscosity isopalatable drink with the same energy density and macronutrient content. Moreover, some studies reported that liquids fail to trigger physiological satiety mechanisms, so that compensation for energy consumed as beverages may be imprecise and incomplete(Reference Mattes22, Reference DiMeglio and Mattes23). However, the evidence that liquids have less impact on satiety than solid foods remains inconclusive. Indeed, Bertenshaw et al. (Reference Bertenshaw, Lluch and Yeomans5) showed that the consumption of a high-protein beverage but not of a high-carbohydrate one was partially compensated, showing that satiety effect of liquid foods also depended on their macronutrient composition, particularly on the protein content.
The time between the ingestion of the preload and the ad libitum test meal also seems to be an important parameter that has to be considered while assessing the energy intake at test meal. In some studies, the test meal is consumed immediately after preload ingestion(Reference Porrini, Santangelo and Crovetti14, Reference Booth, Chase and Campbell24, Reference Booth and Jarman25), after a quite short delay (between 30 min and 2 h)(Reference Bertenshaw, Lluch and Yeomans5, Reference Geliebter16, Reference Capaldi, Owens and Privitera18) or after more than 3 h(Reference Fischer, Colombani and Wenk26, Reference Raben, Agerholm-Larsen and Flint27). A very short delay may involve only oro-sensitive and gastric pre-absorptive signals since the first post-absorptive signals appear about 20 min(Reference Booth and Jarman25) after the start of the meal, while post-absorptive signals would be involved in case of a long delay between the preload and test meal ingestion. Some studies have compared the effects of different delays between the preload and test meal ingestion(Reference Porrini, Santangelo and Crovetti14, Reference Anderson, Tecimer and Shah28). Anderson et al. (Reference Anderson, Tecimer and Shah28) reported that the consumption of a liquid preload containing about 50 g of protein led to a decrease in subsequent energy intake with a delay of 1 h between the preload and test meal ingestion, but this satiety effect of proteins disappeared with a delay of 2 h. Porrini et al. (Reference Porrini, Santangelo and Crovetti14) obtained the same result with solid high-protein preloads served immediately or 2 h before the test meal. Moreover, the time elapsing between the preload and test meal ingestion also seems to be particularly important when solid and liquid preloads are compared. Indeed, Almiron-Roig et al. (Reference Almiron-Roig, Chen and Drewnowski29) reported that studies which demonstrated greater satiating power of solids over liquids generally used a long time delay between the preload and test meal ingestion (between 2 and 4 h). In contrast, studies which showed that liquids are more satiating than solid foods used a very short time delay between the preload and test meal ingestion ( < 30 min). It is apparent that energy compensation following the ingestion of liquid preloads occurs when the interval between ingestion of the preload and test meal is small, whereas the reverse is observed for solid foods(Reference DiMeglio and Mattes23, Reference Rolls, Bell and Thorwart30–Reference Himaya and Louis-Sylvestre33).
In the literature, just a few studies really focus only on the effect of macronutrient composition on satiety. Most studies that explored the effect of macronutrients on satiety and food intake did not use preloads with the same energy content, the same energy density and the same level of palatability. The objective of the present study was therefore to measure the effects of proteins, carbohydrates and lipids on food intake and appetite scores using disguised preloads containing only one of the three macronutrients, but with the same volume, energy content, energy density, viscosity and palatability.
Subjects and methods
This study was done at the Laboratory of Sensory Perception and Sensometry of AgroParisTech (Massy, France). This study was conducted according to the guidelines laid down in the Declaration of Helsinki, and all procedures involving human subjects were approved by the Comité de Protection des Personnes Ile de France X (Aulnay-sous-Bois, France). Written informed consent was obtained from all the subjects.
Subjects
Sixty volunteers were recruited by means of posters and messages sent to electronic mailing lists. All the subjects were healthy non-smokers, aged from 18 to 60 years, with a BMI ranging from 18 to 25 kg/m2. They did not display any food allergies or dislikes regarding the foods proposed for the test meals and preloads, and were not taking any medication known to affect appetite. Moreover, we only recruited volunteers who, in response to a general food habits questionnaire, stated that they were used to eating three regular meals per day. Pregnant or breast-feeding women, athletes in training, people with a score >10 on the restraint subscale of the Three-Factor Eating Questionnaire(Reference Stunkard and Messick34) and those suffering from hypercholesterolaemia or diabetes were excluded from the study (information solicited by means of questionnaires and interview with experimenters). The subjects received financial compensation for their participation, and the true nature of the study was revealed to them during a debriefing session once it had been completed. Of the sixty subjects recruited, four did not complete the protocol (preloads not entirely consumed and problems of compliance with the schedules). As a consequence, the final sample consisted of twelve men and forty-four women with a mean BMI of 21·0 (sem 1·7) kg/m2, and a mean age of 31·2 (sem 12·2) years. The debriefing discussion revealed that the volunteers had not realised that food consumption and the effects of a preload on appetite were the focus of the study.
Menus and foods
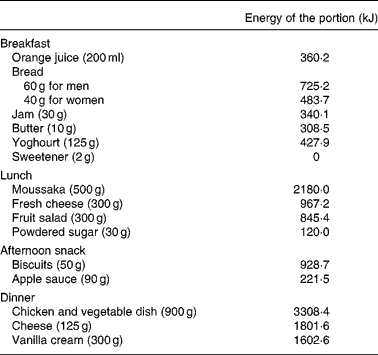
All the foods were widely available, industrial products. Before the study was started, we ensured that volunteers liked the different foods proposed in order to reduce lassitude and dislikes. The subjects were provided with a wide variety of the foods that make up a typical French breakfast, plus biscuits and an apple sauce portion for an optional afternoon snack, and a full menu for dinner. The breakfast, afternoon snack and dinner were supplied in ready-packed containers which the volunteers ate freely at home. The subjects were required to consume the breakfast provided for each test day in full, so that they would arrive at the laboratory in the same state of appetite. Compliance was determined by asking the subjects to return the empty containers. The energy content of the breakfast was adapted to the sex of the volunteers: 2161·9 kJ for men and 1920·4 kJ for women. Lunch was served at the laboratory in private cubicles, and comprised a full menu with a main course and dessert. All foods (Table 1) were served in generous portions that were weighed before being served and then reweighed after the subjects had eaten, so as to obtain the net amount consumed of each food. The subjects were asked to return any uneaten foods from their packed meals on the day after each test day.
Energy content of foods served to the subjects
Preloads
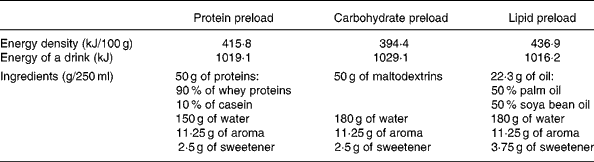
The three preloads used in this study were hot chocolate drinks of 250 ml containing either proteins only, carbohydrates only or lipids only (Table 2). The drinks were isoenergetic (about 1025 kJ), were prepared in the laboratory on each test day and were served with a straw in an opaque cup. A pilot study, involving sixty-two volunteers who did not participate in the main study, was conducted to determine whether the palatability of the three preloads was similar. The sixty-two volunteers had to taste 10 ml of each preload and to evaluate its palatability using a questionnaire that proposed nine degrees of pleasantness from ‘extremely unpleasant’ to ‘extremely pleasant’. The scores obtained for protein, carbohydrate and lipid preloads were not statistically different (4·08 (sem 0·21), 4·58 (sem 0·21) and 3·95 (sem 0·23), respectively). The palatability of the three preloads was measured on each test day by the volunteers of the main study too.
Composition and energy content of the three preloads
Design
The volunteers were divided into two groups, defined as a function of the time elapsing between consumption of the preload and lunch: in group T0, there was no delay, but in group T1, a 1 h interval was allowed. The two groups had the same sex balance (six men and twenty-two women), and had similar average BMI (21·1 (sem 1·9) and 21·0 (sem 1·7) kg/m2 in groups T1 and T0, respectively). Within the same group, each volunteer was tested on four randomised days: a control day without a preload, a day with the protein drink, a day with the carbohydrate drink and a day with the lipid drink. The four test days were separated by an interval of 1 week. On each test day, the subjects were instructed to eat all the breakfast provided for them at home between 7.00 and 8.30 hours, and were not allowed to consume any foods or energy-containing beverages until they arrived at the laboratory: at 11.30 hours for the subjects in group T1 and at 12.30 hours for the subjects in group T0. At arrival to the laboratory, each subject was taken to a private cubicle and asked to eat the entire preload within 15 min, except on the control day when s/he was asked to look through magazines devoid of any references to food. For group T0, the ad libitum lunch was served immediately after the volunteers had consumed the preload, while for group T1, lunch was served 1 h later. The subjects were asked to eat this lunch within 45 min. They then left the laboratory having been supplied with food for their afternoon snack and dinner, and were not allowed to consume any energetic beverages for the rest of the day (Fig. 1).
Experimental design of a test day for groups T1 (group of volunteers who ate their lunch 1 h after ingesting the preload) and T0 (group, which consumed the preload immediately before lunch). ↑ , Visual analogue scales.

Visual analogue scales
The subjects were asked to indicate, on a scale from 0 to 100 mm, how they felt at the moment they completed the following questions: How hungry do you feel now? (not hungry at all–extremely hungry); How full do you feel now? (not full at all–extremely full); How strong is your desire to eat now? (very weak–very strong); How much food do you think you could eat now? (nothing at all–a large amount); How nauseous do you feel now? (not nauseous at all–extremely nauseous). These visual analogue scales (VAS) were completed after breakfast, immediately before and after consumption of the preload (or at the corresponding hours during the control day), at 12.00 hours, before and after lunch, at 14·00, 15·00, 17·00, 19.00 hours, and before and after dinner. The palatability of meals (lunch and dinner) was also measured using VAS.
Statistical analyses
Statistical analyses were performed using SAS for Windows (version 9.1; SAS Institute, Inc., Cary, NC, USA). Descriptive data are presented as means with their standard errors. Results were considered to be significant at the level of P < 0·05. A 2 (preload times) × 4 (preload conditions) ANOVA was performed to study energy intake and energy compensation values. Tukey's significant difference test was used for post hoc comparisons of general significant effects. Energy intake at lunch and the 24 h food intake with and without the preload were analysed. The percentage of energy compensation at lunch for preload P was calculated as follows:

In the same way, the percentage of energy compensation over the whole day was calculated by dividing the difference in 24 h energy intake between the control situation and situation P by the energy value of the preload P:
● if compensation is statistically < 0 %, then it is null compensation;
● if compensation is statistically >0 % and statistically < 100 %, then it is partial compensation;
● if compensation is statistically >0 % and does not differ from 100 %, then it is complete or full compensation;
● if compensation is statistically >100 %, then it is overcompensation.
Difference from 0 to 100 % was analysed using the Student tests (H0: compensation = 0 %, and then H0: compensation = 0 %).
A one-way ANOVA was performed to analyse the palatability of the three preloads. Tukey's significant difference test was used for post hoc comparisons of general significant effects.
Finally, rating data were studied by an ANOVA for repeated measures in each group. The Tukey–Kramer significant difference test was used for post hoc comparisons of general significant effects.
Results
Palatability of preloads and meals
In both groups, there was no difference in palatability between the three preloads (scores: 5·1 (sem 0·2) for the protein preload; 5·5 (sem 0·2) for the carbohydrate preload and 5·7 (sem 0·3) for the lipid preload). Lunch and dinner were considered to be isopalatable, with respective mean scores of 69·9 (sem 2·0) and 70·5 (sem 1·8) mm on the VAS. Consuming a preload did not modify the palatability of lunch and dinner when compared with the control conditions, and the palatability of these two meals did not differ as a function of the preload ingested.
Energy intake
At lunch, analysis of the effect of the time elapsing between the preload and test meal ingestion showed that there was no significant difference between groups T0 and T1, and that there was no group × preload interaction. The ingestion of a preload led to a decrease in food intake at lunch compared with the control (F(3,162) = 11·79, P < 0·0001). Indeed, energy intake following the ingestion of proteins, carbohydrates and lipids was lower than the control energy intake (P = 0·0001, < 0·0001 and 0·0004, respectively). Moreover, energy intake at lunch was lower after carbohydrate ingestion than after lipid ingestion (P = 0·041). When the energy value of the preloads was added to the energy consumed at lunch, energy intake was significantly higher following the ingestion of a preload compared with the control (F(3,162) = 18·28, P < 0·0001). There was no significant difference between the three preloads (Table 3).
(Mean values with their standard errors)
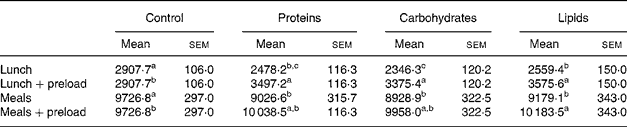
a,b Mean values within a column with unlike superscript letters were significantly different (P < 0·05).
Throughout the day (breakfast, lunch, afternoon snack and dinner), analysis of the effect of the time elapsing between the preload and test meal ingestion showed that there was no significant difference between groups T0 and T1, and that there was no group × preload interaction. The ingestion of a preload led to a decrease in daily food intake compared with the control (F(3,162) = 8·48, P < 0·0001). Indeed, energy intake following the ingestion of proteins, carbohydrates and lipids was lower than the control energy intake (P < 0·0001, < 0·0001 and 0·0018, respectively). Overall, daily energy intake (i.e. the total of all meals and the preload) was significantly higher on the day the lipid preload was consumed than on the no-preload control day (P = 0·0093), but overall energy intake on the days the protein and carbohydrate preloads were consumed was intermediate between intake on the lipid and control days, and did not differ significantly from either of these. There was no difference between the three preloads (Table 3).
As for energy compensation, the volunteers partially compensated for the energy supplied by the preloads at lunch (42·3 (sem 8·5), 53·2 (sem 7·4) and 36·1 (sem 11·1) %, respectively, with the protein, carbohydrate and lipid preloads). Energy compensation values at lunch were not different between the three preloads. Over the whole day, energy compensation was not different from 100 % with the carbohydrate preload (77·5 (sem 16·0) %) and was partial with the protein and lipid preloads (69·2 (sem 15·4) and 56·3 (sem 18·5) %, respectively), although these values did not differ significantly between the preloads.
Visual analogue scales scores
In group T0, when the effect of ingesting the preloads was compared with the control, differences were only observed just before lunch. Hunger and prospective consumption decreased significantly with the protein preload (P = 0·02 and 0·03, respectively) and the lipid preload (P = 0·001 and 0·01, respectively) but not with the carbohydrate preload, when compared with the control. Desire to eat only decreased significantly with the lipid preload (P = 0·001), while fullness increased significantly with all the three preloads (P = 0·01, 0·001 and 0·01 with proteins, carbohydrates and lipids, respectively) compared with the control. These differences disappeared after lunch, and the evolution of appetite sensations remained the same thereafter under the four conditions (three preloads and control) (Fig. 2).
(a) Hunger, (b) prospective food consumption, (c) fullness and (d) desire to eat scores rated by visual analogue scales (VAS) throughout the day in group T0 (group of volunteers who ate their lunch immediately after ingesting the preload, n 28). Values are means (mm) with their standard errors. * Mean VAS scores were significantly different from the control with at least one of the three preloads (P < 0·05). –♦–, Protein; —■—, carbohydrates; —●—, lipids; – × –, control.

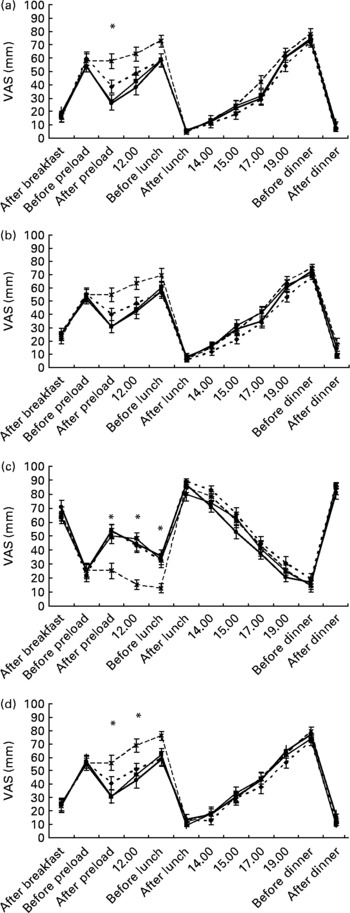
When the effect of ingesting the preloads was compared with the control in group T1, differences were only observed just after the ingestion of the preload, at 12.00 hours and before lunch. After ingesting the preload, hunger and desire to eat decreased significantly with the carbohydrate preload (P = 0·02 and 0·008, respectively) and the lipid preload (P = 0·007 and 0·01, respectively) compared with the control. Fullness was significantly higher compared with the control, whatever the preload ingested was (P = 0·001, 0·01 and 0·001 for proteins, carbohydrates and lipids, respectively). At 12.00 hours, fullness was significantly higher compared with the control, whatever the preload ingested was (P = 0·002, < 0·001 and 0·001 for proteins, carbohydrates and lipids, respectively). Desire to eat only decreased significantly with the lipid preload (P = 0·004). Before lunch, fullness was only significantly higher with the lipid preload (P = 0·03) compared with the control. These differences disappeared after lunch, and the evolution of appetite sensations remained the same thereafter under the four conditions (three preloads and control) (Fig. 3).
(a) Hunger, (b) prospective food consumption, (c) fullness and (d) desire to eat scores rated by visual analogue scales (VAS) throughout the day in group T1 (group of volunteers who ate their lunch 1 h after ingesting the preload, n 28). Values are means (mm) with their standard errors. * Mean VAS scores were significantly different from the control with at least one of the three preloads (P < 0·05). –♦–, Protein; —■—, carbohydrates; —●—, lipids; – × –, control.
Discussion
The purpose of this study was to compare the effects of proteins, carbohydrates and lipids on appetite scores and food intake at subsequent meal(s) using preloads that only contained one of the three macronutrients. In this work, disguised preloads with the same volume, energy content, energy density, viscosity and palatability were used, because it had been shown that all these properties of food may affect food intake. In addition, the interval between the preload and test meal ingestion was also tested, as this also appeared to be an important parameter.
The main results showed that the ingestion of a preload before a test meal led to a decrease in energy intake at that meal and over the whole day. Throughout the day, when the energy of the preloads was included, food intake was higher after the ingestion of the lipid preload than in the control situation. Finally, there was neither any significant effect of the delay between the preload and test meal ingestion nor any interaction between preload and delay.
The present results are in agreement with the findings of several studies which showed that the consumption of a preload leads to a decrease in food intake at a test meal and/or appetite scores when compared with a control situation involving no preload. Indeed, Rolls et al. (Reference Rolls, Kim-Harris and Fischman35) showed that volunteers displayed a lower energy intake during a test meal served 30 min after a high-carbohydrate yoghourt preload ingestion. Moreover, Kirkmeyer(Reference Kirkmeyer and Mattes36) showed that hunger scores were lower 3 h after a 3 MJ preload ingestion in comparison with the control situation.
In our study, the consumption of a preload led to a decrease in food intake compared with the control at lunch and over the whole day (energy of the preloads not included). Moreover, there was no difference between the three preloads except at lunch where energy intake after lipid ingestion was higher than that after carbohydrate ingestion. When the energy of the preloads was included, food intake was higher than that in the control situation after the ingestion of the three preloads at lunch and only after the ingestion of lipid preloads throughout the day. Energy compensation was partial at lunch and throughout the day except the 24 h energy compensation after the ingestion of a carbohydrate preload, which was not statistically different from 100 %. Moreover, the values of energy compensation did not differ between the three macronutrients.
With respect to VAS scores, we were not able to determine a difference between the three types of preloads. The responses of volunteers to the four questions on hunger, fullness, prospective food consumption and desire to eat were consistent with their intake: for instance, in group T0, the volunteers stated that they were hungrier just before lunch in the control situation than on days when they consumed a preload. In the same way, in group T1, the subjects stated that they were always hungrier between the time of the preload and lunch ingestion (after the ingestion of the preload, at 12.00 hours and before lunch) in the control situation than on days when they also consumed a preload.
The fact that we were not able to demonstrate any major differences between the effects of carbohydrates, proteins and lipids on food intake and appetite scores was in agreement with the findings of Geliebter(Reference Geliebter16), who used isoenergetic liquid preloads of 1180 kJ containing either carbohydrates, proteins or lipids which were given 70 min before a test meal. In the same way, Fischer(Reference Fischer, Colombani and Wenk26) could not demonstrate a differential impact on food intake and appetite scores in a study using pure carbohydrate, protein or lipid vanilla cream preloads served 4 h before a test meal. Compared with these two studies and the present study, other experiments that revealed a hierarchy of satiety effects between macronutrients often used preloads which differed in terms of energy density, texture and palatability. For instance, Marmonier et al. (Reference Marmonier, Chapelot and Louis-Sylvestre37) compared the effects of a high-protein preload (chicken breast), high-fat preload (cream cheese) and high-carbohydrate preload (rye bread with raisins) by measuring the time elapsing between ingestion of the preload and the test meal based on spontaneous request, and showed that this period was significantly longer after the ingestion of a high-protein preload. Similarly, Rolls et al. (Reference Rolls, Hetherington and Burley38) showed that energy intake during a buffet meal was significantly lower 2 h after the ingestion of a preload rich in starch or proteins than after the ingestion of lipid or sucrose preloads, but these preloads were not disguised, and they differed markedly in terms of texture, energy density and palatability (pasta for the starch preload, chicken breast for the protein preload, cream cheese for the lipid preload and Turkish cakes for the sucrose preload). However, the sensory differences between preloads do not appear as an absolute necessity as shown by the work of Bertenshaw et al. (Reference Bertenshaw, Lluch and Yeomans5), which demonstrated a higher satiety of proteins than of carbohydrates consumed in disguised liquid preloads.
The pattern of differences between the effects of carbohydrates, proteins and lipids on food intake may have been due to the type of macronutrients used during our experiment. It has been shown that within a group of macronutrients, the type and source of proteins, carbohydrates or lipids may impact their satiety effect. In terms of proteins, differences have been demonstrated between egg and whey proteins(Reference Anderson, Tecimer and Shah28), and between casein and whey proteins(Reference Hall, Millward and Long39). As for carbohydrates, some studies have revealed differences between glucose and fructose(Reference Spitzer and Rodin40) or between low- and high-glycaemic index foods(Reference Raben41). Rolls et al. (Reference Rolls, Hetherington and Burley38) also showed a difference in satiety effect between two types of carbohydrate preloads (starch and sucrose). Finally, in his review, French(Reference French42) explained that chain length and the degree of fat saturation could have an influence on the satiety effect of lipids. In our study, we used certain types of carbohydrates (maltodextrins), proteins (90 % whey proteins and 10 % casein) and lipids (50 % palm oil and 50 % soya bean oil), which could explain the present results.
Other parameters may also explain the differences in results between studies, such as the amount of energy in preloads and the interval elapsing between the preload and test meal ingestion. Most studies that showed an effect of preloads on subsequent food intake used high-energy preloads containing between 1·5 and 3·0 MJ(Reference Rolls, Hetherington and Burley38, Reference Whybrow, Mayer and Kirk43), which is somewhat higher than the value in our preloads (1020 kJ). However, the amount of energy supplied in our experiment appeared to be adequate because Marmonier et al. (Reference Marmonier, Chapelot and Louis-Sylvestre37) and Porrini et al. (Reference Porrini, Santangelo and Crovetti14) managed to demonstrate differential effects between macronutrients providing less energy. In our case, an interval of 0 or 1 h between the preload and test meal ingestion appeared to be appropriate, insofar as the studies done by Porrini et al. (Reference Porrini, Santangelo and Crovetti14) and Anderson et al. (Reference Anderson, Tecimer and Shah28) were able to demonstrate the satiety effect of a preload on a test meal eaten 0–120 min after its ingestion. However, we observed no difference between the two time intervals we used. Nevertheless, we could hypothesise that the maximum impact exerted by each macronutrient on satiety did not necessarily appear after the same period, and could also vary as a function of the physical appearance, or solid/liquid nature, of the foods tested.
The experiment was performed using normal-weight subjects because the aim was to study the effect of macronutrients on satiety under conditions that were as standardised as possible: healthy subjects, with no weight management problems and no diabetes or elevated cholesterol. However, our sample of volunteers included more women than men. Rolls et al. (Reference Rolls, Kim-Harris and Fischman35) showed that young men appear to present better energy compensation after ingesting a preload than women. In our case, the results were the same for women analysed separately and for all the volunteers, whereas in men, we did not observe any decrease in food intake at lunch after they had ingested a preload. However, twelve men were included in the study, so the power of calculations concerning them was probably too weak to reach any clear conclusion.
Finally, it is possible to hypothesise that the perceptions of the volunteers with respect to the foods chosen as preloads may have influenced their food intake and appetite scores. Indeed, most studies that demonstrated any differences between macronutrients used solid preloads consisting of common foods(Reference Porrini, Santangelo and Crovetti14, Reference Marmonier, Chapelot and Louis-Sylvestre37, Reference Rolls, Hetherington and Burley38), whereas studies that did not reveal any differences between macronutrients used liquid or semi-liquid preloads prepared specifically for the experiment and thus new to the subjects(Reference Geliebter16, Reference de Graaf, Hulshof and Weststrate44). Moreover, most studies that demonstrated a satiety effect of liquids used soups, which tend to be perceived as a meal as opposed to juice or sweetened drinks(Reference Almiron-Roig, Chen and Drewnowski29, Reference Mattes45). In our study, we used sweet chocolate drinks previously unknown to the volunteers, which they may not have considered as a real food. It could be suggested that using a novel food as a preload may influence its impact on food intake. According to the concept of learned satiety demonstrated by Louis-Sylvestre(Reference Louis-Sylvestre, Tournier and Verger46), human subjects are able to learn and anticipate the consequences of ingesting a particular food after a short conditioning period on appetite sensations. The effect of discovering a novel food as a preload may mask the potential effect of the macronutrients. In view of this hypothesis, one suggestion concerning future studies may be to include, as it has been already carried out in works of Yeomans(Reference Yeomans, Gould and Leitch47) and Booth(Reference Booth, Mather and Fuller48), a conditioning period of a few days for each type of preload before the test day in order to circumvent the ‘novel food effect’ and thus obtain an impact on food intake that is solely dependent on the macronutrient composition. It might also be possible to use disguised pure macronutrients in solid preloads, but this may constitute an unachievable technological challenge.
In conclusion, we were not able to confirm the stronger satiety effect of a liquid pure protein preload by comparison with carbohydrate or lipid preloads with the same energy content, energy density, viscosity and palatability, in healthy normal-weight men and women, following the first time they were consumed. However, some of our findings showed that a lipid preload does not lead to a reduction in food intake compared with a control situation, and that it leads to a higher energy intake than that observed after carbohydrate ingestion, thus suggesting a weaker satiety effect of lipids.
Acknowledgements
We confirm that no conflicts of interest are associated with the present study. The study received funding from INRA. We would also like to thank Anne Regourd and Pascale Reichl for their assistance in carrying out the protocol. The authors' contributions are as follows: M. P., A. M.-B., G. F. and D. T. designed the study and compiled the manuscript. A. L. and R. B. contributed to the design of the study.



