


1 Introduction
Transonic shock buffet on civil aircraft wings presents a key challenge for aerodynamicists, with no unequivocal explanation of the underlying flow mechanisms. The term shock buffet typically refers to self-sustained shock oscillation and intermittent boundary-layer separation, induced by shock-wave/boundary-layer interaction (SWBLI) beyond critical parameter combinations such as Mach number and angle of attack. This reportedly aerodynamic instability exhibits distinct characteristics on nominally two-dimensional aerofoils and proper three-dimensional wings, and despite over half a century of research the physical mechanisms remain elusive, especially in the case of swept wings (Giannelis, Vio & Levinski Reference Giannelis, Vio and Levinski2017). Transonic shock buffet leads to unsteady aerodynamic loads and a consequent structural response, referred to as buffeting, mutually interacting with the flow. This inflicts a drag penalty with an associated increased environmental footprint, deteriorates the aircraft’s performance, handling qualities and structural fatigue life, and degrades passengers’ comfort. For these reasons, certification requirements stipulate a safety margin between the design cruise point and buffeting conditions. In effect, shock buffet limits the flight envelope at high Mach number and load factor, motivating continuous scrutiny from both industry and academia.
Research in the field of transonic shock buffet is predominantly focussed on flow over aerofoils and has greatly improved the understanding of two-dimensional buffet (see the reviews by Lee (Reference Lee2001) and Giannelis et al. (Reference Giannelis, Vio and Levinski2017)). In the turbulent transonic flow regime, periodic shock oscillations with low frequencies (well below the energetic scales of the incoming boundary layer) and large shock excursions (around 20 % of the chord length) have been reported in several experimental and numerical studies (see for example McDevitt & Okuno (Reference McDevitt and Okuno1985), Deck (Reference Deck2005) and Jacquin et al. (Reference Jacquin, Molton, Deck, Maury and Soulevant2009)). An early explanation of the shock dynamics relies on an acoustic feedback loop which sustains the shock oscillations (Lee Reference Lee1990). Following this work, several experiments of increasing complexity and instrumentation have described low-frequency shock oscillations, typically at Strouhal numbers (based on chord length) between 0.06 and 0.08 (Feldhusen-Hoffmann et al. Reference Feldhusen-Hoffmann, Statnikov, Klaas and Schröder2018). These frequencies generally compare well with those predicted by Lee’s model, even though the propagation path of the acoustic waves is debated (Jacquin et al. Reference Jacquin, Molton, Deck, Maury and Soulevant2009). Another explanation to the self-sustained shock oscillations is rooted within stability theory and describes shock buffet as a Hopf bifurcation with a globally unstable mode of the flow appearing above critical conditions (Crouch et al. Reference Crouch, Garbaruk, Magidov and Travin2009; Sartor, Mettot & Sipp Reference Sartor, Mettot and Sipp2014). The mode’s spatial structure depicts the shock wave as the dominating flow feature but also shows a contribution within the downstream shear layer, such that buffet is described as a pulsating recirculating bubble synchronised with the shock displacement (Sartor et al. Reference Sartor, Mettot and Sipp2014). Moreover, its frequency closely matches the experimental value for the shock oscillations. Such an observation reveals similarities with Lee’s model, which relies on the propagation of pressure waves within the separated boundary layer and acoustic waves radiated from the trailing edge travelling through the surrounding subsonic flow. However, further work is required to consolidate these observations into a unified aerofoil shock buffet model. Whilst in these works the boundary layer is turbulent upstream of the SWBLI, noticeable differences have recently been reported under laminar flow conditions, where laminar-to-turbulent transition takes place in the region of the SWBLI. In this case, the shock undergoes smaller chordwise excursions confined to the shock foot, which oscillates at frequencies over an order of magnitude higher than fully turbulent interactions (Brion et al. Reference Brion, Dandois, Abart and Paillart2017; Dandois, Mary & Brion Reference Dandois, Mary and Brion2018). Direct numerical simulation at moderate Reynolds number has revealed complex interaction between shock and pressure waves and boundary layers, with these flow features occurring at frequencies distinct from characteristic low-frequency lift fluctuations at  $St\approx 0.1$ (Zauner, De Tullio & Sandham Reference Zauner, De Tullio and Sandham2019).
The difficulty in elucidating the flow physics governing transonic wing shock buffet is further compounded by three-dimensional interactions and complex geometries. Even though a number of research organisations have invested substantial resources in this topic, literature on swept-wing buffet remains limited, calling for synergistic experimental and numerical efforts. Early studies employing wind tunnel and flight tests (Hwang & Pi Reference Hwang and Pi1975; Riddle Reference Riddle1975; Roos Reference Roos1985) have shown that wing buffet differs from aerofoil buffet in two main aspects. First, the shock oscillations are non-periodic with a broadband frequency signature, and second, their chordwise excursions are smaller, varying along the span. Benoit & Legrain (Reference Benoit and Legrain1987) highlighted how unsteady flow causes narrow-band fluctuations on aerofoils and unswept wings but do not apply to swept, transport-type wings. Instead, swept wings exhibit broadband fluctuations and the evolution of the separation region with incidence differs in terms of spanwise extent.
The physical interpretation of this characteristic broadband signature has been greatly aided by the advent of advanced optical measurement methods. Novel techniques such as dynamic pressure-sensitive paint (DPSP), essentially a fast-response pressure-sensitive paint (PSP) coupled with high-frame-rate imaging, aptly provide the community with surface pressure measurements of high spatial and temporal resolution. Such data is critical to complement numerical work of ever-increasing fidelity, motivated by renewed interest in edge-of-the-envelope aerodynamics. The interested reader is referred to the review on PSP by Gregory et al. (Reference Gregory, Sakaue, Liu and Sullivan2014). Early applications in transonic wind tunnels (Steimle, Karhoff & Schröder Reference Steimle, Karhoff and Schröder2012; Merienne et al. Reference Merienne, Le Sant, Lebrun, Deleglise and Sonnet2013) had poor resolution and restricted coverage, limited by the paint composition, its application, and camera technology. Having demonstrated the potential to clarify the flow mechanisms of complex flows, this rapidly evolving technique attracted attention, with recent experiments successfully acquiring unsteady pressure over the entire wing surface (Lawson, Greenwell & Quinn Reference Lawson, Greenwell and Quinn2016; Sugioka et al. Reference Sugioka, Koike, Nakakita, Numata, Nonomura and Asai2018). In effect, rather than being confined to the discrete locations of pressure transducers, analysis is enabled over a much wider area, giving critical insight as discussed herein.
Notably, the experimental test by Lawson et al. (Reference Lawson, Greenwell and Quinn2016) simultaneously measured unsteady pressure using DPSP and unsteady transducers together with structural response data over a wide range of flow conditions. For their so-called RBC12 half-model, increased pressure fluctuations due to separated flow within a low-frequency range of  $0.05\leqslant St\leqslant 0.15$, where $St$ is the Strouhal number based on mean aerodynamic chord, coincide with the structural buffeting incidence defined by the direct measurement of the structural response using strain gauges and accelerometers. As the incidence is further increased penetrating into the light buffeting regime, the unsteady shock oscillation over larger chordwise extents at outboard stations within a broader frequency range ( $0.08\leqslant St\leqslant 0.5$) becomes the principal cause of structural buffeting. Further analysis of this DPSP dataset (Masini et al. Reference Masini, Timme, Ciarella and Peace2017), employing cross-spectral analysis along the shock front and a proper orthogonal decomposition of the unsteady pressure, revealed two principal and coexisting phenomena. First, pressure waves run inboard along the shock in the spanwise direction at low frequencies ( $0.05\leqslant St\leqslant 0.15$). Power spectra are characterised by a bump in this frequency range and the pressure signals have high coherence in the spanwise direction. Second, distinct higher-frequency ( $0.2\leqslant St\leqslant 0.5$) waves, confined to the tip region, run outboard beyond buffet onset.
Under the broad definition of SWBLI (see for example the reviews by Clemens & Narayanaswamy (Reference Clemens and Narayanaswamy2014) and Gaitonde (Reference Gaitonde2015)), both phenomena would be categorised as manifestations of low-frequency shock unsteadiness, having frequencies of at least two orders of magnitude lower than those associated with wall-bounded turbulence. Even in the case of supersonic flows which comprise most of the SWBLI literature, the causality of the mechanisms driving the low-frequency shock motions remains controversial and debated. Whilst swept-wing shock buffet research has primarily focussed on the broadband outboard-running fluctuations, few studies mention the low-frequency shock unsteadiness on wings that dominates the shock dynamics before buffeting onset. Evidence concerning the latter in the published literature is almost exclusive to wind tunnel tests, although a recent global stability analysis on an infinite-span swept wing has reported such a phenomenon (Crouch, Garbaruk & Strelets Reference Crouch, Garbaruk and Strelets2018). The study by Masini et al. (Reference Masini, Timme, Ciarella and Peace2017) and close examination of the results by Dandois (Reference Dandois2016) show that the highest signal coherence in a spanwise sense was obtained in the low-frequency range ( $0.04\leqslant St\leqslant 0.08$), whereby pressure fluctuations propagate inboard, albeit on different wing models investigated in different wind tunnels. Noting that the shock is affected by upstream- and/or downstream-running perturbations (Sartor et al. Reference Sartor, Mettot, Bur and Sipp2015) which might naturally be present in a wind tunnel environment, such observations raise questions on the origin of this shock unsteadiness and its relation to the reportedly pure aerodynamic shock buffet instability. In this regard, closed-circuit transonic wind tunnels exhibit upstream-propagating acoustic noise (Haxter et al. Reference Haxter, Brouwer, Sesterhenn and Spehr2017), whilst a receptivity analysis of an aerofoil in shock buffet conditions revealed that such flow is receptive to disturbances propagating downstream, with the shock acting as a low-pass filter of the external forcing (Sartor et al. Reference Sartor, Mettot and Sipp2014). In addition to the influence of boundary layer fluctuations and external disturbances, the wing’s structural dynamics may also contribute to the shock unsteadiness. Under such high-loading conditions, a flexible wing encounters both static deformation and dynamic fluid–structure interaction in response to aerodynamic and external loading. In their numerical time-linearised analysis, Timme & Thormann (Reference Timme and Thormann2016) showed how forced wing vibration excites both a low-frequency response, dominated by the shock unsteadiness, and distinct higher-frequency peaks at typical swept-wing buffet frequencies. Whilst the latter is greatly amplified around the critical flow condition, the lower-frequency shock unsteadiness has lower sensitivity, highlighting coexisting phenomena. Closer examination of the data showed that inboard propagation takes place at low frequencies on the RBC12, and the higher-frequency behaviour is found on different generations of civil aircraft wings (Belesiotis-Kataras & Timme Reference Belesiotis-Kataras and Timme2018).
Shifting the focus to the broadband-frequency signature typically reported in swept-wing shock buffet studies, recent experimental work in several transonic wind tunnels (Dandois Reference Dandois2016; Koike et al. Reference Koike, Ueno, Nakakita and Hashimoto2016; Lawson et al. Reference Lawson, Greenwell and Quinn2016) employing models equipped with dedicated instrumentation have confirmed such characteristic bumps in the wall-pressure spectra, typically in a Strouhal number range between 0.2 and 0.6. A cross-spectral analysis of the unsteady transducer data reveals outboard-running spanwise propagations at this frequency bump, when considering conditions beyond buffet onset. On the numerical front, systematic work by Iovnovich & Raveh (Reference Iovnovich and Raveh2015) employing time-marching unsteady Reynolds-averaged Navier–Stokes simulations, highlighted how the chordwise-driven mechanism for aerofoils and unswept wings no longer applies at sweep angles higher than  $20^{\circ }$. Instead, pressure propagates along the shock in a spanwise direction towards the wing tip, showing a monotonic frequency increase with sweep angle for the shock oscillations. Pockets of downstream shock-induced separation, coined therein as buffet cells, synchronised with the outboard-travelling shock excursion, were also observed. Scale-resolving detached-eddy simulations (DES) (see for example Brunet & Deck (Reference Brunet and Deck2008) and Sartor & Timme (Reference Sartor and Timme2017)) have captured the characteristic ripples along the shock, together with the outboard propagation of buffet cells. Such structures have also been identified from a modal analysis of zonal DES data (Ohmichi, Ishida & Hashimoto Reference Ohmichi, Ishida and Hashimoto2018). Whilst these studies demonstrate the capability of advanced numerical methods to describe the shock dynamics, the flow conditions are set well beyond buffet onset and do not address the inherent dynamics governing onset. To this end, a global stability analysis has linked buffet cells to an unstable linear eigenmode, supporting the idea that these propagations constitute a global instability that self-sustains shock buffet (Timme Reference Timme2019). Furthermore, a DES study by Masini, Timme & Peace (Reference Masini, Timme and Peace2018) has identified a pulsating separated region periodically perturbing the shock around a Strouhal number of 0.2, in effect propagating pressure outboard. This contrasts with the broadband flow characteristics identified at a higher angle of attack on the same configuration and a similar numerical approach (Sartor & Timme Reference Sartor and Timme2017). It is noted that these numerical studies did not report on inboard-running pressure propagation along the shock wave.
In this paper, we further analyse the extensive experimental database introduced by Lawson et al. (Reference Lawson, Greenwell and Quinn2016). The primary focus is the elucidation of the unsteady flow physics that coincide with the onset of the structural buffeting response on civil aircraft wings for a range of Mach numbers. This paper highlights for the first time the low-frequency shock unsteadiness, which is present on wind tunnel models even in pre-onset conditions, but has not thoroughly been discussed in experimental (or numerical) shock buffet studies previously. The low-frequency fluctuations are analysed using both unsteady transducer and DPSP data and reveal inboard-running waves along the shock front. Notably, the large spatial coverage enabled by the use of the DPSP dataset emphasises distinct characteristics at onset conditions whereby the shock unsteadiness reverses spanwise direction at the outboard location of the separated region. Furthermore, higher-frequency fluctuations within the accepted shock buffet range are characterised. Convection speeds of these two coexisting, but distinct, flow phenomena are computed along the shock wave at a range of Mach numbers and angles of attack. Modal analyses of the DPSP data using both proper orthogonal and dynamic mode decomposition corroborate the pertinent flow physics and characteristic shock motions. These observations raise questions regarding the origin of this unsteadiness, and whether shock buffet is driven by a global flow instability that imposes its own dynamics or the instability is of a convective type and selectively amplifies existing noise.
This paper is organised as follows. The experimental set-up and data acquisition are described in § 2 while details on the data processing and analysis methods are outlined in § 3. In § 4, the ambiguity surrounding the shock buffet onset definition is highlighted, before scrutinising the onset of the structural response on the RBC12. Unsteady pressure data from both transducers and DPSP are analysed in § 5. Lastly, a reflection on the main observations and the shock buffet instability follows in § 6.
2 Experimental set-up
The analysis presented herein uses data from experimental tests conducted in early 2015 within the European Commission Clean Sky buffet control of transonic wings (known as BUCOLIC) project. The following section provides details of the wind tunnel and flow conditions together with a description of the model, instrumentation and data acquisition.
2.1 Wind tunnel testing and model description
The tests were conducted in the Aircraft Research Association Transonic Wind Tunnel which is of a closed-circuit, continuous type. This facility has a test section of 2.74 m by 2.44 m, an operating Mach number of up to 1.4, and the stagnation pressure can be varied between 80 and 120 kPa. During these tests, the latter was maintained at around 100 kPa and the stagnation temperature was between 290 and 310 K. The working section’s ceiling and sidewalls are 22 % porous whilst the floor is solid. Turbulence levels in the test section were measured at 0.1 % longitudinally and 0.2 % laterally (Green et al. Reference Green, McHugh, Baxendale and Stanniland1992).
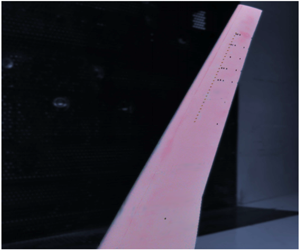
The RBC12 half-model, representing a commercial aircraft of a typical 1970s/1980s design, was mounted on the solid floor, as shown in figure 1(a). The model has a reference area of  $0.2959~\text{m}^{2}$, a mean aerodynamic chord (MAC) of 0.2789 m and a reference semi-span, $b$, of 1.0846 m. The aspect ratio is 7.78 and the quarter-chord sweep angle, $\unicode[STIX]{x1D6EC}_{c/4}$, is $25^{\circ }$. These dimensions are based on measurements obtained from a coordinate measurement machine and additional geometrical properties are provided in figure 1(b). The structural frequencies of the model have been reported as 38 Hz at first wing bending, 125 and 255 Hz at higher-frequency predominantly bending modes, and 328 Hz at the first torsion mode (Lawson et al. Reference Lawson, Greenwell and Quinn2016). These were determined by analysing the root strain gauge and accelerometer signals during a wind-off tap test. Furthermore, aeroelastic modes similar to those at wind-off condition were obtained from the wind-on response at the design Mach number, $M=0.80$, and low incidence. An additional peak at 114 Hz is also present and is thought to be the second harmonic of the first bending mode. These structural frequencies are denoted by vertical lines in the frequency spectra to follow.
RBC12 half-model: (a) installation on wind tunnel floor and (b) geometrical information (semi-span of 1.104 m includes the model plinth of 0.019 m).

During the wind tunnel campaign, a total of four configurations were devised and tested at various flow conditions: (i) clean wing, (ii) full array of 30 vane vortex generators, (iii) sparse array of 8 vane vortex generators, and (iv) clean wing with alternative transition location. Transition was fixed on both fuselage and wing by means of sparsely distributed Ballotini set in a thin film of epoxy resin. The nominal clean-wing transition location on the wing’s upper surface is 10 % local chord at the tip, 14 % at the crank and 15 % at the root, while this is at 5 % on the lower surface. The alternative transition location on the upper surface is further downstream at 25 % chord, with the lower surface unaltered. In all configurations, the fuselage was tripped 104 mm aft of the nose. Laminar-to-turbulent transition was verified by infrared thermography during particular runs.
Summary of flow conditions and buffet-onset incidence.

This paper focuses on the first configuration, i.e. the clean wing with nominal transition, tested extensively at a range of flow conditions from  $M=0.70$ to 0.84. At each Mach number, unsteady data was measured from fine pitch runs, typically with $0.1^{\circ }$ angle of attack increments, whereas data from the dynamic data acquisition system (DDAS) and DPSP measurements were acquired simultaneously at coarser increments of approximately $0.2^{\circ }$, depending on the Mach number. Throughout the runs, the Reynolds number, $Re$, varied between $2.7\times 10^{6}$ and $3.9\times 10^{6}$ with MAC as reference length. The flow conditions including the free stream static temperature, $T$, static pressure, $P$, velocity, $U_{\infty }$, and the buffet-onset incidence, $\unicode[STIX]{x1D6FC}_{b}$, for the test runs with simultaneous DDAS and DPSP acquisition analysed in this paper are summarised in table 1. The data acquisition is described more comprehensively in § 2.2 while the definition for $\unicode[STIX]{x1D6FC}_{b}$, which is quite intricate due to several criteria and various interpretations put forward along the years, is clarified in § 4.
The flow conditions reported in this paper have been corrected for wind tunnel interference effects and are compatible with previous publications (Lawson et al. Reference Lawson, Greenwell and Quinn2016; Masini et al. Reference Masini, Timme, Ciarella and Peace2017). Specifically, in half-model testing where the model is mounted to the floor, interference effects arise from the floor and sidewalls. While this is not an issue in incremental testing, the influence on flow development has to be considered when comparing with numerical simulations. Interference effects can be classified into two groups: (i) effects on Mach number and (ii) effects on incidence. For the former, an empirical correction based on the model’s longitudinal area distribution and the effect of porosity is applied to correctly set the tunnel speed accounting for solid blockage. In the case of incidence, even though the model is raised by a plinth that is approximately equal to the floor’s boundary-layer displacement thickness, there is a small reduction in lift generated by the fuselage. To correct for incidence, first, a wall-constraint correction is applied to the data that is a function of wing span and area, lift coefficient and wall porosity. Second, for the configurations coated with DPSP, a small paint-effect correction is introduced to account for a thicker boundary layer due to increased surface roughness, which in effect causes a slightly forward shock position. The influence on effective aerodynamic incidence was estimated by comparing pressure distributions of a painted and unpainted model at the same flow conditions (Lawson & Greenwell Reference Lawson and Greenwell2015).
2.2 Instrumentation and data acquisition
The RBC12 model was equipped with dedicated instrumentation for the shock buffet focussed test campaign. Mean pressure data were obtained from 369 static pressure taps along the fuselage and wing, while aerodynamic forces and moments were measured with a five-component strain gauge balance. Conventional unsteady model instrumentation amounted to 27 unsteady transducers (24 on the upper surface, three on the lower surface), eight accelerometers and a root strain gauge. The unsteady signals were acquired via dedicated channels at 100 kHz over ten-second samples. The locations of the upper-surface static-pressure taps and unsteady instrumentation are shown in figure 2, where  $X$ and $Y$ denote the chordwise and spanwise coordinates, respectively. The spanwise position is made dimensionless by the reference semi-span after subtracting the plinth thickness, such that $\unicode[STIX]{x1D702}=(Y-0.019)/b$. Herein, the precise locations of the transducers are provided by the local chordwise coordinate, $x=X-X_{LE}$, and the local chord length, $c=X_{TE}-X_{LE}$, where subscripts $LE$ and $TE$ denote leading and trailing edge, respectively.
Locations of instrumentation on wing’s upper surface: (a) 162 static pressure taps and (b) unsteady pressure transducers, accelerometers and a root strain gauge denoted by the black filled circles, blue filled squares, and the grey cross, respectively.

In addition, a DPSP system was employed consisting of two high-speed Vision Research Phantom (v1610 and v1611) synchronised cameras, one for each surface. Critically, this captured the three-dimensional flow development through unsteady surface pressure measurements of high spatial and temporal resolution. Data was typically recorded at 4000 frames per second (f.p.s.) for five seconds, except for a single run of the clean configuration at  $M=0.80$, using 2000 f.p.s. for 10 s. The camera resolution was 1280 pixel by 800 pixel, equivalent to around $1.3~\text{pixel}~\text{mm}^{-1}$ on the wing, a bit depth of 12 bits, and an exposure time between 150 and $250~\unicode[STIX]{x03BC}\text{s}$. For further details on the wind tunnel testing, the reader is referred to Lawson et al. (Reference Lawson, Greenwell and Quinn2016).
3 Data processing
3.1 Dynamic pressure-sensitive paint data preprocessing
The acquired images were preprocessed to convert image intensities into static pressure data using an in-house software (Lawson et al. Reference Lawson, Greenwell and Quinn2016). The first step is image alignment to compensate for small model and camera movements due to the wind tunnel environment, whereby each frame is aligned to a wind-off image via an image-registration algorithm based on cross-correlation. The variation in illumination over the recording time is then accounted for by normalising the images by a high-order curve fit of the lamp-power history. The intensity ratios are calculated by the quotient of the wind-off and wind-on images, such that any discrepancies in intensity over the wing are also corrected. Finally, the calibration between image intensity and static pressure is applied to every image, based on a least squares relationship between the image-intensity ratios in the proximity of a high number of reference static pressure taps.
Further details of this involved process and its validation are described by Lawson et al. (Reference Lawson, Greenwell and Quinn2016). Essentially, the time-averaged DPSP data is within  $\pm 2000$ Pa (corresponding to $\pm 2\,\%$ of reference stagnation pressure) compared to the static pressure taps. More importantly, excellent agreement between the frequency spectra from unsteady pressure transducers and adjacent pixel data was obtained, rendering this optical measurement technique suitable to analyse the unsteady surface pressure flow field with confidence.
3.2 Signal processing
Signal-processing techniques were applied to the unsteady signals (both DDAS and DPSP), using Welch’s method (Welch Reference Welch1967) to compute power spectral density (PSD) data. Specifically, a Hanning window was applied to segments with a 50 % overlap. The length of each overlapping segment for the ten-second DDAS signals consisting of 1000 000 samples is 16 384, giving a frequency resolution of 6.1 Hz. Concerning the DPSP data, the signal consists of 10 000 samples and the length of each segment is either 500 or 1000, depending on the frame rate, resulting in a frequency resolution of 4 Hz. Cross-spectral density (CSD) was also estimated to characterise the pressure propagation along the shock wave. Considering two continuous signals  $x(t)$ and $y(t)$, the cross-spectrum $S_{xy}(f)$ is defined from the cross-correlation (or convolution) of the signals. The statistical relation between the signals can be measured from the coherence,
 $$\begin{eqnarray}C_{xy}(f)=\frac{|S_{xy}(f)|^{2}}{S_{xx}(f)S_{yy}(f)},\end{eqnarray}$$
 where  $S_{xx}(f)$ and $S_{yy}(f)$ denote the PSD estimates of the signals computed using Welch’s method. The phase angle between the signals is,
 $$\begin{eqnarray}\unicode[STIX]{x1D719}_{xy}(f)=\arctan \left(\frac{\text{Re}\{S_{xy}(f)\}}{\text{Im}\{S_{xy}(f)\}}\right).\end{eqnarray}$$
 The cross-spectra of the pressure signals are particularly useful as a tool to identify frequency bands at which the signals have high coherence, indicating convective phenomena (Dandois Reference Dandois2016). Furthermore, the convection velocity  $U_{c}$ of such phenomena can be computed from the phase angle variation with distance at a particular frequency,
 $$\begin{eqnarray}U_{c}=2\unicode[STIX]{x03C0}f\frac{\unicode[STIX]{x0394}s}{\unicode[STIX]{x0394}\unicode[STIX]{x1D719}},\end{eqnarray}$$
 where  $f$ denotes the frequency, $\unicode[STIX]{x0394}s$ represents the physical distance between the sensors and $\unicode[STIX]{x0394}\unicode[STIX]{x1D719}$ is the phase shift from (3.2). Alternatively, the convection velocity can also be computed between two discrete sensors for a range of frequencies,
 $$\begin{eqnarray}U_{c}=2\unicode[STIX]{x03C0}\unicode[STIX]{x0394}s\frac{\unicode[STIX]{x0394}f}{\unicode[STIX]{x0394}\unicode[STIX]{x1D719}}.\end{eqnarray}$$
3.3 Modal decomposition and application to dynamic pressure-sensitive paint data
DPSP datasets analysed herein are essentially extensive sets of time-resolved static pressure measurements from a planform point of view, whereby each image pixel effectively becomes an unsteady pressure sensor. Visual inspection of the DPSP images reveals perturbations along and downstream of the shock. This is expected at these transonic flow conditions, at which the flow exhibits complex behaviour and constitutes unsteady flow structures with various spatial and temporal scales. It can be anticipated that such flow features can be extracted through some mathematical technique, or modal decomposition, whereby the dataset is decomposed into a set of dominant modes. As advanced experimental and numerical techniques are generating increasingly large volumes of high-fidelity datasets which can be challenging to post-process, modal decomposition and analysis has become widespread in the fluid dynamics community (Taira et al. Reference Taira, Brunton, Dawson, Rowley, Colonius, McKeon, Schmidt, Stanislav, Theofilis and Ukeiley2017).
These techniques, often termed data-based when applied to flow-field data, can extract and characterise physically important features aiding the elucidation of the flow physics. The resulting modes represent the spatial structures of the flow, while the associated characteristic values can either denote the temporal content, energy levels, or growth/decay rates, depending on the chosen method. Two prominent data-based modal decomposition techniques are proper orthogonal decomposition (POD) and dynamic mode decomposition (DMD), outlined briefly in the following.
3.3.1 Proper orthogonal decomposition
Proper orthogonal decomposition gives a set of orthogonal modes that are ranked by their contribution in optimising the variance of the input dataset in a least squares sense. While this procedure is known by a variety of names across different fields, the key idea is to represent the dataset by a minimum number of modes which capture the maximum amount of fluctuation. This technique is extensively applied to fluid flows and was first used to extract coherent structures from a turbulent flow field (Lumley Reference Lumley, Yaglom and Tatarsky1967). The interested reader is referred to the reviews by Berkooz, Holmes & Lumley (Reference Berkooz, Holmes and Lumley1993) and Taira et al. (Reference Taira, Brunton, Dawson, Rowley, Colonius, McKeon, Schmidt, Stanislav, Theofilis and Ukeiley2017) that describe its application to fluid flows and its connection to other methods. A brief formulation follows.
Consider an input dataset generalised by a set of vectors  $\{\boldsymbol{x}_{i}\in V\}$, where $V$ is the vector space and $\boldsymbol{x}_{i}$ represents an input vector of length $n$ at each instance in time (for $i=1,\ldots ,m$). For this dataset consisting of $m$ snapshots each having $n$ spatial points, where $m\ll n$, the POD procedure minimises the error of a projection $\boldsymbol{P}_{r}$ of rank $r$,
$r$,
 $$\begin{eqnarray}\text{error}=\mathop{\sum }_{i=1}^{m}\Vert \boldsymbol{x}_{i}-\boldsymbol{P}_{r}\boldsymbol{x}_{i}\Vert ^{2},\end{eqnarray}$$
 where the operator  $\Vert \boldsymbol{\cdot }\Vert$ denotes the induced norm from the inner product $\langle \boldsymbol{\cdot },\boldsymbol{\cdot }\rangle$ on $V$. This projection can now be formulated as,
 $$\begin{eqnarray}\boldsymbol{P}_{r}\boldsymbol{x}_{i}=\mathop{\sum }_{j=1}^{r}\langle \unicode[STIX]{x1D753}_{j},\boldsymbol{x}_{i}\rangle \unicode[STIX]{x1D753}_{j},\end{eqnarray}$$
 where the projection onto  $\unicode[STIX]{x1D753}_{j}\in V$, which is the orthonormal basis of rank $r$ (for $j=1,\ldots ,r$), minimises the error defined by (3.5). Each vector in this basis is a POD mode which can be computed via different algorithms.
High-fidelity datasets usually have a large number of spatial points, such that a matrix eigenvalue problem of size  $n\times n$ becomes restrictive. Here we use the method of snapshots (Sirovich Reference Sirovich1987) which gives rise to a much smaller eigenvalue problem of size $m\times m$. However, it is important to have a sufficient number of snapshots such that fluctuations of the flow features of interest are well resolved in time. We use the parallelised modred library, developed by Belson, Tu & Rowley (Reference Belson, Tu and Rowley2014), for this task. We employ the vector-space approach, where the snapshots are treated as vectors and are not stacked into a large input data matrix. This enables the computation of all the modes from the whole dataset, as we are not constrained by storing large matrices in computer memory. In this algorithm, inner products to form an $m\times m$ correlation matrix, $\unicode[STIX]{x1D643}$, are solved individually, using $[\unicode[STIX]{x1D643}]_{i,j}=\langle \boldsymbol{x}_{i},\boldsymbol{x}_{j}\rangle$.
After solving the eigenvalue problem,
 $$\begin{eqnarray}\unicode[STIX]{x1D643}\unicode[STIX]{x1D650}=\unicode[STIX]{x1D650}\unicode[STIX]{x1D726},\end{eqnarray}$$
 the eigenvectors contained in the orthogonal matrix  $\unicode[STIX]{x1D650}$ are sorted in descending order, based on the corresponding eigenvalues $\unicode[STIX]{x1D706}_{j}$ contained in the diagonal matrix $\unicode[STIX]{x1D726}$. A truncated matrix $\unicode[STIX]{x1D64F}$ is computed from the desired number of modes, $r$, using
 $$\begin{eqnarray}\unicode[STIX]{x1D64F}=\unicode[STIX]{x1D650}_{r}\unicode[STIX]{x1D726}_{r}^{-1/2},\end{eqnarray}$$
 where  $\unicode[STIX]{x1D650}_{r}$ and $\unicode[STIX]{x1D726}_{r}$ are submatrices of $\unicode[STIX]{x1D650}$ and $\unicode[STIX]{x1D726}$, respectively. The modes $\unicode[STIX]{x1D753}_{j}$ are constructed individually, eliminating the need to store a large matrix containing all the modes,
 $$\begin{eqnarray}\unicode[STIX]{x1D753}_{j}=\mathop{\sum }_{i=1}^{m}\boldsymbol{x}_{i}[\unicode[STIX]{x1D64F}]_{i,j}.\end{eqnarray}$$
It should be noted that the temporal mean of the input vectors is subtracted from the snapshots, such that the decomposition is performed on the unsteady component only.
3.3.2 Dynamic mode decomposition
Dynamic mode decomposition is a more recent technique that provides modes which are not necessarily orthogonal, but have a single characteristic frequency and growth/decay rate. This contrasts with POD in which orthogonal modes comprise various time scales. Dynamic mode decomposition enables the analysis of dynamical features and can also be applied when the dynamics are nonlinear, whereby structures lying on an attractor and oscillating at particular frequencies can be extracted (Tu et al. Reference Tu, Rowley, Luchtenburg, Brunton and Kutz2014). This modal method is purely data-based, rooted in linear algebra, and relies on the eigendecomposition of a best-fit linear operator that approximates the dynamics present in the data (Taira et al. Reference Taira, Brunton, Dawson, Rowley, Colonius, McKeon, Schmidt, Stanislav, Theofilis and Ukeiley2017).
Whilst the input vectors are collected in the same way as for POD, in the standard DMD algorithm introduced by Schmid (Reference Schmid2010) the snapshots are arranged into separate matrices  $\unicode[STIX]{x1D653}_{1}$ and $\unicode[STIX]{x1D653}_{2}$ which are shifted in time, where,
 $$\begin{eqnarray}\unicode[STIX]{x1D653}_{1}=[\boldsymbol{x}_{1},\ldots ,\boldsymbol{x}_{m-1}]\in \text{Re}^{n\times m-1}\quad \text{and}\quad \unicode[STIX]{x1D653}_{2}=[\boldsymbol{x}_{2},\ldots ,\boldsymbol{x}_{m}]\in \text{Re}^{n\times m-1}.\end{eqnarray}$$
 It is assumed that each snapshot in time,  $\boldsymbol{x}_{i}$, is linked to the next snapshot, $\boldsymbol{x}_{i+1}$, via a linear mapping $\boldsymbol{A}$, and, if the data is dynamically nonlinear, $\boldsymbol{A}$ represents an operator which approximates these dynamics, such that,
 $$\begin{eqnarray}\unicode[STIX]{x1D653}_{2}=\boldsymbol{A}\unicode[STIX]{x1D653}_{1}.\end{eqnarray}$$
 Rather than computing the eigendecomposition of  $\boldsymbol{A}$ explicitly, which is computationally expensive since $n\gg m$, a number of algorithms can be used to compute the DMD modes and eigenvalues as discussed by Tu et al. (Reference Tu, Rowley, Luchtenburg, Brunton and Kutz2014). The spatial structures are contained in the DMD modes $\unicode[STIX]{x1D753}_{j}$ (for $j=1,\ldots ,m-1$) which oscillate and/or grow/decay at characteristic values defined by the DMD eigenvalues $\unicode[STIX]{x1D706}_{j}$. The resulting DMD eigenvalues can be mapped logarithmically as,
 $$\begin{eqnarray}\unicode[STIX]{x1D714}_{j}=\frac{\ln (\unicode[STIX]{x1D706}_{j})}{2\unicode[STIX]{x03C0}\unicode[STIX]{x0394}t},\end{eqnarray}$$
 where  $\unicode[STIX]{x0394}t$ denotes the time step between successive snapshots, equivalent to the reciprocal of the sampling frequency $f_{s}$. The corresponding frequency of oscillation, $f_{j}$, and growth/decay rate, $\unicode[STIX]{x1D70E}_{j}$, can be obtained from the real and imaginary components,
 $$\begin{eqnarray}\unicode[STIX]{x1D70E}_{j}=\text{Re}\{\unicode[STIX]{x1D714}_{j}\}\quad \text{and}\quad f_{j}=\text{Im}\{\unicode[STIX]{x1D714}_{j}\}.\end{eqnarray}$$
 The contribution of each DMD mode  $\unicode[STIX]{x1D753}_{j}$ to the original snapshots can be inferred by reconstructing the flow field from a chosen number, $r$, of DMD modes,
 $$\begin{eqnarray}\boldsymbol{x}_{i}=\mathop{\sum }_{j=1}^{r}d_{i,j}\unicode[STIX]{x1D753}_{j},\end{eqnarray}$$
 where  $d_{i,j}$ represents the scalar coefficient used for the reconstruction. Those coefficients projecting each snapshot onto the modes can be computed either via a least squares projection onto projected DMD modes or from a biorthogonal projection using adjoint DMD modes (see Tu et al. Reference Tu, Rowley, Luchtenburg, Brunton and Kutz2014). For linearly consistent snapshots, the projection coefficients encode the time evolution, useful to identify dynamically relevant modes.
Since the introduction of the standard DMD method, a number of modifications and extensions have been developed. Here, we use a low-memory variant of the exact DMD algorithm (Tu et al. Reference Tu, Rowley, Luchtenburg, Brunton and Kutz2014), that uses a vector-space approach and is implemented in the same modred library, as used for POD analysis and described by Belson et al. (Reference Belson, Tu and Rowley2014).
4 Experimental buffet onset indication
A variety of indicators have been devised over the years to define buffet onset in a wind tunnel environment (see ESDU 1987). Generally, these criteria rely on the assumption that sufficiently significant flow separation causes a deviation from a linear low-incidence trend where the flow remains attached. Aerodynamic indicators, which are also applicable to numerical data, include trailing-edge pressure divergence, lift-curve slope reduction, and breaks in the pitching moment and axial force variation with incidence. Experimentally, the structural response can be directly measured from strain gauges and accelerometers. Lawson et al. (Reference Lawson, Greenwell and Quinn2016) scrutinised several of these criteria using static and dynamic data for the RBC12 half-model. Good agreement between the strain gauge and accelerometer divergence, which mainly respond to wing bending, and aerodynamic indicators based on trailing-edge pressure divergence at 80 % semi-span and lift-curve slope reduction was reported. The criteria based on axial force and pitching moment were less reliable. It should be noted that the local criterion based on trailing-edge pressure divergence requires separation to first occur at the trailing edge and, in the case of a finite wing, is sensitive to the choice of spanwise location. Furthermore, the lift-curve slope reduction method relies on the definition of the linear slope and its offset from an inherently nonlinear behaviour even in attached transonic flow conditions.
It can be hypothesised that the location where flow separation first occurs and its spanwise extent varies with Mach number. Therefore, in order to allow an investigation across a range of flow conditions, a global criterion based on the structural response is preferred, such as the strain-gauge signal. Since the strain gauge responds primarily to wing bending, this defines the onset of structural buffeting, even though it is commonly referred to as a shock buffet onset indicator. It should be emphasised that the shock can exhibit unsteadiness before an indicated break from a linear trend, rendering an unequivocal definition of shock buffet onset quite intricate. Whilst a buffeting coefficient from strain-gauge data is typically corrected to enable comparative studies between different wind tunnels and models (Jones Reference Jones1971; Mabey Reference Mabey1971; Balakrishna & Acheson Reference Balakrishna and Acheson2011), the strain-gauge response can also be used as an absolute measure. Herein, the structural buffeting onset is defined from the dimensional buffeting coefficient,  $C_{B}$. This was computed in the time domain from the root mean square of the ten-second, unfiltered strain-gauge signal (in volts), normalised by dynamic pressure. Anti-aliasing of the DDAS signals was achieved digitally via a sigma-delta type analogue-to-digital converter by means of over-sampling, rather than through analogue filtering.
Figure 3 depicts  $C_{B}$ as a function of angle of attack for a range of Mach numbers. Both fine-pitch runs with DDAS and data points having DPSP acquisition are presented. Throughout the Mach number range, a similar response prior to the onset of buffeting is observed due to the wind tunnel background unsteadiness. As the angle of attack is further increased, a sharp rise in $C_{B}$ indicates buffeting onset. This holds true especially at the lower Mach numbers ( $M\leqslant 0.80$), at which $\unicode[STIX]{x1D6FC}_{b}$ can be defined to within $\pm 0.05^{\circ }$ from the fine-pitch runs. However, at the higher Mach numbers, $M=0.82$ and 0.84, identifying a clear buffet-onset incidence is more difficult since the divergence is more gradual. For this reason, the reference buffet-onset angles, summarised in table 1, were taken as the crossover points between linear trends computed at low incidence and during the initial rise in buffeting magnitude. It should be noted that while the figure shows unfiltered data, the same onset point is found from the strain-gauge signal filtered at the first wing-bending frequency. This is expected since the first wing-bending response dominates the strain-gauge output of such a steel model with low structural damping.
Dimensional buffeting coefficient over angle of attack for a range of Mach numbers: open symbols represent fine-pitch runs with DDAS, filled symbols denote coarser-pitch runs that also include DPSP acquisition.

5 Results and analysis
Transonic shock buffet is an inherently unsteady phenomenon which merits a detailed dynamic analysis. Whilst data from static pressure taps can be potentially used to infer flow-field features and the type of flow separation, as described in § 5.1, insight into the complex shock motion that characterises swept-wing buffet is not possible. This section elucidates the unsteady characteristics around buffet onset from multiple dynamic instrumentation outputs. A traditional analysis based on unsteady pressure transducers is presented in § 5.2 describing the frequency spectra of the shock unsteadiness and the shock buffet phenomenon. In § 5.3, this is compared with flow-field visualisations obtained from the standard deviation of DPSP surface pressure, linking particular flow features with structural buffeting onset. Then, a POD analysis of the DPSP data describing the spatio-temporal nature of the three-dimensional shock structure is presented in § 5.4. Lastly, the shock motion is studied by means of a cross-spectrum analysis in § 5.5 and a DMD analysis in § 5.6 in order to characterise pressure propagation along the shock. In addition to corroborating the observations from the other methods employed, the DMD analysis isolates the two key flow phenomena put forward herein. The data presented is at  $M=0.80$ unless otherwise stated.
5.1 Surface pressure flow features
Time-averaged static pressure on the suction surface at  $M=0.80$ in Pascal: (a) $\unicode[STIX]{x1D6FC}=2.5^{\circ }$, (b) $\unicode[STIX]{x1D6FC}_{b}=2.7^{\circ }$, (c) $\unicode[STIX]{x1D6FC}=2.9^{\circ }$, (d) $\unicode[STIX]{x1D6FC}=3.3^{\circ }$ and (e–h) show the magnified outboard section corresponding to (a–d), respectively.

Static pressure distributions at two outboard spanwise stations around structural buffeting onset at three angles of attack and  $M=0.80$: (a) $\unicode[STIX]{x1D702}=0.73$ and (b) $\unicode[STIX]{x1D702}=0.93$.

The time-averaged static pressure on the suction surface from the DPSP data at four angles of attack, representing conditions pre and post buffet onset at  $M=0.80$, is shown in figure 4. Figure 4(e–h) magnifies the outboard region of the wing whereby a close inspection of the shock location, relative to the unsteady pressure transducers (visible as small circles), reveals how the shock starts to move upstream with angle of attack as a locally separated region forms on the outboard section of the wing between $\unicode[STIX]{x1D6FC}=2.7^{\circ }$ and $2.9^{\circ }$. This corresponds to the rise in buffeting levels in figure 3. The separation region between $\unicode[STIX]{x1D702}\approx 0.7$ and 0.9 becomes clearer at a higher angle of attack, $\unicode[STIX]{x1D6FC}=3.3^{\circ }$, at which the shock has moved furthest upstream. This is more evident from the unsteady analysis in § 5.3. Pressure distributions obtained from pressure taps at two spanwise stations on the suction and pressure surfaces and three angles of attack are depicted in figure 5 to clarify the formation of the separation region and to infer the main surface flow features. The analysis of the pressure coefficient, $C_{P}$, distribution at $\unicode[STIX]{x1D702}=0.73$ in figure 5(a) reveals that while suction levels in the supersonic region continue to increase with angle of attack, the shock-induced separation bubble merges with the trailing-edge separation at $\unicode[STIX]{x1D6FC}=2.9^{\circ }$. This insight is based on pressure levels downstream of the shock, which vary with angle of attack and an associated upstream shock movement. The separation region that forms beyond $\unicode[STIX]{x1D6FC}=2.9^{\circ }$ is limited in terms of its spanwise extent and does not reach the wing tip. This is highlighted by the pressure distribution further outboard at $\unicode[STIX]{x1D702}=0.93$ in figure 5(b). Whilst the shock bubble is more pronounced at higher angle of attack (between $x/c=0.48$ and 0.60), pressure remains constant with angle of attack at $x/c=0.60$ and 0.80, contrasting with the distribution at $\unicode[STIX]{x1D702}=0.73$. This shows that the flow tends to reattach between the shock-induced separation bubble and the trailing edge at $\unicode[STIX]{x1D702}=0.93$, where the effective angle of attack is lower due to the twisted wing.
5.2 Unsteady pressure transducers analysis
Starting with the chordwise frequency spectra obtained from the unsteady pressure transducers on the suction surface detailed in § 2.2, figure 6 shows the PSD data at  $\unicode[STIX]{x1D702}=0.80$ and five chordwise positions around structural buffeting onset, specifically at $\unicode[STIX]{x1D6FC}_{b}=2.7^{\circ }$ and $\unicode[STIX]{x1D6FC}=2.9^{\circ }$. The signal at chordwise station $x/c=0.51$ has the highest magnitude, indicating close proximity to the shock perturbations, and is characterised by a broadband signature between 50 and 140 Hz ( $0.05\leqslant St\leqslant 0.14$). The peak at 160 Hz corresponds to the wind tunnel fan-passing frequency at this Mach number and is pronounced owing to its periodicity. At $\unicode[STIX]{x1D6FC}_{b}=2.7^{\circ }$, the two transducers furthest upstream in the supersonic region give very low magnitudes. In contrast, both transducers downstream of the shock, at $x/c=0.80$ and close to the trailing edge, indicate elevated fluctuations. With a slight increase in angle of attack to $\unicode[STIX]{x1D6FC}=2.9^{\circ }$, these two transducers measure higher energy levels at lower frequencies, centred around 70 Hz ( $St=0.07$), corresponding to the peak of the shock-unsteadiness bump. This is indicative of shock-induced separation, which extends to the trailing edge at this particular spanwise station. As a result, the shock moves upstream with increased angle of attack (sometimes called inverse shock motion) reaching the transducer at $x/c=0.43$. This observation is corroborated by the data from static pressure taps presented in § 5.1.
Chordwise PSD data at  $\unicode[STIX]{x1D702}=0.80$ for two angles of attack around structural buffeting onset at $M=0.80$: (a) $\unicode[STIX]{x1D6FC}_{b}=2.7^{\circ }$ and (b) $\unicode[STIX]{x1D6FC}=2.9^{\circ }$. The vertical lines denote the structural frequencies of the model.

Spanwise PSD data approximately along shock for two angles of attack at  $M=0.80$: (a) $\unicode[STIX]{x1D6FC}_{b}=2.7^{\circ }$ and (b) $\unicode[STIX]{x1D6FC}=3.3^{\circ }$. Note the tenfold increase of PSD values.

To investigate whether the spectral content of the shock unsteadiness varies with span, the chordwise PSD data were computed at every spanwise station equipped with unsteady transducers, and those showing the highest energy levels were selected as being closest to the shock. The frequency content at buffeting onset is similar between  $\unicode[STIX]{x1D702}=0.77$ and 0.91, as shown in figure 7(a), with the main peak centred around 70 Hz ( $St=0.07$). However, going half a degree above the structural buffeting onset ( $\unicode[STIX]{x1D6FC}=3.3^{\circ }$), the prominent frequency shifts to around 110 Hz at the outboard stations ( $\unicode[STIX]{x1D702}=0.88$ and 0.91), as depicted in figure 7(b) (this shift is consistent when varying the block size of the PSD computation). The shock has moved further upstream at each spanwise station and the PSD levels have increased significantly by an order of magnitude. Furthermore, higher-frequency fluctuations between 200 and 500 Hz ( $0.2\leqslant St\leqslant 0.5$) become apparent, especially near the tip, which are in the range of frequencies associated with fully established swept-wing shock buffet (Dandois Reference Dandois2016; Koike et al. Reference Koike, Ueno, Nakakita and Hashimoto2016).
When quoting Strouhal numbers for such a tapered wing, care should be taken due to the large variation in the local chord length along the span. While MAC (0.2789 m) is a useful reference length, the local chord varies between  $c=0.173$ m and 0.126 m for spanwise stations between $\unicode[STIX]{x1D702}=0.77$ and 0.91, with the latter value being less than half the MAC. Consequently, the shift of the prominent peak from 70 Hz to 110 Hz within the shock-unsteadiness bump results in the same local Strouhal number of 0.05 at each respective station. Although this value is typically associated with aerofoil buffet, the mechanism for the shock unsteadiness on wings is not merely an acoustic feedback mechanism governed by the chordwise distance to the trailing edge, since the shock unsteadiness has a similar signature along the span for the range of flow conditions analysed, whereby the distance between the shock foot and the trailing edge is changing.
Spanwise PSD data downstream of shock at  $x/c=0.80$ around structural buffeting onset at $M=0.80$: (a) $\unicode[STIX]{x1D6FC}_{b}=2.7^{\circ }$ and (b) $\unicode[STIX]{x1D6FC}=2.9^{\circ }$.

Shifting the focus further downstream, figure 8 shows the PSD data at 80 % local chord between  $\unicode[STIX]{x1D702}=0.63$ and 0.84 around the onset of structural buffeting, specifically at $\unicode[STIX]{x1D6FC}_{b}=2.7^{\circ }$ and $\unicode[STIX]{x1D6FC}=2.9^{\circ }$. The transducers located at the outboard sections between $\unicode[STIX]{x1D702}=0.77$ and 0.84 have higher energy levels at $\unicode[STIX]{x1D6FC}=2.9^{\circ }$ with broadband spectral content centred around 70 Hz. In contrast, the spectra further inboard are similar for both incidences. This implies that the increased buffeting level registered by the strain gauge at $\unicode[STIX]{x1D6FC}=2.9^{\circ }$, shown in figure 3, can be attributed to a shock-induced separated region located on the outboard section of the wing. Surface pressure fluctuations in this region at onset have frequencies corresponding to the low-frequency shock unsteadiness. Recall that the peak at 160 Hz is the wind tunnel fan-passing frequency while the peaks at 50 and 250 Hz are related to the power supply, the latter becoming only visible at low PSD levels.
These observations highlight the existence of distinct phenomena across particular frequency bands. First, low-frequency shock unsteadiness centred at  $St=0.07$, based on MAC, is present even at pre-onset conditions as shown in the following section. Reaching buffeting onset, the stronger shock causes the shock-induced separation to merge with the trailing-edge separation between particular spanwise stations confined outboard, such that a broader unsteady region exhibits more intense fluctuations. Second, with a further increase in incidence, higher-frequency oscillations between $0.2\leqslant St\leqslant 0.5$, attributed to the shock buffet instability, become more dominant near the wing tip.
5.3 Surface pressure unsteadiness from dynamic pressure-sensitive paint
A unique aspect of this experimental dataset is the large number of flow conditions with DPSP measurements, whereby its spatio-temporal resolution enables a detailed unsteady analysis that is not limited to discrete points. The standard deviation of pressure,  $\unicode[STIX]{x1D70E}$, was computed on a pixel-by-pixel basis, to assess the level of flow unsteadiness. Figure 9(a–f) presents the standard deviation for a number of incidence angles, ranging from well below buffet onset to beyond onset. The highest levels of unsteadiness are confined to the shock foot, which is already unsteady at pre-onset conditions. As the incidence is increased, the shock progresses downstream and becomes stronger. The shock-induced separation rapidly extends to the trailing edge at $\unicode[STIX]{x1D6FC}_{b}$, causing a localised region of incipient separation on the outboard section of the wing, visualised by elevated $\unicode[STIX]{x1D70E}$ values. Consequently, the shock moves upstream and oscillates over larger chordwise extents. It should be noted that the high values of $\unicode[STIX]{x1D70E}$ inboard of the crank ( $\unicode[STIX]{x1D702}<0.35$) are an artefact of the experimental set-up, due to lower illumination levels, and have no physical meaning.
Standard deviation of DPSP static pressure in Pascal at  $M=0.80$: (a) $\unicode[STIX]{x1D6FC}=1.6^{\circ }$, (b) $\unicode[STIX]{x1D6FC}=2.5^{\circ }$, (c) $\unicode[STIX]{x1D6FC}_{b}=2.7^{\circ }$, (d) $\unicode[STIX]{x1D6FC}=2.9^{\circ }$, (e) $\unicode[STIX]{x1D6FC}=3.1^{\circ }$ and (f) $\unicode[STIX]{x1D6FC}=3.3^{\circ }$. Relative standard deviation between pairs of $\unicode[STIX]{x1D6FC}$: (g) $\unicode[STIX]{x1D70E}_{\unicode[STIX]{x1D6FC}_{b}=2.7^{\circ }}-\unicode[STIX]{x1D70E}_{\unicode[STIX]{x1D6FC}=2.5^{\circ }}$ and (h) $\unicode[STIX]{x1D70E}_{\unicode[STIX]{x1D6FC}=2.9^{\circ }}-\unicode[STIX]{x1D70E}_{\unicode[STIX]{x1D6FC}_{b}=2.7^{\circ }}$.

The localised separation is more evident from the relative standard deviation between two incidence angles. Figure 9(g,h) depicts how the standard deviation of pressure is changing between selected pairs of incidence angles – the first corresponding to two angles of attack at  $\unicode[STIX]{x1D6FC}_{b}$ and just below, the second through the initial rise in buffeting levels. In figure 9(g), there are signs of increased unsteadiness near the trailing edge and the shock starts to move upstream with incidence (the downstream position of the shock shows lower values of $\unicode[STIX]{x1D70E}$). Then, in figure 9(h), the separated region on the outboard section of the wing becomes clear and manifests itself as a region of increased $\unicode[STIX]{x1D70E}$. Along this spanwise region, the shock has shifted upstream (higher values of $\unicode[STIX]{x1D70E}$), whereas further inboard, where the flow remains attached, the shock moves downstream at the higher angle of attack, resulting in an S-shaped curvature of the shock position from a planform point of view. This coincides with the increased structural response measured by the strain gauge in figure 3. Furthermore, the unsteady pressure transducers which showed higher PSD levels in figure 8 are within the region of localised separation (the transducers at $x/c=0.80$ and $\unicode[STIX]{x1D702}=0.84$, 0.80 and 0.77). The transducers further inboard at $\unicode[STIX]{x1D702}=0.70$ and 0.63, situated outside of this region, are located in areas with almost zero relative $\unicode[STIX]{x1D70E}$, corroborating the unchanged PSD data between these angles of attack.
5.4 Modal analysis – proper orthogonal decomposition
While the standard deviation is useful in terms of visualising the overall level of unsteadiness, it cannot provide information regarding the time history or frequency content of the unsteadiness. Therefore, a modal analysis of the surface pressure data was performed to provide a spatio-temporal representation of the flow dynamics. Proper orthogonal decomposition was applied to the mean-subtracted DPSP pressure snapshots to extract the dominant flow features. A large number of snapshots,  $m=10\,000$, comprising 5 s of flow at $M=0.80$ (filmed at 2000 f.p.s.) and 2.5 s for the other Mach numbers (filmed at 4000 f.p.s.), were used such that the principal dynamics are well resolved in time. A total of 20 000 snapshots are available for each flow condition, however, setting $m=10\,000$ was deemed sufficient after investigating the impact of sample size. Using the first 10 000 snapshots, the second 10 000 or all 20 000 gave the same modes suggesting statistical convergence. In contrast, different sets of 1000 snapshots each resulted in a dominant mode with contributions from both the structural response of the model and the shock unsteadiness, rather than well defined modes that result from 10 000 snapshots.
Around the onset of structural buffeting, dominant POD modes are related to either the structural response of the model or the shock unsteadiness along the span. Image alignment accounting for small model and camera movements during preprocessing yields a registration error with strong gradients around the surface features, such as model edges and instrumentation. Since it is present in all images, this is extracted as a strong energetic feature and consequently appears as the model’s structural response in the first or second POD mode (Crafton et al. Reference Crafton, Gregory, Sellers and Ruyten2017). Other dominant modes capture the shock unsteadiness, being the main aerodynamic feature with large static pressure gradients over extensive spatial areas. This is a travelling structure and is hence found in several modes. Furthermore, less dominant, higher-order modes are related to smaller-scale perturbations within the shock region and fluctuations in the flow downstream. Typically, from a set of 10 000 modes, tens are related to these features. However, such flow features have a small contribution to the overall flow field since the POD energy rapidly decays after the first few dominant modes. Moreover, thousands of lower energy modes increasingly become contaminated by incoherent camera noise and show no obvious relation to the aerodynamics. This can be seen in figure 10 which depicts the POD energy distribution at  $M=0.80$ and two angles of attack. The change in slope after approximately 100 modes corresponds to the onset of modes with incoherent noise.
Energy distribution of POD modes at  $M=0.80$.

Dominant POD modes obtained at  $\unicode[STIX]{x1D6FC}=2.9^{\circ }$ are shown in figure 11, depicting the spatial amplitudes representing fluctuations around the mean pressure, while the corresponding eigenvalues from (3.7) are given in table 2 and shown in figure 10. These were normalised by their sum, representing their relative energy,
 $$\begin{eqnarray}\widetilde{\unicode[STIX]{x1D706}}_{j}=\frac{\unicode[STIX]{x1D706}_{j}}{\displaystyle \mathop{\sum }_{k=1}^{m}\unicode[STIX]{x1D706}_{k}}.\end{eqnarray}$$
Spatial component of first eight POD modes at  $M=0.80$ and $\unicode[STIX]{x1D6FC}=2.9^{\circ }$. The spatial amplitudes are coloured from blue to red, representing opposite signs ( $-0.01$ to 0.01); modes 1 to 8 are denoted by (a–h).

Eigenvalues corresponding to the first eight POD modes at  $M=0.80$ and $\unicode[STIX]{x1D6FC}=2.9^{\circ }$.

Considering the first eight modes, half are dominated by the structural response while the remaining modes capture the shock unsteadiness, as confirmed from a PSD of the temporal coefficients, presented in figure 12. Modes related to the structural response have peaks at the first wing-bending frequency and higher-frequency predominantly bending modes, summarised in § 2.1. The lower-frequency peak at 20 Hz is present in modes showing contribution at the leading and trailing edges of the model and is possibly related to wind tunnel wall vibration, to which the cameras are mounted. Modes 2 and 4, in figures 11(b) and 11(d), have the greatest contribution along the spanwise shock unsteadiness, and the spatial amplitudes of mode 2 invert sign at around  $\unicode[STIX]{x1D702}=0.65$. This is reminiscent of the relative standard deviation around buffeting onset, shown in figure 9(h), and corroborates the flow physics described in § 5.3. An instantaneous pressure snapshot based on this mode, when scaled by a negative temporal coefficient, has a positive pressure fluctuation between $\unicode[STIX]{x1D702}=0.65$ and the wing tip (i.e. the shock is upstream of its mean location), accompanied by a lower pressure near the trailing edge, indicative of shock-induced rear separation. Further inboard, the shock is downstream of its mean position and the flow remains attached. The opposite can be said for a positive temporal coefficient, that is, the shock is downstream outboard and upstream inboard. Hence, such a mode represents an S-shaped spanwise shock curvature that exhibits broadband, low-frequency oscillations, peaking at around 70 Hz, depicted in figure 12(b). Mode 5 represents particular instances where the shock either sits at its forwardmost or aft positions along the whole span. Higher spatial amplitudes near the tip in figure 11(e) and a shift to higher-frequency content centred at 110 Hz in figure 12(b) support the unsteady transducer analysis at a post-onset flow condition in § 5.2. Figure 11(g) depicting mode 7 shows a pressure disturbance along the shock and over the entire wing. The corresponding prominent peak at 160 Hz corresponds to the wind tunnel fan-passing frequency. Lower-frequency behaviour at 10 Hz might be induced by wind tunnel unsteadiness but there is presently no complete understanding of the exact source.
PSD of temporal coefficients for the first eight POD modes at  $M=0.80$ and $\unicode[STIX]{x1D6FC}=2.9^{\circ }$; modes related to (a) structural response and (b) shock unsteadiness.

The physical contribution of aerodynamically relevant POD modes can be visualised by reconstructing the surface pressure using specific modes and their corresponding eigenvalues and temporal coefficients, in this case, modes 2, 4 and 5 – the three dominant modes correlated to the shock unsteadiness. Figure 13 shows a sequence of instantaneous snapshots starting at  $t=0.0175$ s, both reconstructed and original snapshots, coloured by the pressure deviation from the mean flow. Initially, the shock sits downstream of its mean position between $\unicode[STIX]{x1D702}=0.75$ and 0.90 in figures 13(a) and 13(e). This outboard perturbation propagates both towards the tip and the root, while the location where the shock curves between its upstream and downstream positions continues to move inboard. As the shock adopts a downstream position, a localised region of lower pressure simultaneously propagates downstream towards the trailing edge. By the end of the sequence in figures 13(d) and 13(h), the outboard shock is moving upstream and is close to its mean position. This results in a higher relative velocity with respect to the free stream and subsequent snapshots, not shown in the figure, depict a locally strengthened shock that causes rear separation and a shock-induced separation bubble which convects downstream and merges at the trailing edge. This latter part of the sequence can be seen in a movie available in the online supplementary material at https://doi.org/10.1017/jfm.2019.906. Repeatedly, the flow separates and reattaches over the outboard portion of the wing, locally resulting in shock perturbations which propagate both inboard and outboard at this angle of attack, just above structural buffeting onset.
Instantaneous snapshots at  $M=0.80$ and $\unicode[STIX]{x1D6FC}=2.9^{\circ }$, starting from $t=0.0175$ s in steps of $\unicode[STIX]{x0394}t=0.0015$ s, coloured by static pressure deviation from mean, in Pascal: (a–d) POD reconstructed snapshots using modes 2, 4 and 5 and (e–h) original snapshots.

Spatial component of dominant POD modes at  $M=0.80$ and $\unicode[STIX]{x1D6FC}=3.3^{\circ }$ capturing low-frequency shock unsteadiness and shock buffet. The spatial amplitudes are coloured from blue to red, representing opposite signs ( $-0.01$ to 0.01); modes 1, 3, 4, 7, 8, 9, 11 and 13 are denoted by (a–h). Structure-dominated modes are not shown.

Eigenvalues corresponding to selected POD modes at  $M=0.80$ and $\unicode[STIX]{x1D6FC}=3.3^{\circ }$.

Increasing the angle of attack to  $\unicode[STIX]{x1D6FC}=3.3^{\circ }$, dominant POD modes capture the characteristic low-frequency shock unsteadiness along the span, the structural response, and smaller-scale perturbations confined to the outboard region, attributed to the shock buffet instability. Figure 14 depicts the spatial component of predominantly aerodynamic modes, excluding modes capturing the structural response. The corresponding eigenvalues are presented in table 3 and shown in figure 10 while PSD data of the temporal coefficients are depicted in figure 15. The shock, positioned further upstream and undergoing larger excursions, is evident from a comparison of modes that capture the spanwise shock unsteadiness at both $\unicode[STIX]{x1D6FC}=2.9^{\circ }$ and $3.3^{\circ }$, specifically figure 11(b,d,e,g) and figure 14(a–d). It should be noted that more intense fluctuations related to the S-shaped shock curvature at $\unicode[STIX]{x1D6FC}=3.3^{\circ }$ shift to mode 1, becoming the dominant feature instead of the structural response. Moreover, modes with high spatial amplitudes in the outboard region, such as modes 7, 8, 11 and 13, temporally show broadband, higher-frequency behaviour, above 200 Hz, as depicted in figure 15. This corroborates the unsteady transducer analysis discussed in § 5.2, whereby PSD data at $\unicode[STIX]{x1D6FC}=3.3^{\circ }$ in figure 7 highlighted fluctuations above 200 Hz, which are not evident at $\unicode[STIX]{x1D6FC}=2.9^{\circ }$. These observations support the idea of coexisting phenomena beyond shock buffet onset conditions, namely, low-frequency shock unsteadiness along the whole span centred at 70 Hz, together with higher-frequency oscillations above 200 Hz on the outboard wing. The latter, which have an outboard-running behaviour, are clear from instantaneous pressure snapshots, depicted in figure 16, both from a POD reconstruction using solely the modes shown in figure 14 and the original data. The upstream shock perturbation between $\unicode[STIX]{x1D702}=0.75$ and 0.90 in figure 16(a), characterised by a positive pressure deviation, propagates towards the wing tip in the successive snapshots, each separated by $\unicode[STIX]{x0394}t=0.0005$ s. This smaller time step, compared to figure 13, highlights the higher-frequency behaviour of these outboard-running disturbances. Additionally, the lower-frequency, inboard-running wave elicited at $\unicode[STIX]{x1D6FC}=2.9^{\circ }$ can also be observed at $\unicode[STIX]{x1D6FC}=3.3^{\circ }$, simultaneously travelling towards the root. The location where the shock curves from its upstream to downstream position moves from $\unicode[STIX]{x1D702}=0.75$ in figures 16(a) and 16(e) to $\unicode[STIX]{x1D702}=0.63$ in figures 16(d) and 16(h). The reader is referred to the online material.
PSDoftemporalcoefficientsof selectedPODmodesat $M=0.80$ and $\unicode[STIX]{x1D6FC}=3.3^{\circ }$.

Instantaneous snapshots at  $M=0.80$ and $\unicode[STIX]{x1D6FC}=3.3^{\circ }$, starting from $t=0.045$ s in steps of $\unicode[STIX]{x0394}t=0.0005$ s, coloured by static pressure deviation from mean, in Pascal: (a–d) POD reconstructed snapshots using modes 1, 3, 4, 7, 8, 9, 11 and 13, and (e–h) original snapshots.

Magnitude-squared coherence levels of pressure signals along shock for two angles of attack beyond structural buffeting onset at  $M=0.80$: (a) $\unicode[STIX]{x1D6FC}=2.9^{\circ }$, (b) $\unicode[STIX]{x1D6FC}=3.3^{\circ }$.

5.5 Shock motion analysis
A quantitative assessment of pressure propagation along the shock was conducted via cross-spectrum analysis, motivated by the complex shock motion taking place around shock buffet onset conditions. This approach has previously been used in the shock buffet context to compute propagation speeds from unsteady transducer signals (see for example Dandois (Reference Dandois2016) and Koike et al. (Reference Koike, Ueno, Nakakita and Hashimoto2016)). Herein, CSD data is computed from the DPSP dataset, critically exploiting the much increased spatial coverage of these measurements.
A semi-automated process was devised to acquire pressure signals along the shock. Dominant POD modes related to the aerodynamics were used to reconstruct pressure snapshots with reduced camera noise, facilitating extraction of shock position. The shock position was taken as the chordwise pixel having the highest pressure deviation from the time-averaged value over the longest period of time, at 14 spanwise stations with intervals of  $\unicode[STIX]{x0394}\unicode[STIX]{x1D702}=0.03$. Cross-spectra were computed between each pressure time-series and a reference signal, taken at midspan, from which the magnitude-squared coherence, $C_{xy}(f)$, and the phase angle, $\unicode[STIX]{x1D719}_{xy}(f)$, were determined.
Figure 17 illustrates the coherence levels between signals along the shock at two angles of attack,  $\unicode[STIX]{x1D6FC}=2.9^{\circ }$ and $3.3^{\circ }$. High levels of coherence were obtained within the low-frequency spectral bump, corresponding to the shock unsteadiness. Such cross-correlation between the signals indicates that pressure is propagating along the shock in the spanwise direction. This is evident from the linear phase variation along the shock, depicted in figure 18 at four angles of attack, including a low angle of attack, $\unicode[STIX]{x1D6FC}=1.6^{\circ }$, and three around structural buffeting onset. From (3.3), a positive linear slope indicates a convective phenomenon having a negative convection speed, that is, pressure propagates inboard towards the root (Dandois Reference Dandois2016). This inboard-running wave is present even in attached-flow conditions at $\unicode[STIX]{x1D6FC}=1.6^{\circ }$, before the model starts buffeting due to unsteady flow. The slope is linear between $\unicode[STIX]{x1D702}=0.55$ and 0.90, the same spanwise extent with high unsteadiness along the shock in figure 9(a). This inboard propagation continues to occur with increasing angle of attack and reaches further inboard as the whole shock trace becomes unsteady. However, the slope of the phase variation reverses around structural buffeting onset, beyond $\unicode[STIX]{x1D6FC}_{b}=2.7^{\circ }$, between $\unicode[STIX]{x1D702}=0.87$ and the wing tip, implying outboard propagation. This simultaneous inboard and outboard pressure convection along the shock becomes clear at $\unicode[STIX]{x1D6FC}=2.9^{\circ }$, supporting the observations from instantaneous pressure snapshots in figure 13. The angles of attack at which the slope reverses coincide with increased buffeting levels measured by the strain gauge. Moreover, the spanwise location where the outboard propagation emanates, $\unicode[STIX]{x1D702}=0.87$, corresponds to the outboard region of the localised separation, highlighted in figure 9(h). The two selected frequencies in figure 18 were chosen due to high PSD levels in figure 17. However, it should be noted that similar phase plots were obtained at the frequencies within the low-frequency shock-unsteadiness bump, between 50 and 140 Hz, suggesting the same flow physics.
Phase angle variation along shock at selected frequencies of low-frequency shock unsteadiness at pre- and post-onset conditions at  $M=0.80$: (a) 72 Hz and (b) 80 Hz.

Relative standard deviation around structural buffeting onset (left column) and phase angle variation with span along shock (right column): (a)  $M=0.74$, $\unicode[STIX]{x1D70E}_{\unicode[STIX]{x1D6FC}=4.8^{\circ }}-\unicode[STIX]{x1D70E}_{\unicode[STIX]{x1D6FC}_{b}=4.6^{\circ }}$, (b) $M=0.76$, $\unicode[STIX]{x1D70E}_{\unicode[STIX]{x1D6FC}=4.2^{\circ }}-\unicode[STIX]{x1D70E}_{\unicode[STIX]{x1D6FC}_{b}=4.0^{\circ }}$, (c) $M=0.78$, $\unicode[STIX]{x1D70E}_{\unicode[STIX]{x1D6FC}=3.7^{\circ }}-\unicode[STIX]{x1D70E}_{\unicode[STIX]{x1D6FC}_{b}=3.5^{\circ }}$, (d) $M=0.80$, $\unicode[STIX]{x1D70E}_{\unicode[STIX]{x1D6FC}=2.9^{\circ }}-\unicode[STIX]{x1D70E}_{\unicode[STIX]{x1D6FC}_{b}=2.7^{\circ }}$ and (e) $M=0.82$, $\unicode[STIX]{x1D70E}_{\unicode[STIX]{x1D6FC}=2.0^{\circ }}-\unicode[STIX]{x1D70E}_{\unicode[STIX]{x1D6FC}_{b}=1.8^{\circ }}$. The images are coloured from $-500$ Pa (blue) to $+500$ Pa (red). The phase plots are computed at 80 Hz and denoted by blue triangles pre-onset, black crosses at onset and red circles post-onset.

This spanwise shock motion analysis was extended to all Mach numbers between  $M=0.70$ and 0.84, focussing on the angles of attack around structural buffeting onset. Analysis employing the DPSP data was critical since transducer data along the shock at onset conditions was only possible between $M=0.78$ and 0.82, with the mean shock position being forward of the most upstream transducers at $M=0.76$, and too far aft at $M=0.84$. The key flow phenomena described at $M=0.80$ were observed throughout the Mach number range. Essentially, inboard-running pressure propagation along the shock occurs below onset conditions. As the angle of attack is increased, reaching structural buffeting onset, the direction of propagation is reversed near the outboard position of localised flow separation close to the wing tip. Figure 19 shows the relative standard deviation of surface pressure computed between two angles of attack, at structural buffeting onset and just above, together with the phase angle variation with span at 80 Hz for a number of angles of attack around buffeting onset, throughout the range of Mach numbers from $M=0.74$ to 0.82. The common attribute is the formation of localised flow separation on the outboard wing at each respective $\unicode[STIX]{x1D6FC}_{b}$, which pushes the shock forward, as depicted by elevated unsteadiness levels in red. This region becomes wider at higher Mach number, since the shock-induced separation bubble merges with the trailing-edge separation over a larger spanwise extent, where the local Mach number is highest. This influence of Mach number on the reversed-flow region was also observed numerically for the same wing (Sartor & Timme Reference Sartor and Timme2016). Furthermore, the phase plots reveal that outboard propagation emanates from the outer part of the separated region (denoted by the dashed vertical lines) towards the wing tip, both at onset (black crosses) and post-onset (red circles). The reversal in propagation direction occurs further inboard as the Mach number increases.
Relative standard deviation around structural buffeting onset and phase angle variation computed at 80 Hz along shock at: (a)  $M=0.70$, $\unicode[STIX]{x1D70E}_{\unicode[STIX]{x1D6FC}=5.9^{\circ }}-\unicode[STIX]{x1D70E}_{\unicode[STIX]{x1D6FC}_{b}=5.8^{\circ }}$ and (b) $M=0.84$, $\unicode[STIX]{x1D70E}_{\unicode[STIX]{x1D6FC}=1.1^{\circ }}-\unicode[STIX]{x1D70E}_{\unicode[STIX]{x1D6FC}=0.7^{\circ }}$. The same symbol key of figure 19 is used.

Similar plots are presented in figure 20 at  $M=0.70$ and 0.84, the lowest and highest Mach numbers, respectively, which are characterised by distinct flow topologies. At $M=0.70$, a very steep rise in buffeting levels takes place between $\unicode[STIX]{x1D6FC}=5.8^{\circ }$ and $5.9^{\circ }$, as the shock moves upstream towards the region of forced boundary layer transition. The shock is well forward, even within the laminar region at times, with the strong adverse pressure gradient causing a separation bubble, exacerbated by the shock. Visualisation of pressure snapshots reveals large-scale separated flow structures convecting downstream and toed outboard. The long bubble-type separation, from almost the leading edge up to around mid-chord, is manifested as a region of high unsteadiness in figure 20(a). The pressure distributions presented in figure 21 at two spanwise stations for three angles of attack around buffeting onset corroborate this observation. Considering the pressure distribution at $\unicode[STIX]{x1D6FC}_{b}=5.8^{\circ }$ and $\unicode[STIX]{x1D702}=0.73$, a shock-induced separation bubble forms behind the shock between $x/c=0.32$ and 0.60, indicated by increasing pressure with incidence in figure 21(a). Slightly incrementing the angle of attack to $\unicode[STIX]{x1D6FC}=5.9^{\circ }$, this flow feature becomes more pronounced, while further outboard at $\unicode[STIX]{x1D702}=0.93$, the shock shifts forward and a long bubble-type separation forms from the laminar region, as depicted in figure 21(b). This flow topology is reminiscent of low-speed stall cells, whereby a negative lift-curve slope is required to amplify the spanwise variation of lift (see for example Rodríguez & Theofilis (Reference Rodríguez and Theofilis2011) and Spalart (Reference Spalart2014)). In this case, although the overall lift coefficient is still increasing between these two incidences, a negative sectional lift-curve slope is expected at the outboard sections where the massive separation occurs. A link between buffet cells and stall cells has been reported by Plante, Dandois & Laurendeau (Reference Plante, Dandois and Laurendeau2019). In contrast at $M=0.84$, separation can be observed over a wider spanwise area, with the S-shaped shock curvature occurring further inboard at around $\unicode[STIX]{x1D702}=0.50$. Even though the surface flow topology at $M=0.70$ and 0.84 have contrasting characteristics, the phase angle variation along the shock still reveals an inboard-running shock unsteadiness which reverses direction and propagates outboard from the outer edge of the separated region, as observed at the other Mach numbers between $M=0.74$ and 0.82.
Static pressure distributions at two outboard spanwise stations around structural buffeting onset at  $M=0.70$: (a) $\unicode[STIX]{x1D702}=0.73$, (b) $\unicode[STIX]{x1D702}=0.93$.

Convection speed  $U_{c}$ and wavelength $l$ at $f=80$ Hz for a range of Mach numbers.

The convection speed along the shock was computed from a linear fit of the phase angle variation with span, using (3.3). The results at various Mach numbers are summarised in table 4, whereby  $U_{\infty }$ denotes the free stream velocity and $U_{c}$ is computed at $f=80$ Hz ( $St\approx 0.09$), between $\unicode[STIX]{x1D702}=0.51$ and just inboard of the location where the slope reverses. This frequency was selected due to high coherence along the span and is consistent with figures 19 and 20. However, it should be noted that similar phase plots with a linear variation along the swept shock were obtained at all frequencies within the low-frequency shock-unsteadiness bump between 50 and 140 Hz. This implies that these frequencies are related to the same propagation phenomenon, having a similar wavelength, since the convection speed increases linearly with frequency. For this reason, $U_{c}$ was computed at each frequency within this range at intervals of $\unicode[STIX]{x0394}f=4$ Hz, which is the frequency resolution of the signal processing described in § 3.2. The corresponding wavelength, $l$, was computed by $l=U_{c}/f$, and the average value across the range of frequencies is given in table 4. These results show that the convection speed at $St\approx 0.09$ is similar between $M=0.74$ and 0.82, at around $-0.26\,U_{\infty }$, where the negative sign implies an inboard-running propagation. We find a wavelength of $l\approx 0.8\,b\approx 3$ MAC, where $b$ denotes the semi-span.
Phase angle variation along shock representing higher-frequency outboard-running oscillations at  $M=0.80$: (a) phase angle with span at 216 Hz and (b) phase angle (solid line) and coherence levels (dotted line) with frequency for two points along shock, between $\unicode[STIX]{x1D702}=0.87$ and $\unicode[STIX]{x1D702}=0.99$, at $\unicode[STIX]{x1D6FC}=3.3^{\circ }$. Dashed blue line in (b) indicates linear fit between 200 and 400 Hz.

This low-frequency inboard-running propagation of pressure along the shock occurs even at low incidence, as previously highlighted in figure 18. With an increase in angle of attack and the formation of a localised separated flow region, this unsteadiness reverses direction and propagates outboard between the separated region and the wing tip. Employing (3.3) to compute the convection velocity gives similar velocities of around  $0.26\,U_{\infty }$ for the range of Mach numbers studied, now having a positive sign, implying outboard propagation. Additionally, higher-frequency outboard-running waves, confined to the tip region, coexist with the low-frequency shock unsteadiness highlighting distinct flow phenomena beyond buffeting onset, as outlined from the instantaneous snapshots at $M=0.80$ and $\unicode[STIX]{x1D6FC}=3.3^{\circ }$ in figure 16. Figure 22(a) shows the phase angle variation along the shock at 216 Hz for three angles of attack beyond buffeting onset at $M=0.80$. The linear phase variation outboard of $\unicode[STIX]{x1D702}=0.78$, having a negative slope, implies outboard-running propagations at this frequency. This corroborates the POD analysis at $\unicode[STIX]{x1D6FC}=3.3^{\circ }$, whereby modes with high spatial amplitudes in the outboard region are characterised by broadband, higher-frequency behaviour, above 200 Hz, as explained in § 5.4. Assessing the convection speed of these higher-frequency and smaller-scale propagations is more difficult, due to the broadband frequency content and intermittent dynamics. Therefore, this speed was computed between two spanwise locations for a range of frequencies related to the phenomenon. Specifically, figure 22(b) depicts the phase angle variation with frequency and the coherence levels of pressure signals along the shock, between $\unicode[STIX]{x1D702}=0.87$ and 0.99, at $\unicode[STIX]{x1D6FC}=3.3^{\circ }$. Relatively high coherence levels and a linear phase variation between $f=200$ and 400 Hz ( $St=0.22$ and 0.44) imply a convective phenomenon, while a linear fit between these frequencies, denoted by the dashed line, gives $U_{c}=0.26\,U_{\infty }$ from (3.4). These propagations have a shorter wavelength, relative to the low-frequency shock unsteadiness, decreasing with frequency from $l\approx 0.3\,b\approx 1.2$ MAC to $l\approx 0.2\,b\approx 0.6$ MAC for the range of frequencies assessed.
There is reasonable agreement when evaluating these results alongside the published shock buffet literature. An experiment employing the AVERT half-model, based on the OAT15A aerofoil with  $\unicode[STIX]{x1D6EC}_{LE}=30^{\circ }$, also reports inboard-running and outboard-running pressure propagation along the shock foot, depending on the frequency band (Dandois Reference Dandois2016). To the authors’ knowledge, Dandois (Reference Dandois2016) is the only experimental shock buffet study that mentions an inboard propagation, although not studied in detail therein. Spectral analysis at $M=0.82$ and $\unicode[STIX]{x1D6FC}=3.5^{\circ }$, which is approximately $0.5^{\circ }$ above buffet onset, gives an inboard propagation at a speed of $-0.21\,U_{\infty }$ at $St=0.04$. This corresponds to a wavelength of $l\approx 1.6\,b\approx 5.8$ MAC, larger than the value obtained on our RBC12 model, and even larger than the model’s semi-span. Additionally, for the same flow condition, outboard-running perturbations propagate at $0.25\,U_{\infty }$ at $St=0.26$, reported to be the centre of a broadband shock buffet bump. It is interesting to note that high coherence levels are only maintained over the whole span for the low-frequency peak. Paladini et al. (Reference Paladini, Dandois, Sipp and Robinet2018) extended this analysis to a number of different models and found a spanwise convection speed of $0.245\pm 0.015\,U_{\infty }$, across a Strouhal number range between 0.2 and 0.3. The spanwise wavelength varied between 0.55 and 1.6 MAC. Sugioka et al. (Reference Sugioka, Koike, Nakakita, Numata, Nonomura and Asai2018) performed a spectral analysis using unsteady PSP data on an 80 %-scaled NASA common research model. A convection speed of $0.53\,U_{\infty }$ at $St=0.31$ was reported at $M=0.85$ and $\unicode[STIX]{x1D6FC}=4.68^{\circ }$, which is $1.0^{\circ }$ above buffet onset. In this case, the spanwise wavelength varies between 1.3 and 1.7 MAC. The comparison of these experiments shows considerable spread, highlighting the difficulty to attribute the spanwise convection in swept-wing buffet to a single geometrical feature or flow parameter.
5.6 Modal analysis – dynamic mode decomposition
Dynamic mode decomposition was applied to the DPSP snapshots to extract dynamic information from surface pressure data and to isolate the flow phenomena based on frequency. The results presented are based on 1000 snapshots, comprising 0.5 s of flow data at  $M=0.80$ and $\unicode[STIX]{x1D6FC}=3.3^{\circ }$. The analysis was repeated using different sets of 1000 snapshots in time and using 10 000 snapshots. We find that resulting modes within the same frequency range look similar when visualised. More importantly, resulting modes, both for the shock unsteadiness at lower frequencies and for swept-wing shock buffet at higher frequencies, corroborate the distinct flow phenomena highlighted previously.
The computed DMD spectrum is shown in figure 23. Herein, the spectral coefficients have been computed as the norm of the first projection coefficient (see (3.14)), analytically equivalent to the least squares projection of the first snapshot onto a projected DMD mode (Tu et al. Reference Tu, Rowley, Luchtenburg, Brunton and Kutz2014). The spectral coefficients are scaled by the DMD eigenvalues, such that the scaled spectral coefficients in figure 23 are equal to  $|d_{1,j}|\cdot |\unicode[STIX]{x1D706}_{j}|^{m-1}$ and have been normalised with the maximum value (excluding the mean flow mode). This scaling promotes growing and slowly decaying modes, while reducing the peaks of modes with large norms but of a quickly decaying nature (Tu et al. Reference Tu, Rowley, Luchtenburg, Brunton and Kutz2014). Dominant modes within the low-frequency shock-unsteadiness range are identified, together with a number of modes within the shock buffet range, such that the DMD spectrum is reminiscent of the PSD data computed from unsteady transducers, shown in figure 7(b).
DMD spectrum at  $M=0.80$ and $\unicode[STIX]{x1D6FC}=3.3^{\circ }$.

DMD mode at 83 Hz: (a) real part, (b) imaginary part, (c) magnitude and (d) phase angle in degrees. The spatial amplitudes in (a) and (b) are coloured from blue to red, representing opposite signs ( $-0.01$ to 0.01).

The DMD mode with the highest spectral peak has a frequency of 54 Hz. When visualised, its spatial structure has a small contribution to the shock unsteadiness but is dominated by the structural response. The mode oscillating at 83 Hz has the second highest spectral peak and is depicted in figure 24. Each DMD mode is a complex-valued spatial field scaled to unit norm, and the spatial amplitudes of both real and imaginary parts are shown. Furthermore, their magnitude and phase angle at each spatial point are also presented. Significant perturbations along the shock, the shock-induced separation bubble, and trailing-edge separation on the outboard wing are visible. The S-shaped shock curvature resulting from the reversed-flow region on the outboard wing, which pushes the shock upstream, closely resembles the dominant POD mode at the same flow condition, shown previously in figure 14(a). Furthermore, variations between the real and imaginary parts of DMD modes encode information regarding the propagation of pressure perturbations. The magnitude of the complex number in figure 24(c) highlights the shock-dominated low-frequency dynamics, with the strongest perturbations occurring upstream of the localised separated region. Spanwise pressure propagation along the shock becomes clear from the phase contours in figure 24(d). Apparent discontinuities are due to phase wrapping and are unphysical. The phase variation along the shock reveals a pressure propagation that simultaneously travels in the inboard and outboard directions, reversing its path at a spanwise location close to the wing tip, consistent with the cross-spectral analysis in § 5.5. Considering the streamwise propagation of pressure, the trailing edge separation on the outboard wing has an opposite phase to the shock foot (a phase difference of around  $\unicode[STIX]{x03C0}$). This implies that an upstream shock movement is accompanied by a decrease in pressure at the trailing edge, and vice versa, consistent with the flow physics inferred from the opposite signs of the POD spatial amplitudes, between the shock foot and the trailing edge, in figure 14(a).
The broadband nature of swept-wing shock buffet yields a relatively continuous distribution of modes in figure 23. A similar DMD spectrum has been reported for broadband low-frequency unsteadiness in supersonic SWBLI (Priebe et al. Reference Priebe, Tu, Rowley and Martín2016). Although there are no particularly dominant spectral peaks within our higher-frequency range ( $0.2\leqslant St\leqslant 0.5$) in figure 23, visualisation of these DMD modes reveals the highest contribution along the outboard shock and the separated flow structures convecting downstream. Figure 25 illustrates a DMD mode oscillating at 245 Hz with a relatively high spectral coefficient, when compared to modes within this frequency range. The spatial amplitudes and magnitude in figure 25(a–c) highlight perturbations confined to the tip region, corresponding to the higher-frequency outboard-running behaviour, also characterised by a shorter wavelength. This outboard propagation of pressure towards the wing tip is confirmed from the phase contours in figure 25(d), with the phase gradually decreasing along the shock foot towards the tip.
DMD mode at 245 Hz: (a) real part, (b) imaginary part, (c) magnitude and (d) phase angle in degrees. The spatial amplitudes are coloured as in figure 24.

These observations regarding the spanwise propagation of pressure along the shock become more clear when plotting the phase angle variation with span. The phase angle was computed from the real and imaginary parts of the modes at each spanwise pixel, with the chordwise pixel corresponding to the location of maximum magnitude. The phase angle variation for the two DMD modes depicted in figures 24 and 25 is shown in figure 26. In order to reduce noise and obtain insightful trends, the phase angle is only computed at locations which have at least 20 % of the maximum magnitude value. The phase angle variation of the low-frequency shock unsteadiness mode in figure 26(a) corresponds to an inboard-running propagation inboard of  $\unicode[STIX]{x1D702}=0.87$ and outboard-running propagation between this spanwise location and the wing tip, supporting the CSD data presented previously in figure 18. At the higher frequency of 245 Hz, the phase angle variation in figure 26(b) indicates outboard-running propagation, emanating from $\unicode[STIX]{x1D702}=0.78$ and confined to the outboard wing, corroborating the CSD analysis at 216 Hz in figure 22.
Phase angle variation along path of maximum magnitude for selected DMD modes at  $M=0.80$ and $\unicode[STIX]{x1D6FC}=3.3^{\circ }$: (a) DMD mode at 83 Hz and (b) DMD mode at 245 Hz.

It should be emphasised that in order to get an accurate reconstruction of the shock dynamics, several DMD modes should be included, in line with the broadband nature of the problem. The aim of this section is to isolate the distinct flow phenomena on the upper wing surface beyond shock buffet onset conditions – the predominantly inboard-running low-frequency shock-unsteadiness behaviour almost along the whole span and the higher-frequency, outboard-running behaviour confined to the tip region. These contrasting characteristics were confirmed from time-resolved snapshots based solely on the modes presented in figures 24 and 25. Movies of these reconstructions are available with the online supplementary material.
6 Discussion
The key finding in § 5 is the identification of two coexisting, but distinct, phenomena on the wing’s upper surface in shock buffet conditions. The first is low-frequency shock unsteadiness in a Strouhal number range between 0.05 and 0.15, centred at  $St=0.07$. This unsteadiness is observed both well below structural buffeting onset, in attached flow conditions, and beyond onset, with pressure propagating predominantly in the inboard direction along a large spanwise region, occupied by the unsteady shock wave. The second phenomenon is the presence of higher-frequency outboard-running waves confined to the outboard wing that are exclusive to post-onset conditions. These have a broader spectral signature, between Strouhal numbers of 0.2 and 0.5, closely resembling the buffet-cell behaviour typically reported for swept-wing shock buffet.
This assertion of two distinct phenomena put forward in § 5.2 becomes more evident within the context of a larger research effort, analysing the same wing–fuselage configuration with various numerical approaches. Time-resolved delayed DES studies have captured self-sustained nearly periodic shock oscillations at approximately  $St=0.2$ in the vicinity of onset (Masini et al. Reference Masini, Timme and Peace2018), becoming broadband ( $0.15\leqslant St\leqslant 0.3$) at higher incidence (Sartor & Timme Reference Sartor and Timme2017). Although these studies focus on the outboard-running behaviour, numerically imposed small-amplitude forced wing vibration also leads to distinct phenomena. Timme & Thormann (Reference Timme and Thormann2016) reported a resonant aerodynamic response dominated by the shock unsteadiness for $St\approx 0.1$, besides the accepted shock buffet range between $St\approx 0.2$ and 0.7. Further supporting the experimental findings, close inspection of the forced-motion numerical data reveals inboard propagation at low frequencies, also at pre-onset conditions, and outboard propagation at the higher frequencies, which becomes greatly amplified post-onset. The latter higher-frequency behaviour has recently been linked to a global flow instability (Timme & Thormann Reference Timme and Thormann2016; Timme Reference Timme2019). This combined insight outlines possible connections between the reportedly pure aerodynamic shock buffet instability and the structural dynamics, highlighting the importance of a multidisciplinary approach.
The manifestation of low-frequency shock unsteadiness at pre-onset conditions and its possible connection to the shock buffet instability is intriguing. Since the publication by Dolling (Reference Dolling2001), most studies discussing the fundamental flow physics of SWBLI have concentrated on the topic of unsteadiness. The exact mechanisms responsible for these large-scale, low-frequency motions remain debated, as introduced in § 1. These are typically classified into two main groups – upstream disturbances within the incoming boundary layer and a downstream mechanism dominated by a large-scale instability intrinsic to the separated flow (Clemens & Narayanaswamy Reference Clemens and Narayanaswamy2014). Complex flow phenomena characterise SWBLI across a range of flow regimes, from transonic to supersonic and even hypersonic. Owing to the lack of a reconciled viewpoint on the fundamental physics, synergistic experimental and computational efforts have been focussed on canonical geometries, mostly at supersonic conditions (Gaitonde Reference Gaitonde2015). Moreover, transonic interactions can differ in many ways, as the ability of upstream acoustic-wave propagation within the surrounding subsonic region also influences the interaction (Babinsky & Harvey Reference Babinsky and Harvey2011). A careful review of the shock buffet literature reveals earlier evidence of low-frequency shock motion on swept-wing half-models in transonic wind tunnel environments. Riddle (Reference Riddle1975) notes small, random shock oscillations and a low-frequency peak in the pressure spectra at zero incidence, with no corresponding structural frequencies or known wind tunnel effects. A similar observation by Roos (Reference Roos1985) concerns a low-frequency meandering of the shock at cruise conditions, which being uncorrelated with root strain-gauge measurements was attributed to disturbances in the wind tunnel flow. It should be noted that while shock excursions of over 15 % local chord length are reported at the cruise condition therein, the low-frequency shock unsteadiness analysed herein is characterised by smaller oscillations, of approximately 4 % local chord length at  $M=0.80$ and $\unicode[STIX]{x1D6FC}=1.6^{\circ }$. Whilst identifying a unique source for this first manifestation in our experiment is challenging, we highlight four possible causes: (i) external forcing from an inevitable variation in free stream turbulence levels in the wind tunnel (as mentioned by Roos (Reference Roos1985)), (ii) the model’s structural dynamics considering the inherent flexibility of large aircraft wings, (iii) forcing from upstream or downstream of the shock wave resulting from coherent structures within the upstream boundary layer and the dynamics between the shock wave and the separated region, respectively (Clemens & Narayanaswamy Reference Clemens and Narayanaswamy2014), and (iv) an intrinsic property of the SWBLI (Touber & Sandham Reference Touber and Sandham2011). We give further evidence of these lower-frequency shock dynamics which are evidently present in wind tunnels but not thoroughly discussed in experimental shock buffet studies.
We note that this first phenomenon dominates the spectra around buffet onset, owing to intense pressure fluctuations as the shock oscillates around its mean position. Slightly incrementing the angle of attack around structural buffeting onset at the design Mach number of 0.80, figures 6 and 8 highlight how pressure transducers downstream of the shock location measure increased fluctuations, centred at  $St=0.07$, as the shock-induced separation extends to the trailing edge. This coincides with the increased strain-gauge response with the low-frequency shock unsteadiness and the shock-induced separated region exciting the structural modes of the model. The formation of this localised separated region is visualised clearly by the DPSP standard deviation in figure 9(h). Furthermore, the cross-spectral analysis reveals a well defined change regarding the pressure propagation along the shock. Whilst pre-buffet conditions are dominated by an inboard propagation at low frequencies, the formation of a localised separated region causes a reversal in propagation direction at the outboard location of the separation. This has consistently been characterised around structural buffeting onset in the Mach number range between 0.70 and 0.84, as highlighted in figures 19 and 20. Although the frequencies at the centre of the spectral bump for this low-frequency unsteadiness lie within the values typically reported for aerofoil buffet (Feldhusen-Hoffmann et al. Reference Feldhusen-Hoffmann, Statnikov, Klaas and Schröder2018), different mechanisms are responsible. The frequency range is consistent for the Mach numbers assessed, with high coherence levels along the span, whereby the chordwise distance between the shock location and the trailing edge changes. This would significantly alter a two-dimensional, narrow-peak buffet frequency governed by an aeroacoustic coupling. Furthermore, it has been shown in table 4 that similar convection speeds characterise the low-frequency shock unsteadiness. The computation of convection speeds at several frequencies using (3.3) and the method described in § 5.5 yields a linear variation of convection speed with frequency, such that a single wavelength characterises this unsteadiness, as shown in figure 27. The second phenomenon, observed only beyond onset conditions, shows a broadband, higher-frequency behaviour in a Strouhal number range between 0.2 and 0.5. This unsteadiness is well defined by PSD data from unsteady transducers on the outboard wing in figure 7(b). Visualisation of the DPSP snapshots post onset shows long-wavelength (approximately 3 MAC) perturbations running inboard at low-frequency, in addition to higher-frequency, shorter-wavelength (approximately between 0.6 and 1.2 MAC) propagations moving outboard, confined to the tip region. It should be noted that whilst a single wavelength characterises the low-frequency shock unsteadiness, the higher-frequency phenomenon is characterised by a single convection speed and a range of wavelengths, as shown in figure 22(b).
Linear variation of convection speed with frequency at  $M=0.80$ and $\unicode[STIX]{x1D6FC}=3.3^{\circ }$.

The coexisting phenomena motivated the use of data-based modal identification techniques to characterise their spatial and temporal nature. Dominant POD modes in the vicinity of buffet onset showed large-scale unsteadiness at relatively low frequencies, within the low-frequency shock-unsteadiness range. Such observation is expected since this behaviour causes large pressure fluctuations on the surface. Moreover, the POD analysis at an angle of  $0.6^{\circ }$ above the buffet-onset incidence yields additional modes having the largest spatial amplitudes on the outboard wing, as depicted in figure 14(d,e,g,h). The PSD data of the temporal coefficients of these modes is characterised by higher frequency, as opposed to the higher-energy shock-unsteadiness modes, and highlighted in figure 15. The DMD analysis, owing to its ability of extracting modes having a single characteristic frequency, further corroborated the observations already discussed. The dominant mode at 83 Hz in figure 24 is related to a predominantly inboard-running wave, that reverses direction close to the wing tip. Another mode at 245 Hz in figure 25 has an outboard-running behaviour and is confined to the outboard wing. Reconstructions of pressure perturbations based solely on these modes clarify the behaviour of these two distinct phenomena in shock buffet conditions.
7 Conclusions
An extensive experimental database has been analysed to elucidate the complex flow physics surrounding transonic swept-wing shock buffet. This phenomenon is normally characterised by unsteady shock dynamics with a broadband frequency signature mutually interacting with an intermittently separated boundary layer which results in the formation of three-dimensional cellular patterns and spanwise propagation of disturbances. The analysis is conducted using conventional instrumentation, including steady and unsteady pressure transducers and a strain gauge, in addition to state of the art dynamic pressure-sensitive paint. The key insight is the identification of two distinct, possibly connected, phenomena dominating the flow physics around the onset of the shock buffet instability; (i) low-frequency shock unsteadiness, characterised by shock motion for Strouhal numbers between 0.05 and 0.15 (where Strouhal number is based on mean aerodynamic chord and reference free stream velocity) that predominantly propagates pressure disturbances inboard, and (ii) broadband higher-frequency outboard-running pressure perturbations along the shock wave and in the shock-induced downstream separated region, at Strouhal numbers between 0.2 and 0.5, which agrees with the widely accepted definition of the aerodynamic instability.
The first phenomenon is pertinent at all flow conditions, even before the onset of structural buffeting as defined by a root strain-gauge indicator. The spectral bump is centred at a Strouhal number of approximately 0.07 and the highest levels in the power spectral density of the signals analysed are obtained along the shock wave. Whilst unsteady transducer analysis near buffet onset is particularly insightful at a Mach number of 0.80 for which the test rig was designed, the spatial coverage of the dynamic pressure-sensitive paint data has been instrumental in enabling shock-motion characterisation at all investigated Mach numbers from 0.70 to 0.84. Specifically, a physical wind tunnel model imposes practical limitations regarding the number of discrete transducers that can be fitted, and the large variation of the mean shock location at buffet-onset incidence, which varies between  $5.8^{\circ }$ and $0.9^{\circ }$ for the Mach numbers discussed herein, precludes detailed spanwise analysis. Cross-spectral analysis of the pressure propagation along the shock using dynamic pressure-sensitive paint data has revealed distinct characteristics as the angle of attack is incremented. At pre-onset conditions, where the flow remains attached downstream of the shock, pressure propagates in the inboard direction. Increasing the angle of attack to and beyond structural buffeting onset, the stronger shock causes a shock-induced separation bubble to merge with trailing-edge separation. Whilst disturbances continue to propagate inboard, a reversal from the outboard location of the separated region to the wing tip is observed. The inboard convection speed, computed based on the phase angle variation with span, is approximately 0.26 (made dimensionless based on reference free stream velocity) for a Strouhal number of approximately 0.09, irrespective of Mach number and hence the buffet-onset incidence. A characteristic wavelength of approximately 0.8 semi-span lengths (equivalent to approximately three mean aerodynamic chords) is found from a linear variation of convection speed with frequency.
Reaching structural buffeting onset, the formation of a localised separation in the outer wing region leads to the second phenomenon, exclusive to post-onset conditions and simultaneously observed with the low-frequency shock unsteadiness. Broadband pressure perturbations, characterised by higher-frequency and outboard-running propagation, become increasingly dominant in post-onset conditions. Visualisation of the pressure snapshots shows close resemblance to previously reported buffet cells, believed to constitute the swept-wing shock buffet instability. Cross-spectral analysis, conducted at the frequencies corresponding to this second phenomenon, gives characteristic wavelengths of 0.2 to 0.3 semi-span lengths (0.6 to 1.2 mean aerodynamic chords), computed for Strouhal numbers between 0.22 and 0.44. Hence, the spatial patterns involved are smaller when compared to the low-frequency phenomenon. A dimensionless convection speed of approximately 0.26 is found within this higher-frequency range matching the value computed at a Strouhal number of 0.09 for the inboard-running propagation. We emphasise that a single wavelength characterises the low-frequency inboard-running behaviour (specifically, convection speed varies linearly with frequency) while a range of wavelengths are found within the higher-frequency range (giving approximately a single convection speed).
The dynamic pressure-sensitive paint dataset has also been analysed using two data-based modal identification techniques – proper orthogonal and dynamic mode decomposition. The use of such techniques was motivated by their ability to extract and characterise the flow features from vast data volumes in the presence of measurement noise. Dominant proper orthogonal modes, corresponding to low-frequency shock unsteadiness along the whole span, have a similar spatial structure at onset and post-onset conditions. However, the higher angle of attack case yields additional modes with increased spatial amplitudes in the outboard region and frequencies corresponding to higher-frequency outboard propagation. Reconstruction of the flow field based on selected modes confirms these observations. Moreover, a dynamic mode decomposition at this flow condition immediately isolates these flow phenomena based on frequency content, corroborating the idea of distinct phenomena across particular frequency bands. The resulting dynamic modes in the low-frequency and shock buffet range, respectively, reveal spanwise phase variation along the shock closely resembling the observations from cross-spectral analysis. Modal techniques are invaluable in reducing the dimensionality of the large datasets analysed herein and provide a route to unlocking the flow physics.
These experimental findings have been viewed within the context of a larger research effort and the published literature. The importance of synergistic experimental and numerical studies together with a multidisciplinary approach integrating the structural dynamics, giving possible links between the structural response and the fluid-only shock buffet instability, has been emphasised to enable the identification of distinct, possibly connected, flow phenomena. Moreover, the causality of the mechanisms driving low-frequency shock unsteadiness remains controversial and an unequivocal explanation of shock buffet on three-dimensional wings has not been put forward by the community. While an explanation of the shock buffet instability as an absolute instability has recently been proposed (Timme Reference Timme2019), the role of convective mechanisms and possible connections with the observed low-frequency shock unsteadiness remain to be scrutinised.
Acknowledgements
The authors wish to thank S. Lawson and T. Davidson at Aircraft Research Association Ltd. (ARA) for providing the DPSP data. The authors also acknowledge insightful discussions with D. Greenwell and A. Ciarella, also at ARA. The first author is jointly funded by ARA and the University of Liverpool.
Declaration of interests
The authors report no conflict of interest.
Supplementary movies
Supplementary movies are available at https://doi.org/10.1017/jfm.2019.906.


 Open access