Household composition can influence diet quality in different contexts. Studies conducted in high-income countries showed that household composition might influence food consumption; for example, reduced consumption of fruits and vegetables was observed in women from families with children in Denmark and Great Britain(Reference Groth, Fagt and Brøndsted1,Reference Rogers and Pryer2) . On the other hand, higher consumption of fruits and vegetables was seen among those who lived with other people compared with those who lived alone(Reference Hunter, McNaughton and Crawford3). A review study including thirty-two articles investigated the relationship between living alone and food consumption and highlighted that people living alone tend to have lower dietary diversity and lower intakes of healthy foods (fruits and vegetables), suggesting that living alone can negatively affect diet and contribute to unfavourable health outcomes(Reference Hanna and Collins4). It should be noted that no study was found on the association between household composition and aspects of diet in low-income countries, as well as in countries undergoing rapid socio-economic development such as Brazil during the first decade of the 21st century.
Systematic review studies and meta-analysis have verified the influence of parents’ habits on food consumption among children and adolescents(Reference Pearson, Biddle and Gorely5,Reference Wang, Beydoun and Li6) . This influence was observed for American female adolescents(Reference Bauer, Neumark-Sztainer and Fulkerson7), American children and adolescents between 2 and 18 years old(Reference Zuercher, Wagstaff and Kranz8) and Australian children between 8 and 12 years old(Reference Robinson, Rollo and Watson9). In Brazil, based on nationally representative data, it was observed that parents’ eating patterns were associated with those of their children to greater extent within the pattern of ‘traditional main meal’, which encompasses foods typical of the traditional Brazilian diet, such as rice and beans(Reference Massarani, Cunha and Muraro10). In addition, the availability of resources and the proportion of food expenditure may vary according to household composition, modulating the availability of food at home(Reference Friel, Walsh and McCarthy11–Reference Borges, Claro and Martins13). It is also possible to suppose that the presence of children and adolescents in the household determines the selection of food, owing to the particularities in nutritional needs and also food preferences(Reference Elstgeest, Mishra and Dobson14).
The present study aimed to evaluate differences in food consumption of adults according to the presence or absence of children and adolescents in the household, based on the analysis of the first Brazilian National Dietary Survey.
Methods
The data of the present study were obtained from the first Brazilian National Dietary Survey (Inquérito Nacional de Alimentação (INA)), conducted along with the 2008–2009 Household Budget Survey (Pesquisa de Orçamentos Familiares (POF)) developed by the Brazilian Institute of Geography and Statistics. In summary, census sectors were randomly selected from a Master Sample of Household Budget Surveys, which includes a set of 12 800 sectors stratified according to different geographical areas and socio-economic classes. First, the sectors were randomly selected from each stratum proportional to the number of households present and, in the second step, the households were selected by simple random sampling. Of the 55 970 households from the POF 2008–2009, a sub-sample of approximately 25 % of households were randomly selected for the study on individual food consumption (INA). In all, 13 596 households and 34 003 residents at least 10 years of age were selected to compose the Brazilian National Dietary Survey(15). Of these, 22 068 were adults (between 20 and 59 years of age). In the present study, only urban individuals were randomly selected (Fig. 1). The research protocol was approved by the Ethics Committee of the Institute of Social Medicine of the State University of Rio de Janeiro (CAAE 0011.0.259.000-11).
Sample selection of Brazilian adults from the Brazilian National Dietary Survey evaluated according to household composition. Brazil, 2008–2009
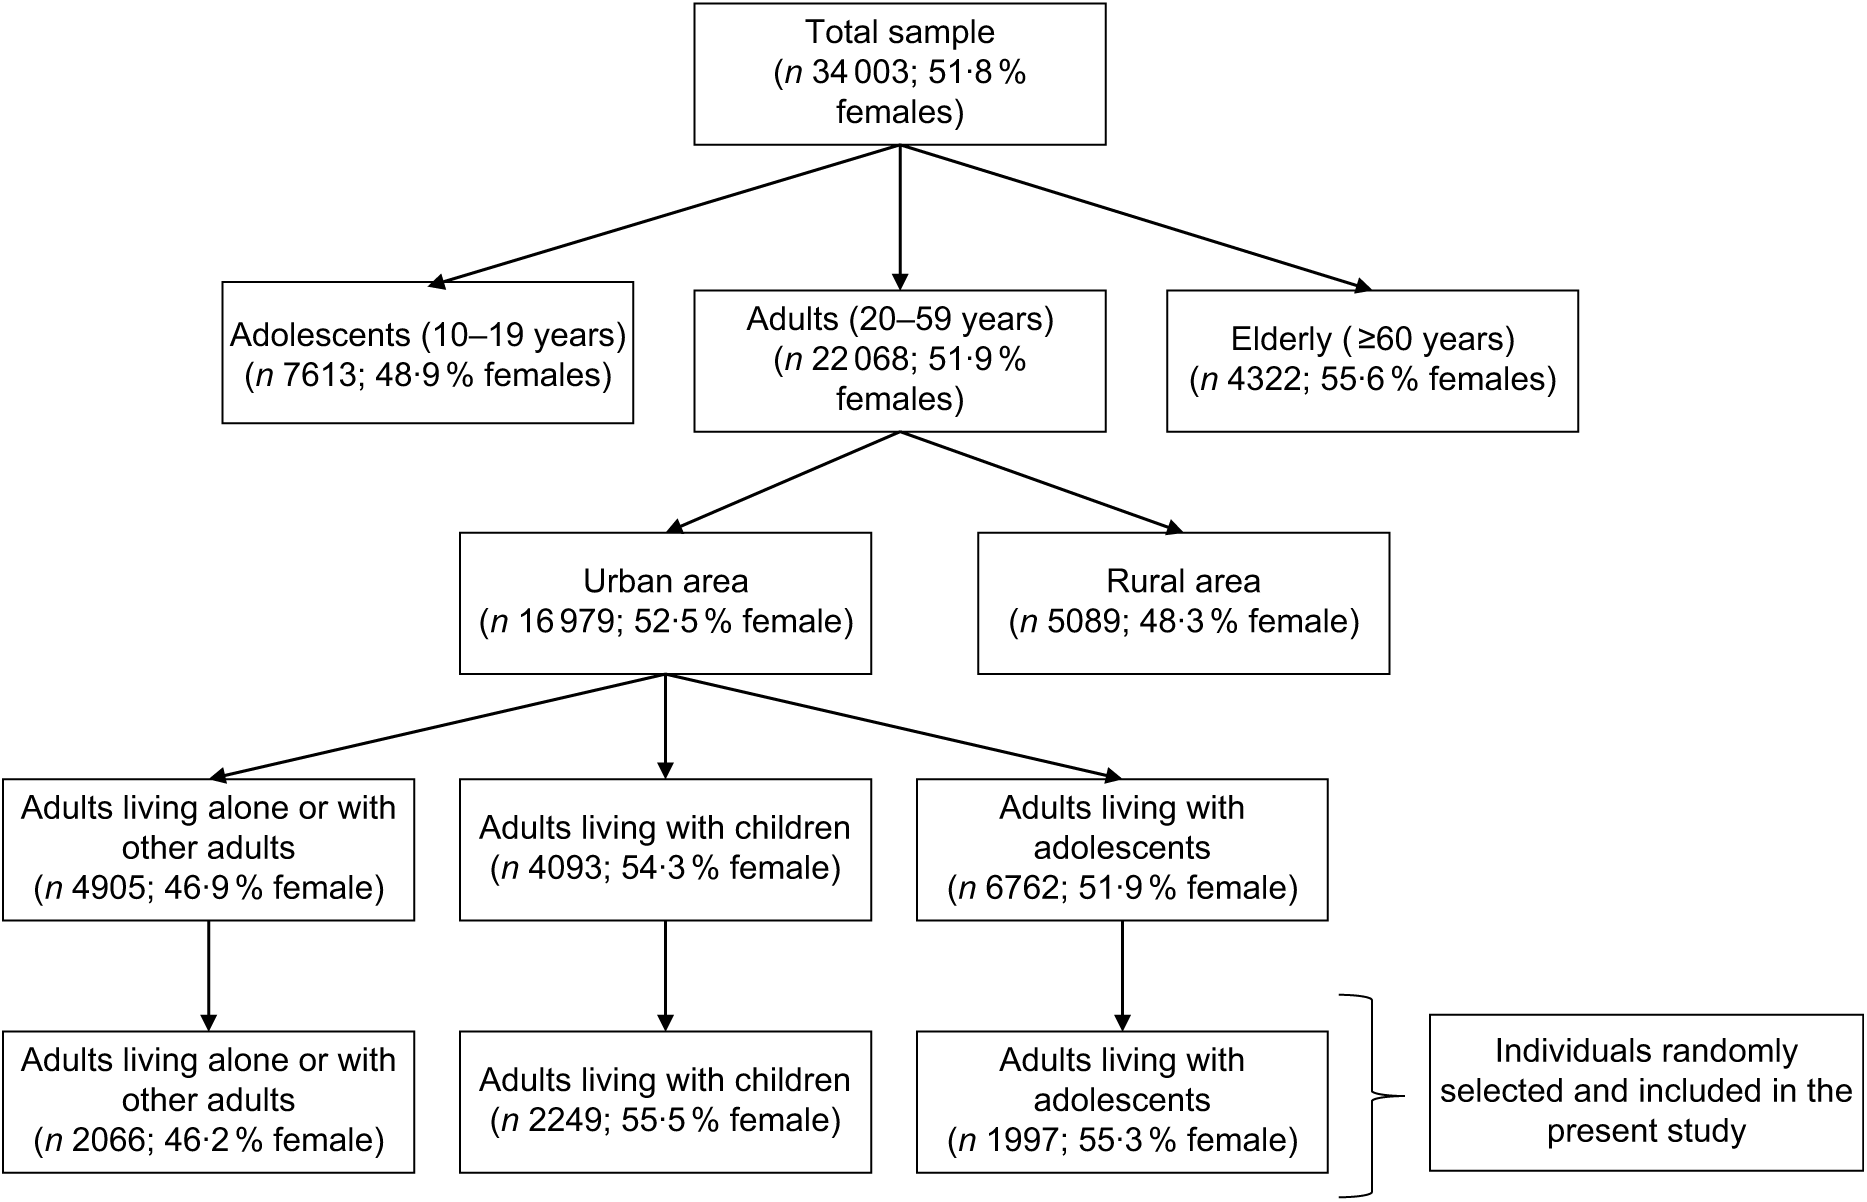
From each one of the three groups: (i) adults living alone or with other adults, (ii) adults living with children (under 10 years of age) and (iii) adults living with adolescents (between 10 and 19 years of age), we randomly selected one adult per household. Individuals living with both children and adolescents were not included in this analysis (n 2069).
The evaluation of food consumption was carried out during the 12 months of research, thus allowing all geographic and socio-economic strata to be studied. Food consumption was estimated through two non-consecutive days of food records, with individuals being advised to report all foods and beverages consumed (except water), the amount consumed (using home measures or volume units), as well as the time of consumption, the day of the week and the place of consumption (inside or outside the home)(15).
To estimate energy consumption, the table of nutritional composition and home measures of the foods consumed in Brazil were used to analyse the food consumption information obtained at INA(16).
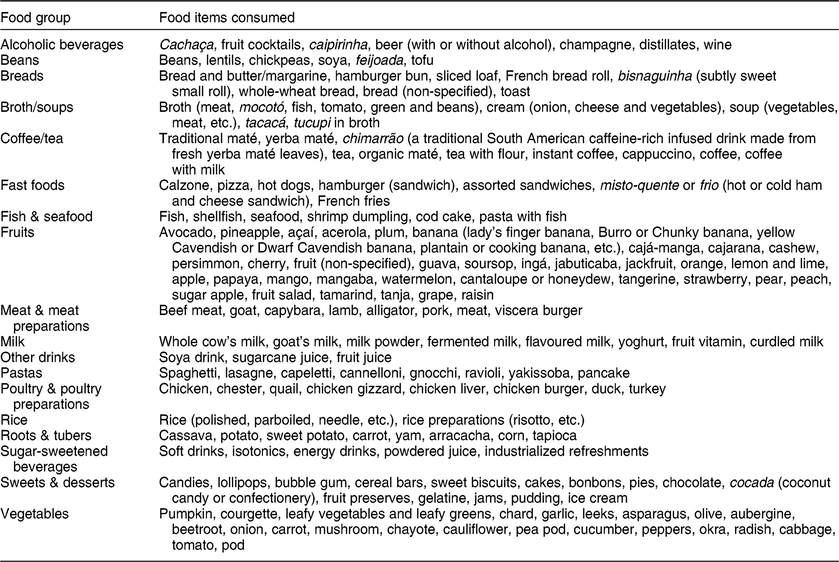
The averages (in grams or millilitres) of foods consumed and reported in the two days were classified into eighteen groups (see Appendix), based on those proposed by Pereira et al. (Reference Pereira, Duffey and Sichieri17). Briefly, this grouping system considers nine major groups disaggregated into subgroups according to the nutritional characteristics of foods and beverages and their use in the diet. For the statistical analyses, the consumption of each food group was expressed in relation to its percentage contribution to total daily energy intake, keeping in the analyses the groups with energy contribution ≥1 % . Food groups that had <1 % contribution to total energy intake are salty snacks & crackers, instant noodles, processed meats, eggs, cheese & cheese products, breakfast cereals and oils & fats.
Per capita household income was assessed by considering the monthly per capita income of all monetary and non-monetary sources of income, including donations, signed employment, self-employment and participation in income transfer programmes. The total household income was divided by the number of household members to calculate the monthly per capita family income.
Statistical analyses
The categorical variables were described as means and 95 % CI of their proportion. To evaluate differences in the percentage of energy contribution regarding total daily energy intake according to the studied variables, considering the household composition, the mean and 95 % CI of their distribution were used. In addition, to evaluate the effect of socio-economic conditions, we analysed the relationship between monthly per capita household income and percentage contribution of the food groups to total daily energy intake according to the composition of the household, using multivariate regression models, adjusted by age. Weighted analyses were stratified by sex and accounted for the complexity of the sample design, using the statistical software package SAS version 9.4.
Results
A total of 6312 adult individuals (52·1 % female), with a mean age of 36·7 years (95 % CI 36·3, 37·1 years) and a mean monthly per capita income of $US 369·18 (95 % CI $US 334·35, $US 404·00) were studied. Individuals living alone or with other adults (32·7 %) had a mean age of 38·1 years (95 % CI 37·3, 38·9 years) and a mean monthly per capita income of $US 538·03 (95 % CI $US 459·60, $US 616·45). Individuals living with children (35·6 %) had a mean age of 32·2 years (95 % CI 31·8, 32·8 years) and a mean monthly per capita income of $US 266·67 (95 % CI $US 224·90, $US 308·44). Finally, individuals living with adolescents (31·7 %) had a mean age of 39·8 years (95 % CI 39·1, 40·4 years) and a mean monthly per capita income of $US 286·18 (95 % CI $US 248·90, $US 323·45; Table 1). Adults living alone and adults living accompanied by one or more adults did not present significant differences in the consumption of the food groups analysed in the current study, so they were grouped for the following analyses.
Distribution of demographic characteristics of Brazilian adults, according to household composition. Brazilian National Dietary Survey, Brazil, 2008–2009

Women living alone or with other adults compared with those living with children had a higher contribution to total energy intake from vegetables (2·2 v. 1·7 %) and compared with those living with adolescents, from milk (5·3 v. 3·8 %) and other drinks (4·8 v. 3·4 %). On the other hand, women living with adolescents compared with those living alone or with other adults had a greater energy consumption from beans (9·0 v. 7·4 %) and rice (8·3 v. 7·0 %); and compared with those living with children, from coffee/tea (15·4 v. 13·1 %; Table 2).
Percentage contribution (mean and 95 % CI) of food groups to daily total energy intake in men and women, according to household composition. Brazilian National Dietary Survey, Brazil, 2008–2009
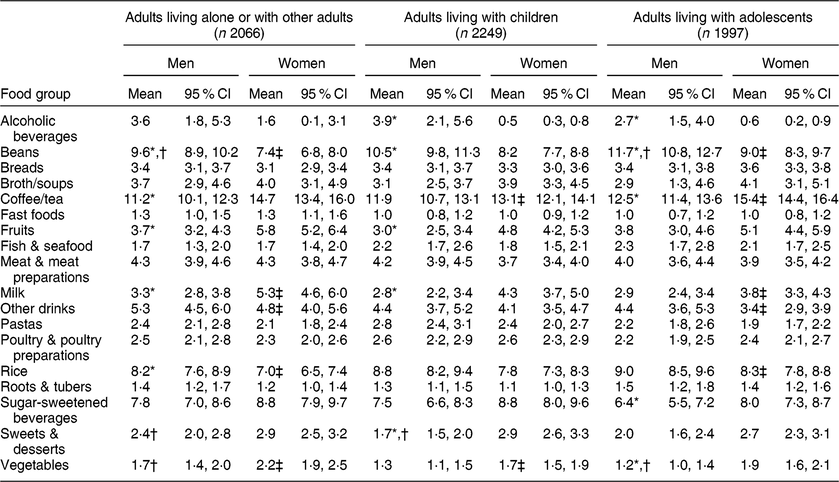
* Statistically significant difference between men and women within the same category of household composition (P < 0·05).
† Statistically significant difference among men according to household composition (P < 0·05).
‡ Statistically significant difference among women according to household composition (P < 0·05).
Men living alone or with other adults, compared with those living with children, had a higher contribution to total energy intake from sweets & desserts (2·4 v. 1·7 %) and compared with those living with adolescents, from vegetables (1·7 v. 1·2 %). On the other hand, men living with adolescents compared with those living alone or with other adults had a greater energy consumption from beans (11·7 v. 9·6 %; Table 2).
Independently of household composition, the contribution of beans to total energy intake was greater for men than for women; the same was observed for alcoholic beverages, but only among those living with children or adolescents, and for rice among those living alone or with other adults. On the other hand, the energy contribution from milk and fruits was lower for men compared with women among those living alone or with other adults and those living with children; the same was estimated for coffee/tea among those living alone or with other adults and those living with adolescents, for sweets & desserts among those living with children, and for sugar-sweetened beverages and vegetables among those living with adolescents (Table 2).
For men living alone or with other adults, it was found that increased income resulted in a higher consumption of alcoholic beverages, fast foods, fruits, milk, other drinks, sweets & desserts and vegetables; and a lower consumption of rice and roots & tubers. Among those living with children, higher income was associated with a greater consumption of alcoholic beverages, fast foods, fruits, milk, other drinks, sugar-sweetened beverages, sweets & desserts and vegetables; and a lower consumption of beans, breads, broths/soups, coffee/tea, fish & seafood and rice. Finally, among men living with adolescents, increased income was associated with a higher consumption of alcoholic beverages, fast foods, milk, other drinks, poultry & poultry preparations and vegetables; and a lower consumption of beans, breads and coffee/tea (Table 3).
Percentage contribution (mean) of food groups to daily total energy intake in men, according to household composition and tertile of per capita household income. Brazilian National Dietary Survey, Brazil, 2008–2009

* P value of age-adjusted linear trend.
Additionally, among men, regardless of household composition, a higher contribution to total energy intake from alcoholic beverages, fast foods, fruits, milk, other drinks, sweets & desserts and vegetables was observed in the third tertile of income compared with the first and second tertiles. Conversely, in the third tertile of income, there was a smaller contribution to total energy intake from beans, breads and roots & tubers compared with the first and second tertiles. Compared with the first and the third tertile, the contribution of meat & meat preparations to total energy intake was greater in the second tertile. The contribution of rice to total energy intake was greater among individuals classified in the first tertile of income than for those in the second and third tertiles, except for men living with adolescents; on the other hand, the contribution of sweets & desserts to total energy intake in the lowest tertile of income was smaller than that observed in the second and third tertiles (Table 3).
For women who lived alone or with other adults, the increase in income tertile was associated with a higher energy consumption from alcoholic beverages, fast foods, fruits, milk, other drinks, sweets & desserts and vegetables; and a lower energy consumption from beans, breads, coffee/tea and roots & tubers. Among those women living with children, the increase in income tertile was associated with a higher consumption of energy from alcoholic beverages, fast foods, fruits, milk, other drinks, sugar-sweetened beverages, sweets & desserts and vegetables; and a lower consumption of energy from beans, broths/soups, coffee/tea, fish & seafood, poultry & poultry preparations and rice. Among those women living with adolescents, the increase in income tertile was associated with a higher contribution to total energy intake from fast foods, fruits, milk, other drinks, sugar-sweetened beverages, sweets & desserts and vegetables; and a lower energy contribution from beans, breads, coffee/tea, fish & seafood and rice (Table 4).
Percentage contribution (mean) of food groups to daily total energy intake in women, according to household composition and tertile of per capita household income. Brazilian National Dietary Survey, Brazil, 2008–2009

* P value of age-adjusted linear trend.
Analogously to the results observed in men, among women, regardless of household composition, alcoholic beverages, fast foods, fruits, milk, other drinks, sweets & desserts and vegetables made a greater contribution to total energy intake in the third than in the first and second tertiles of income. The contribution of beans, breads and coffee/tea to total energy intake was greater for women classified in the first tertile of income compared with the second and third tertiles. Likewise, meat & meat preparations presented a higher contribution to energy intake for women in the second tertile of income compared with the first and the third tertiles (Table 4).
Discussion
In the present study, household composition, particularly the existence of children or adolescents in the household, seems to influence food consumption of Brazilian adults, especially women, along with the per capita household income.
Results similar to those observed in the Brazilian population have been verified by studies conducted in other countries. In the Australian Longitudinal Study on Women’s Health, Elstgeest et al. (Reference Elstgeest, Mishra and Dobson14) identified differences in the dietary patterns of women according to the presence of children at home after a period of 6 years. The authors observed that the dietary patterns of women who lived with children from the beginning of the evaluation were characterized by higher energy consumption, as well as higher adherence to the ‘high-fat and sugar’, ‘meat’ and ‘cooked vegetables’ patterns, and lower adherence to the patterns of ‘Mediterranean-style’ and ‘fruit’. Women who lived with children during this study period increased their consumption of the ‘high-fat and sugar’ ‘fruit’ and ‘cooked vegetables’ patterns. On the other hand, women who did not live with children at any time increased their adherence to the ‘Mediterranean-style’ pattern and decreased the ‘high-fat and sugar’ pattern, suggesting that living with children influences the adoption of less healthy food patterns(Reference Elstgeest, Mishra and Dobson14).
Similarly, Groth et al. (Reference Groth, Fagt and Brøndsted1) also found that Danish women living in families with children had lower intakes of fruits and vegetables, compared with those who lived alone or accompanied but without children. Rogers and Pryer(Reference Rogers and Pryer2), comparing the adequacy of fruit and vegetable intake between the periods of 1986–1987 and 2000–2001 in British adults, found that living with children was negatively associated with adherence to nutritional recommendations for the consumption of these foods. One possible explanation for this association is that women living with children have a higher demand of family responsibilities and less time to spend on food decisions and preparation(Reference John and Ziebland18,Reference Devine19) . In addition, mothers may privilege healthy eating, such as fruits, for the consumption of children.
On the other hand, besides the effect of the presence of children at home, Hanna and Collins(Reference Hanna and Collins4) suggest that living alone can negatively affect aspects of the diet, such as low consumption of healthy foods (fruits and vegetables). Similarly, in studies with Australian women(Reference Hunter, McNaughton and Crawford3,Reference Ball, Mishra and Thane20) , those living alone had lower intakes of fruits, vegetables and meat, as well as lower intake of calcium, compared with those who lived with another adult. In the present study, living alone or with other adults also influenced the diet; however, this aspect changed according to the sex of the adult and the level of per capita income of the household. Thus, it reinforced the idea that household composition can influence the quality of the diet. According García-González et al. (Reference García-González, Achón and Alonso-Aperte21), women take responsibility for the entire cooking process in families. In this context, recent evidence links home cooking with healthier dietary choices and better adherence to nutritional guidelines as important tools to achieving a better and healthy diet(Reference Chen, Lee and Chang22–Reference Wolfson, Clegg Smith and Frattaroli24).
Most of the studies investigating the effect of household composition on food consumption have been conducted in elderly populations(Reference Hanna and Collins4). According to Hunter et al. (Reference Hunter, McNaughton and Crawford3), this concern can be explained because with ageing there is an increasing number of individuals living alone and it is, therefore, necessary to identify ways to help people plan the purchase and preparation of healthy foods, such as fruits and vegetables. Aspects that may explain the influence of household composition on food consumption are the availability of resources and the proportion of income on food expenditures(Reference Friel, Walsh and McCarthy11–Reference Borges, Claro and Martins13) as well as different dietary needs and preferences of different age groups, such as children and adolescents(Reference Elstgeest, Mishra and Dobson14).
Differences in diet quality due to socio-economic conditions of individuals can be explained by the variation in the cost of food(Reference Darmon and Drewnowski25). In this context, there has been an inverse relationship between energy density and cost per kilojoule of food, with lower costs for foods such as refined grains and products with added sugar and fats, and higher costs for fruits and vegetables(Reference Drewnowski and Specter26,Reference Lee, Ralston and Truby27) . In the present study, there is a greater maintenance of traditional eating habits at lower income levels, possibly associated with eating meals prepared at home. However, individuals of higher socio-economic level seem to be losing traditional habits of the Brazilian diet, and although they presented higher consumption of healthy food markers such as fruits, milk and vegetables, they also showed higher consumption of unhealthy food markers such as alcoholic beverages, fast foods, sweets & desserts and sugar-sweetened beverages. On the other hand, individuals in the first income tertile presented higher consumption of rice, beans, breads, fish & seafood and starchy foods, compared with the last income tertile.
In addition, the present study highlights the fact that the consumption of sugar-sweetened beverages is higher in households with children or adolescents, increasing with household income. This is very concerning, since it may be reflecting high consumption also among children and adolescents, who are vulnerable groups from the point of view of health and nutrition. Sugar-sweetened beverages are considered a marker of poor diet quality and have been associated with weight gain and other important metabolic disorders(Reference Powell and Maciejewski28,Reference Ferretti and Mariani29) . Thus, the consumption of these beverages should be discouraged, as has already been done in countries such as Chile, Finland, France and Mexico(Reference Cabrera Escobar, Veerman and Tollman30,31) .
In the same sense, moderation in the consumption of low-quality diet markers such as sweets & desserts, fast foods and alcoholic beverages should be encouraged, especially considering their increase among families with higher socio-economic status. In the Brazilian Strategic Action Plan for Coping with Noncommunicable Chronic Diseases, alcohol intake is a public health priority, with the objective to reduce abusive alcoholic consumption by 10 % by 2022, since it is considered a risk factor for diseases such as cancer, CVD, liver and mental diseases (including depression), as well as accidents and violence(Reference Malta and Silva32).
Another concerning issue is the consumption of fish & seafood, milk and dairy, and fruits, which are considered markers of good quality of the diet, that presented lower consumption in the low-income households with children or adolescents compared with households with adults only. Public policy actions should promote the access to these foods(31), which are usually more expensive and less accessible to low-income families.
Estimating the weekly cost of a diet in Ireland based on current nutritional recommendations, Friel et al. (Reference Friel, Walsh and McCarthy11) found that the percentage of weekly household income required to purchase the stipulated food basket (containing cereals, bread, potatoes, fruits, vegetables, dairy products, meat, products with high sugar and fat content) would be 80, 69 and 38 % for households comprising ‘single parents with one child’, ‘two adults with two children’ and ‘single elderly persons’, respectively.
In Brazil, using food availability data from POF 2002/2003, comparing adult-equivalent and per capita measures for energy availability of the Brazilian population, Claro et al. (Reference Claro, Levy and Bandoni33) observed that differences in home energy availability varied between 92 kJ/d (22 kcal/d; home with adults and adolescents) and 1791 kJ/d (428 kcal/d; home with elderly people), indicating that, when assessing home energy availability, per capita measures may underestimate the real energy availability, ignoring differences in the composition of households. In this sense, the present study shows an advance in the evaluation of the individual food consumption of adults assessed in the INA, considering the composition of the households and verifying significant differences for the majority of the food groups studied according to the presence or not of children, adolescents or other adults.
A possible limitation of the present study is the method used to obtain information on food consumption, since under-reporting is possible with the use of food records. However, food records present, as advantages, not relying on memory and providing more accurate information regarding the quantities consumed(Reference Trabulsi and Schoeller34). In addition, in the INA, strategies such as continuous training and supervising of interviewers and providing a written manual for the participants were used to reduce measurement errors. Although food consumption under-reporting was not evaluated in the present analysis, Lopes et al. (Reference Lopes, Luiz and Hoffman35) used doubly labelled water to assess the dietary assessment method adopted in the INA and indicated that the energy intake underestimation is approximately 30 %.
The strength of the present study is the pioneering analysis that evaluates the effect of household composition on individual food consumption based on a representative sample of the Brazilian population, allowing the identification of groups that are more vulnerable to inadequate food consumption, such as women living with children or adolescents. The presence of children or adolescents may impact the diet of adults by increasing or reducing the consumption of specific food groups; this effect may be influenced by the per capita household income.
In this sense, it is worthwhile to observe that alcoholic beverages, fast foods, milk, other drinks, sweets & desserts and vegetables presented a common behaviour, independent of household composition, and therefore may be the object of general public policies. However, food groups such as sugar-sweetened beverages, fish & seafood, milk and dairy, fruits and rice, which presented different consumption trends according to household composition, should be the object of public health recommendations that consider the presence of vulnerable groups in the household.
Conclusion
Household composition, particularly the existence of children or adolescents in the household, seems to influence food consumption in Brazilian adults, particularly women, and shows differences according to the household income. Thus, considering that household composition and income act as a barrier or facilitator of food consumption and modulate the diet quality, the design of public policies to promote healthy eating may be improved by using information on the family characteristics.
Acknowledgements
Acknowledgements: The authors are thankful to the Ministry of Health of Brazil and the Brazilian Institute of Geography and Statistics for supporting the Brazilian National Dietary Survey (INA). Financial support: This research received no specific grant from any funding agency in the public, commercial or not-for-profit sectors. Conflict of interest: The authors declare no conflict of interest. Authorship: P.R.M.R. contributed to data analysis and interpretation and manuscript writing. L.S.M. contributed to data analysis and interpretation and manuscript writing. D.B.C. contributed to data analysis and interpretation and manuscript writing. R.S. contributed to study design and supervising, data interpretation, and manuscript conception and final revision. R.A.P. contributed to the study design and supervising, data analysis and interpretation, and manuscript conception, writing and final revision. Ethics of human subject participation: The research protocol was approved by the Ethics Committee of the Institute of Social Medicine of the State University of Rio de Janeiro (CAAE 0011.0.259.000-11) on 19 July 2011. All subjects gave their informed consent for inclusion before they participated in the study, which was conducted in accordance with the Declaration of Helsinki.
Appendix
Food groups reported by Brazilian adults from the Brazilian National Dietary Survey evaluated according to household composition. Brazil, 2008–2009