

Tillage is an important tool for managing weeds in a variety of cropping systems (Radosevich et al. Reference Radosevich, Holt and Ghersa2007). In organic systems, tillage and cultivation, along with other physical and cultural weed management practices, are the primary tactics available to growers for reducing the abundance of weeds in both the emergent community and the soil seedbank (Pekrun and Claupein Reference Pekrun and Claupein2006; Rasmussen Reference Rasmussen2004; Schutte et al. Reference Schutte, Tomasek, Davis, Andersson, Benoit, Cirujeda, Dekker, Forcella, Gonzalez-Andujar, Graziani, Murdoch, Neve, Rasmussen, Sera, Salonen, Tei, Tørresen and Urbano2014). In conventional systems, in which weed control relies primarily on herbicides, strategic tillage (Price et al. Reference Price, Monks, Culpepper, Duzy, Kelton, Marshall, Steckel, Sosnoskie and Nichols2016) is increasingly being used as part of an integrated weed management strategy (Swanton and Weise Reference Swanton and Weise1991) to address the proliferation of glyphosate-resistant weeds (Ganie et al. Reference Ganie, Sandell, Jugulam, Kruger, Marx and Jhala2016; Norsworthy et al. Reference Norsworthy, Ward, Shaw, Llewellyn, Nichols, Webster, Bradley, Frisvold, Powles and Burgos2012) and to reduce the need for herbicides that can negatively impact the environment (Buhler et al. Reference Buhler, Gunsolus and Ralston1992; Soule et al. Reference Soule, Carré and Jackson1990).
Tillage can also stimulate weed seed germination and seedling emergence (Rasmussen Reference Rasmussen2004; Schutte et al. Reference Schutte, Tomasek, Davis, Andersson, Benoit, Cirujeda, Dekker, Forcella, Gonzalez-Andujar, Graziani, Murdoch, Neve, Rasmussen, Sera, Salonen, Tei, Tørresen and Urbano2014) by changing the vertical distribution of weed seeds in the soil (Cardina et al. Reference Cardina, Regnier and Harrison1991; Clements et al. Reference Clements, Benott, Murphy and Swanton1996; Gardarin et al. Reference Gardarin, Colbach and Dürr2010) and by changing the physical, chemical, and light characteristics of the soil environment (Benech-Arnold et al. Reference Benech-Arnold, Sanchez, Forcella, Kruk and Ghersa2000; Gardarin et al. Reference Gardarin, Colbach and Dürr2010). Hence, viewed within a community assembly framework (sensu Booth and Swanton Reference Booth and Swanton2002), tillage is a strong assembly “filter” that can either constrain or advance the membership of species within the subsequent weed community (Ryan et al. Reference Ryan, Smith, Mirsky, Mortensen and Seidel2010; Smith Reference Smith2006).
Whether an individual weed species is constrained or promoted by tillage depends on traits that determine its responsiveness to the actual physical disturbance or the subsequent changes to the soil environment. It is well known that weed species differ in their timing and duration of emergence from the soil (i.e., emergence periodicity; Egley and Williams Reference Egley and Williams1991; Stoller and Wax Reference Stoller and Wax1973), suggesting that timing of disturbance in relation to the timing of species germination and emergence may play an important role in determining how tillage operates as a community assembly filter, and therefore, how weed communities assemble following a tillage event (Smith Reference Smith2006). For example, weed species that typically complete their emergence from the soil seedbank immediately prior to a tillage event will be killed, and thus have a low probability of membership in the emergent weed community. Conversely, species that typically emerge later, or have extended periods of emergence over the growing season, will more likely be represented in the emergent community.
Previous research has demonstrated that the seasonality of tillage (i.e., spring vs. fall tillage) is associated with emergent plant communities that are distinct in their species composition and abundance (Crawley Reference Crawley2004; Hald Reference Hald1999; Smith Reference Smith2006). What is not known, however, is whether finer-scale variation in the timing of tillage—e.g., several weeks earlier or later in the fall or during the summer—can similarly lead to weed communities with distinct species composition. If species filtering by tillage depends on finer-scale variation in timing, then the opportunity exists to use tillage not only to better control weeds but to steer weed communities toward specific assemblages of species that may be easier to manage or that provide ecosystem services (Kremen and Miles Reference Kremen and Miles2012; Norris and Kogan Reference Norris and Kogan2005). Given the prevalence of soil tillage for weed control, and the potential deleterious effects it has on soil health (Smith et al. Reference Smith, Ryan and Menalled2011), it is imperative that we optimize the use of this tactic by understanding how variation in within-season timing of this soil disturbance affects the assembly and trajectory of weed communities.
The objective of this study was to characterize and quantify the role that fine-scale variation in timing of tillage plays in structuring weed communities (i.e., total abundance, species richness, evenness) and species composition across four locations spanning a climatic gradient in the northeastern United States. We hypothesized that the species composition and relative abundance of weed communities that emerge following a tillage event would differ depending on when tillage was conducted and that general relationships between the timing of tillage and weed community structure would be consistent across locations.
Materials and Methods
Experiment Locations
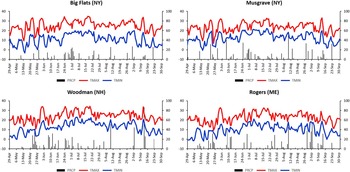
This multisite experiment was carried out from late April to late September 2013 at four locations across the northeastern United States. The four sites were (1) the U.S. Department of Agriculture Big Flats Plant Materials Center in Big Flats, NY (42.16°N, 76.89°W; hereafter “Big Flats”); (2) the Cornell Musgrave Research Farm in Aurora, NY (42.73°N, 76.66°W; hereafter “Musgrave”); (3) the University of New Hampshire Woodman Horticultural Research Farm in Durham, NH (43.15°N, 70.94°W; hereafter “Woodman”); and (4) the University of Maine Rogers Farm Forage and Crop Research Facility in Stillwater, ME (44.93°N, 68.69°W; hereafter “Rogers”). The four locations have varying soil and climate conditions. The soil texture is dominated by Unadilla silt loam at Big Flats, Lima silt loam at Musgrave, Charlton fine sandy loam at Woodman, and Lamoine silt loam at Rogers. The cumulative growing degree days (GDD from January 1 with 0 C base temperature) recorded in 2013 were generally similar across the two New York sites, but were slightly higher for Woodman (NH) and lower for Rogers (ME). The total GDD over the entire experimental period did not differ appreciably between sites (i.e., 2,795 C at Big Flats, 2,809 C at Musgrave, 2,859 C at Woodman, and 2,527 C at Rogers). The daily temperature and rainfall patterns were also similar among the sites (Figure 1). At each site, weather conditions (rainfall and temperature) during the study period were similar to the 15-yr average (data not shown). Crops grown the previous summer at each site were cereal rye (Secale cereale L.) at Big Flats, winter wheat (Triticum aestivum L.) at Musgrave, a mixture of vegetable crops at Woodman, and a green manure mixture of wild-proso millet (Panicum miliaceum L.) and Sorghum [Sorghum bicolor (L.) Moench spp. bicolor] at Rogers.
Daily maximum (TMAX) and minimum (TMIN) temperatures (C, left y-axis) and precipitation (PRCP, mm, right y-axis) from the first (Apr 29) to the last (Sept 30) tillage date at each location, except at the Rogers site, where the last treatment occurred on Sept 16.
Experimental Treatments
At each location, 12 treatments of a single primary tillage event at 2-wk intervals over the course of the growing season were compared using a randomized complete block design with four replications, except at Woodman, where five replications were used. Tillage was carried out using a rototiller (10- to 15-cm depth) at all sites. Rototilling was intended to be broadly representative of any tillage practice that would result in moderately deep and moderately intensive soil disturbance, as might be utilized in typical specialty or row-crop production systems. Any weeds that may have been present at the time of tillage were destroyed. The tillage treatment was applied once every 2 wk, starting April 29 and continuing until September 30, except at the Rogers site, where the last treatment occurred on September 16. At each site, specific tillage times were randomly assigned to four plots, except at the Woodman site, where treatments were replicated five times. Treatment plots measured 1.5 by 3.0 m. No crops were sown following the single tillage event for each treatment, and no other management practices other than tillage were implemented at the sites, except at the Musgrave site, where glyphosate (340 g ae ha−1) was applied at the start of the experiment to suppress crop volunteers. Glyphosate is a systemic foliar-applied herbicide with no soil residual activity and so had no effect on weeds emerging later in the experiment at the Musgrave site.
Sampling
At each site, we quantified the emergent weed community in each treatment replicate 6 wk after the tillage operation. Our rationale for sampling each treatment 6 wk after the tillage event was that this duration of time would allow for maximum emergence of weed seedlings while minimizing the potential for competitive exclusion. Weed seedlings in each plot were identified and counted within a randomly placed 0.5-m2 quadrat within the center of each plot and then converted to the number of plants or stems (for perennials) per square meter. Most individuals were identified to the species level; some could only be identified to the genus or family level. Plants that could not be identified were, however, kept in the data set for calculating weed species richness (total number of species) and total abundance. Crop volunteers (e.g., rape [Brassica napus L.], birdsrape mustard [Brassica rapa L.], cereal rye, wheat, and tree saplings [Populus spp.]) were removed from the data sets, because their presence in plots was due to the preceding crops or the surrounding landscape. Data from one replicate plot associated with the September 16 tillage treatment at Big Flats, two replicate plots associated with the September 30 tillage treatment at Big Flats, and one replicate plot associated with the May 27 tillage treatment at Rogers were excluded because of mistakes that caused these plots to be tilled at the wrong time.
Community Indices
Weed species richness (S) and evenness (J) were computed per plot with the ‘vegan’ package (Oksanen et al. Reference Oksanen, Blanchet, Kindt, Legendre, O’Hara, Simpson, Solymos, Stevens and Wagner2010) using R software (R Core Team 2015). Evenness was computed as J=H/ln(S), where H is the Shannon-Weiner diversity index. Evenness is typically represented on a scale ranging from near 0, which indicates low evenness or high single-species dominance, to 1, which indicates equal abundance of all species or maximum evenness (Alatalo Reference Alatalo1981; Routledge Reference Routledge1980). Evenness was considered as 0 when only 1 species occurred.
Data Analysis
Analyses were conducted at both the site level and across all sites together using the complete data set. This allowed us to evaluate site-specific and overall results separately.
Effect of Tillage Timing on Weed Community Structure
To test for differences in weed community structure at different timings, total weed abundance was modeled with the generalized linear mixed model (GLMM, with Poisson distribution), and weed species richness and evenness were modeled with the linear mixed model (LMM). Both analyses were conducted using the ‘lme4’ package (Bates et al. Reference Bates, Mächler, Bolker and Walker2015). The timing of tillage was considered an ordered factor for fixed effects, and location was a random effect. We used ANOVA with the ‘car’ package (Fox and Weisberg Reference Fox and Weisberg2011) and Tukey’s pairwise multiple comparison tests with the ‘agricolae’ (De Mendiburu Reference De Mendiburu2014) or ‘multcomp’ (Hothorn et al. Reference Hothorn, Bretz and Westfall2008) packages to determine significant differences in total abundance, species richness, and evenness between tillage timings.
We used the same procedures to analyze the site-specific data sets, except that in this case species richness and evenness were modeled with a linear model and total weed abundance was modeled with a generalized linear model. Species richness data were square-root transformed to meet the assumptions of homogeneity of variance (Bartlett test) and normality of the residuals (Shapiro test).
Effect of Tillage Timing on Weed Community Composition
Associations between tillage timing and weed community composition were assessed by ordination analyses conducted on the site-specific data sets only. Ordination analyses were performed with metric and nonmetric multidimensional scaling methods. Principal coordinates analysis (PCoA), a metric multidimensional scaling method, was selected because similar results were obtained with nonmetric multidimensional scaling and because clearer ordinations were obtained with PCoA. Consequently, a PCoA with a Bray-Curtis distance metric was run using the ‘vegan’ package (Oksanen et al. Reference Oksanen, Blanchet, Kindt, Legendre, O’Hara, Simpson, Solymos, Stevens and Wagner2010) on the plot by species matrix. Prior to analysis, species occurring in fewer than 5% of the sample units (i.e., <3 occurrences) were deleted from the data set, and abundance values were square-root transformed. The resulting data sets for Big Flats, Musgrave, Woodman, and Rogers contained 16, 19, 19, and 20 weed species, respectively. The significance of tillage time was tested with a permutation-based multivariate analysis of variance (PerMANOVA; Anderson Reference Anderson2001) using the Adonis function of the ‘FactoMineR’ package (Le et al. Reference Le, Josse and Husson2008). The analysis was conducted on a matrix of Bray-Curtis distance coefficients, and P-values were based on 999 permutations.
Cluster Analysis
We used cluster analysis to determine whether there were distinct groups of tillage times that resulted in similar weed communities. A centroid of the plots of a particular timing of tillage in the PCoA multidimensional space represents the average weed community of this timing. Euclidean distances between centroids in the PCoA multidimensional space (first 5 axes), representing the Bray-Curtis dissimilarity of weed communities, were then used to conduct a Ward hierarchical ascendant classification. Clear and nonredundant groups of tillage timings were identified using dendrograms plotted with the ‘ggplot2’ (Wickham Reference Wickham2009) and ‘ggdendro’ (de Vries and Ripley Reference de Vries and Ripley2013) packages. ANOVA and Tukey’s pairwise multiple comparison tests were used to compare average species richness, evenness, and total abundance of tillage-timing clusters.
Indicator Species Analysis
We used PC-ORD 6 (MjM Software Design, Gleneden Beach, OR) to conduct an indicator species analysis (Dufrene and Legendre Reference Dufrene and Legendre1997) to test for associations between individual weed species and the tillage-timing groups within each site. Indicator values for each species were calculated by multiplying the relative abundance across all timings of tillage by the relative frequency across replicates within each tillage-timing group. Indicator values range from 0 (not detected) to 100 (exclusive association). Significance of indicator values was assessed using a Monte Carlo procedure (4,999 runs).
Results and Discussion
A total of 107 plant species were recorded across the four locations, 35 species at Big Flats, 49 species at Musgrave, 30 species at Woodman, and 38 species at Rogers. The 10 most frequently encountered species, in decreasing order, were smooth crabgrass [Digitaria ischaemum (Schreb.) Schreb. ex Muhl.], common chickweed [Stellaria media (L.) Vill.], yellow wood sorrel (Oxalis stricta L.), dandelion (Taraxacum officinale G. H. Weber ex Wiggers), common lambsquarters (Chenopodium album L.), large crabgrass [Digitaria sanguinalis (L.) Scop.], white clover (Trifolium repens L.), annual bluegrass (Poa annua L.), purslane speedwell (Veronica peregrina L.), and hairy galinsoga [Galinsoga ciliata (Raf.) Blake]. Fourteen species were unique to Big Flats, while 30, 13, and 18 species were found only at the Musgrave, Woodman, and Rogers sites, respectively. Surprisingly, only two species were present across all four sites, dandelion and white clover.
Effect of Timing of Tillage on Community Structure
Total weed abundance varied from 2 to 1,696 plants m−². Using the overall data set and considering location as a random effect, the GLMM indicated an effect of tillage timing on total weed abundance (χ²=10.84, df=11, P<0.0001). At each location, the total abundance varied widely with the timing of tillage (Table 1), and no clear pattern was observed. At Big Flats, total abundance in early May averaged about 1,000 plants m−², mainly due to the presence of smooth crabgrass. This annual grass is considered a late-emerging weed, requiring about 600 GDD (from January 1 with 9 C base temperature) for 50% emergence and 1,200 GDD for 95% emergence (Myers et al. Reference Myers, Curran, VanGessel, Calvin, Mortensen, Majek, Karsten and Roth2004). In our experiment, this species was highly abundant and occurred earlier (221 GDD in average) than was reported by Myers et al. (Reference Myers, Curran, VanGessel, Calvin, Mortensen, Majek, Karsten and Roth2004). At the Musgrave site, total weed abundance was high for the early tillage dates because a relatively large number of species emerged at these tillage timings (Table 1). Species richness has been shown to be correlated with total abundance and evenness when species richness is low (i.e., richness<10, which was the case at the Musgrave site) (Stirling and Wilsey Reference Stirling and Wilsey2001). In contrast, at the Rogers site, greater total weed abundance was associated with lower species evenness, with only a few dominant species.
Average (SD) total weed density, weed species richness, and Pielou’s evenness index of weed communities emerging 6 wk after different tillage timings at four locations.Footnote a

a Tests were ANOVA on linear models for the species richness and evenness and on generalized linear models with Poisson distribution for total abundance (*P<0.05, **P<0.01, ***P<0.001). If ANOVA was significant, then Tukey’s pairwise tests compared dates with each site. For each location, similar letters within a column indicate no significant differences between values (α=0.05).
Weed species richness varied from 1 to 15 species. The range of species richness associated with different tillage timings was similar between locations and ranged from 1 to 13 at Big Flats, 1 to 15 at Musgrave, 2 to 11 at Woodman, and 5 to 14 at Rogers. Using the overall data set and considering location as a random effect, results from the LMM indicated an effect of tillage timing (F=4.46, df=11, P<0.0001); however, analysis of the locations individually indicated that species richness varied with the timing of tillage only at the Big Flats and Musgrave sites (Table 1). At Big Flats, no significant difference in species richness was observed after the first tillage date (April 29). At the Musgrave site, we observed higher variability in species richness due to tillage timing. Overall, no consistent pattern of variation in species richness was observed across the four sites. Therefore, the timing of tillage at these sites is likely not a key driver of species richness.
Evenness varied from 0 to 1 and averaged 0.64±0.23 across all tillage dates and sites. Using the overall data set and considering location as a random effect, LMM showed an effect of tillage timing on evenness (F=3.62, df=11, P<0.001). At each location, however, evenness varied with tillage timing (Table 1), except for the Musgrave site, where evenness averaged 0.81±0.17 across all tillage times.
Summarizing these results based on the three community indices, early tillage (i.e., late April, early May) led to weed communities with both high total weed abundance and species richness at the Big Flats and Musgrave sites and high abundance but not high species richness at the Rogers and Woodman sites (Table 1). Late tillage (i.e., late August, September) led to weed communities with low total weed abundance at all locations and high evenness at the Rogers site only. These results suggest that farmers in the northeastern United States who are growing crops that are typically planted in early spring may benefit from using varieties that are particularly weed suppressive or short-season varieties that would allow them to delay tillage and crop planting in order to take advantage of lower abundances of emerging weeds later in spring.
Effect of Timing of Tillage on Weed Community Composition
The first five axes of the PCoA of weed communities at each site accounted for 71.2% (Big Flats), 62.1% (Musgrave), 68.3% (Woodman), and 71.3% (Rogers) of the variation in weed community composition. Within locations, there were distinct weed communities associated with the different tillage timings (PerMANOVA, Big Flats: df=11, F=4.1, R²=0.58, P<0.001; Musgrave: df=11, F=4, R²=0.55 P<0.001; Woodman: df=11, F=5.5, R²=0.56, P<0.001; Rogers: df=10, F=3.9, R²=0.55, P<0.001). Seasonal timing of tillage (i.e., spring vs. fall tillage) is known to shape weed communities (Smith Reference Smith2006), because weed species vary in their seed germination timing and emergence (Forcella et al. Reference Forcella, Wilson, Dekker, Kremer, John, Randy, Alm, Karen, Harvey, Sharon and Buhler1997; Roberts and Feast Reference Roberts and Feast1970). Results from our study indicate that finer-scale variation in the timing of tillage is also important in shaping weed community composition. In this case we observed distinct weed community assemblages associated with specific tillage times during the growing season and these patterns were consistent across locations.
Timings That Resulted in Similar Weed Communities
In addition to weed community structure varying by tillage date, we observed that tillage timings could be grouped based on their common impact on the weed communities. Hierarchical cluster analysis (Figure 2) revealed three distinct groups of tillage timings (with the exception of the August 5 and September 30 samplings at the Big Flats site, which differed markedly from the others). The three groups of tillage timings were consistent over the four locations (Table 2), but the exact tillage time and duration covered by each group varied by location (Figure 2). At the Big Flats and Woodman sites, the early tillage timings (Group 1) covered only late April and early May, whereas they covered these dates and late May at the Musgrave site and late May and early June at the Rogers site. The intermediate tillage timings (Group 2) also varied in terms of time covered. The longest duration of Group 2 tillage timings that led to similar weed communities was observed at the Woodman site, where tillage performed from as early as late May to late August essentially led to the same weed community. The duration of tillage timings falling under Group 3 (late tillage timings) also varied by site. While this group was largely composed of plots that were tilled in late August and September, the exception was at the Musgrave site, where tillage occurring in late July and early August led to similar weed communities, as did tillage in late August and September. Our observation that the duration of tillage timing that results in similar weed community structure across sites varies is difficult to explain but could be due to differences in environmental conditions across the sites; however, variation in GDD and soil moisture among the sites was relatively low (Figure 1). Soil temperature and soil moisture are certainly key drivers of weed germination and emergence (Alvarado and Bradford Reference Alvarado and Bradford2002; Grundy and Mead Reference Grundy and Mead2000), and base temperatures for thermal time calculations can vary between weed species (Guillemin et al. Reference Guillemin, Gardarin, Granger, Reibel, Munier-Jolain and Colbach2013). Tillage groups at the Big Flats site differed somewhat from the other three sites. Specifically, the weed community observed on September 30 was substantially different from communities associated with other tillage dates. This was likely due to statistical limitations, as only two, rather than four, replicates were sampled at this date.
Dendrograms resulting from a hierarchical cluster analysis (Euclidean distance) performed on the first five axes of each principal coordinates analysis of weed communities at each location. Groups of tillage timings indicate similar weed communities.

Mean cumulated growing degree days (with 0 C base temperature) and precipitation (mm), cumulated from the tillage timing to the weed sampling (6 wk later), according to the tillage-timing group (Group 1: early timings; Group 2: intermediate timings; Groups 3, 4, 5: late timings, see Figure 2 for details on dates).Footnote a

a ANOVA was used to test differences between sites. Within groups, similar letters indicate no significant differences (α=0.05). The unique significance test is in bold.
The indicator species analysis showed that 25 weed species were associated with a particular tillage-timing group within at least one site (Table 3). Weed species tended to be associated with either the early tillage (Group 1) or late tillage (Group 3, and Group 4 at Big Flats only). No species were associated with intermediate tillage timings at the Big Flats, Woodman, and Rogers sites. Interestingly, in four of the six cases when a weed species was an indicator at multiple sites, the tillage-timing grouping differed between sites (mouseear chickweed [Cerastium fontanum ssp. vulgare (Hartman) Greuter & Burdet], common lambsquarters, henbit [Lamium amplexicaule L.], and field pennycress [Thlaspi arvense L.]). Giant foxtail (Setaria faberi Herrm.) was consistently associated with the early timings of tillage in the two New York sites, whereas dandelion was associated with early timings at Big Flats and intermediate timings at Musgrave. At Musgrave, nine weed species were associated with early tillage timings, including common ragweed (Ambrosia artemisiifolia L.) and two smartweeds, ladysthumb (Polygonum persicaria L.) and Pennsylvania smartweed (Polygonum pensylvanicum L.). Early emergence of common ragweed likely reflects its specific soil temperature and moisture germination requirements (Guillemin et al. Reference Guillemin, Gardarin, Granger, Reibel, Munier-Jolain and Colbach2013). Shepherd’s-purse [Capsella bursa-pastoris (L.) Medik.], which is known to often have two distinct emergence cohorts (Hurka and Benneweg Reference Hurka and Benneweg1979), was associated with early tillage timings at Woodman.
Indicator species analysis reflecting affinity of weed species to tillage-timing groups at each location.Footnote a

a Significance (P) of indicator values (IV) was assessed using a Monte Carlo procedure (4,999 runs). Bold values where P<0.05.
Previous research has shown that winter annuals (e.g., henbit, Brassicaceae spp., etc.) as well as summer annuals (e.g., common lambsquarters) emerge in both the fall and spring across regions (Gardarin et al. Reference Gardarin, Dürr and Colbach2009). Some winter annual weeds that can overwinter might be more successful emerging in the fall in southern locations, whereas it might just be too cold in more northern locations, and thus these species might be more successful emerging in the spring. Similarly, some summer annual weeds (e.g., hairy galinsoga) can exploit opportunities in late fall to emerge and almost immediately produce seed, a strategy that could be dependent on climatic conditions to be successful.
Weed Community Structure Associated with Each Tillage-Timing Group
Tillage-timing groups identified by the hierarchical cluster analysis varied in terms of total abundance, species richness, and evenness (Figure 3).
Total weed abundance (plants m−², log10 scale), weed species richness, and Pielou’s evenness index in three (Musgrave, Rogers, Woodman) or five (Big Flats) groups of tillage timings identified by hierarchical cluster analysis as leading to similar weed communities. Boxes are ordered chronologically (from left to right). Dots are values higher or lower than 1.5 × the box height (outliers). ANOVA on linear model (for species richness and evenness) and generalized linear model with Poisson distribution (for abundance) tested differences between groups (*P<0.05; ***P<0.01; ***P<0.001). Within sites, similar letters indicate no significant differences (α=0.05).

At the Big Flats site, all three community indices varied across the broad tillage-timing groups and associated weed communities identified by the cluster analysis (Figure 3). Weed communities associated with the early tillage timings (Group 1 tillage and weed communities) had the highest species richness and total abundance. This result could be interpreted to imply that tillage within the window of time associated with the Group 1 timings may be more agronomically risky, resulting in the need for more POST weed management. At all sites, weed communities associated with the intermediate tillage timings (Groups 2) had lower total weed abundance than Group 1 and similar species richness (Figure 3). At the Woodman and Rogers sites, intermediate and later tillage-timing groups (Groups 2 and 3) tended to have similar evenness. At the Woodman site, species richness was stable, whereas at the Rogers site, intermediate timings (Group 3) showed the greatest species richness and abundance. Communities associated with Groups 4 and 5 at the Big Flats site should be viewed with caution, since they comprised one timing each (Figure 2), and Group 5 only comprised two replicates. Group 4 at the Big Flats sites had low species richness and total abundance and high evenness. Group 5 was the last timing of tillage (September 30) and had the lowest richness and high weed abundance.
It is likely that differences in the species pools contributed, in part, to the variation in weed community structure and composition we observed across sites and across tillage-timing groups. In total, 14, 30, 13, and 18 species were unique to Big Flats, Musgrave, Woodman, and Rogers, respectively. Somewhat surprisingly, after omitting species occurring in fewer than 5% of the sample units, only two species were common to all four locations, dandelion and white clover, while a number of species occurred on at least two sites. The fact that species pools differed across sites while the effects of tillage timing on broader-scale patterns of community structure were relatively consistent across sites highlights that tillage acts as an assembly filter on weed traits, rather than specific species per se (Booth and Swanton Reference Booth and Swanton2002; Smith Reference Smith2006). Our indicator species analysis results suggest that the same species can behave differently at distant locations that span a climatic gradient. However, groups of species tend to behave similarly across sites, indicating that traits rather than species appear to respond to tillage in a fairly predictable way. Traits that may be especially important in this regard are those associated with determining a species’ emergence periodicity, including seed traits that regulate germination and emergence under various soil types and environmental conditions (Gardarin et al. Reference Gardarin, Colbach and Dürr2010). This means that while the results observed for these four particular locations have particular relevance for the northeastern United States, they likely apply to annual-based cropping systems in other regions of the country and elsewhere.
The objective of this study was to quantify the relationship between the timing of soil tillage and the structure of the weed community that emerges from the soil seedbank. Using four locations across the northeastern United States, we demonstrated that total weed abundance, species richness, species evenness, and the composition of the weed community that assembles 6 wk after a tillage event are strongly associated with the timing of that tillage event. Using multivariate analysis, we identified three major groups of tillage timings that led to similar weed communities. Depending on the cropping system and management goals, this information can be used to inform and refine ecological weed management practices. Specifically, crop rotation and other cultural management practices can be optimized to increase control of weeds that are associated with specific tillage-timing groups. Our results also have relevance to the development of practices that seek to balance weed management objectives (e.g., control invasive or herbicide-resistant weeds) and conservation goals (e.g., maintaining weeds to support populations of pollinators and natural enemies of crop pests).
Acknowledgments
This work was partially supported by a joint research and extension project funded by the Cornell University Agricultural Experiment Station (Hatch funds) and Cornell Cooperative Extension (Smith Lever funds) received from the National Institutes for Food and Agriculture, U.S. Department of Agriculture (project: 2013-14-425). This work was financially supported by the Maine Agriculture and Forestry Experiment Station, the New Hampshire Agricultural Experiment Station, the French ANR COSAC (ANR-14-CE18-0007), and the Burgundy Region in France (FABER project Couv’Herbi). The authors acknowledge field assistance from Paul Stachowski, Scott Morris, Meredith Ward, Christopher Pelzer, Kristine Averill, and Nicholas Warren. The authors thank David A. Mortensen (Pennsylvania State University, University Park, PA) for input on the experimental design and Fabrice Dessaint (INRA, UMR1347 Agroécologie, Dijon, France) for valuable discussions on data analysis.


