


“Graduate school was hard enough before the plague…How do we best advise our Ph.D. students in these times?”
– Cassuto (Reference Cassuto2020)
“Covid-19 is, in my view, an extinction event.”
– Kelsky (Reference Kelsky2020)Introduction
The coronavirus disease pandemic (COVID-19) is expected to dramatically change higher education in the United States, and not for the better (Greenblatt Reference Greenblatt2020; Hartocollis Reference Hartocollis2020; Kelsky Reference Kelsky2020). Universities are projecting severe budget shortfalls and many have instituted hiring freezes and furloughs, leading some commentators to conclude that negative effects from COVID-19 will exceed those of the 2008 or even 1930s recessions (Carlson Reference Carlson2020a; Greenblatt Reference Greenblatt2020; Kelsky Reference Kelsky2020). While the economic fallout from COVID-19 has exacerbated problems with an already-precarious job market, for many students the crisis has upended their expectations for post-graduate employment opportunities (Carlson Reference Carlson2020b; Cassuto Reference Cassuto2020; Kelsky Reference Kelsky2020). In accordance with these developments, many are pressing universities to take concrete steps to prepare students for an altered post-pandemic reality, with some arguing that the current crisis should hasten investments in existing efforts such as greater preparation for non-academic careers (Carlson Reference Carlson2020b; Cassuto Reference Cassuto2020; Wood Reference Wood2020).
In this paper, we use an original survey to investigate how COVID-19 affected current 2nd and 5th year PhD students’ career aspirations, perceived career preparation and support, and professional development. As part of a larger study supported by the Council of Graduate Schools, we had already started surveying 2nd and 5th year PhD students from a comparatively well-resourced, large East Coast university prior to news breaking of COVID-19 and its impact on the academic job market. Footnote 1 To facilitate causal inference, we exploit the as-if random timing (with respect to an individual’s likelihood of completing the survey) of the introduction of this news to evaluate the effects of COVID-19 on PhD students’ aspirations and perceptions by using an interrupted time series design. Footnote 2 We do so by comparing survey responses prior to and following the breaking of COVID-19 news. Because the survey was in its 3rd year of operation, we are able to use data from the previous year’s survey to rule out alternative explanations and potential challenges to inference – for instance, that our study is picking up changes caused by COVID-19 to the survey sample, as opposed to survey responses.
Our study promises to increase our understanding of the consequences of COVID-19, as well as possible policy responses that might limit its damage. Obtaining insights into the effects of COVID-19 on PhD students’ aspirations and priorities could be critical to informing universities’ efforts to effectively meet students’ evolving needs and protect their mental health and economic well-being (Foley Reference Foley2020; Ortega and Kent Reference Ortega and Kent2018; Reithmeier et al. Reference Reithmeier, O’Leary, Zhu, Dales, Abdulkarim, Aquil, Brouillard, Chang, Miller, Shi, Vu and Zou2019; Sauermann and Roach Reference Sauermann and Roach2012; Woolston Reference Woolston2017; Zahneis Reference Zahneis2020). It could also provide important information to prospective students considering whether to pursue doctoral education in a post-pandemic world (Sauermann and Roach Reference Sauermann and Roach2012). Determining whether, and among whom, preferences are changing due to the pandemic could also shed light on whether educators and administrators should anticipate a widening of the gap between desired and available academic positions, in general and in particular for disadvantaged groups (Sauermann and Roach Reference Sauermann and Roach2012; Zahneis Reference Zahneis2020).
Our study also makes a number of contributions to the extant literature. Although in recent years there has been growing interest in studying the career paths of PhD alumni (Reithmeier et al. Reference Reithmeier, O’Leary, Zhu, Dales, Abdulkarim, Aquil, Brouillard, Chang, Miller, Shi, Vu and Zou2019), there exists very little original data on and understanding of the career paths of current PhD students (Roach and Sauermann Reference Roach and Sauermann2017; Sauermann and Roach Reference Sauermann and Roach2012). However, understanding current students’ opinions – and, critically, how those opinions evolve over the course of one’s doctoral studies – can provide important insights into what shapes career aspirations and how graduate programs are performing. Our study also extends existing studies conducted only with current Science, Technology, Engineering, and Mathematics (STEM) students (Roach and Sauermann Reference Roach and Sauermann2017; Sauermann and Roach Reference Sauermann and Roach2012), many of whom face a very different job market than do non-STEM students, by surveying students from both non-STEM and STEM fields. And our study advances a literature on how recessions affect college major choice among college students by considering how a negative job market shock affects a wider range of outcomes, from aspirations to priorities to program satisfaction, among PhD students of different years (Ersoy Reference Ersoy2019; Liu Sun and Winters Reference Liu, Sun and Winters2019; Shu Reference Shu2016).
Literature review
In recent years, a number of scholars have sought to address the dearth of data on PhD career pathways, primarily through studies of PhD alumni or of current PhD students in STEM fields (Ortega and Kent Reference Ortega and Kent2018; Reithmeier et al. Reference Reithmeier, O’Leary, Zhu, Dales, Abdulkarim, Aquil, Brouillard, Chang, Miller, Shi, Vu and Zou2019; Roach and Sauermann Reference Roach and Sauermann2017; Sauermann and Roach Reference Sauermann and Roach2012). Reithmeier et al. (Reference Reithmeier, O’Leary, Zhu, Dales, Abdulkarim, Aquil, Brouillard, Chang, Miller, Shi, Vu and Zou2019) collected publicly-available data on employment outcomes for all doctorate graduates from the University of Toronto for the period 2000–2015. The authors find that an increasing number of graduates are employed in non-academic careers, and they call for changes to an “outmoded” graduate education apprenticeship model and a greater acceptance and encouragement of a diversity of non-academic careers (Reithmeier et al. Reference Reithmeier, O’Leary, Zhu, Dales, Abdulkarim, Aquil, Brouillard, Chang, Miller, Shi, Vu and Zou2019, p.10).
Sauermann and Roach (Reference Sauermann and Roach2012) and Roach and Sauermann (Reference Roach and Sauermann2017) conduct two surveys of current STEM PhD students. Sauermann and Roach (Reference Sauermann and Roach2012) find that PhD student demand for academic careers outstrips supply, that academic departments and advisors are not perceived as encouraging of non-academic careers, and that students become more interested in non-academic careers, and less interested in academic careers, over the course of their studies. A follow-up study indicates that decreasing interest in an academic career is driven by a perceived mismatch between job preferences and academic positions, as opposed to poor job availability (Roach and Sauermann Reference Roach and Sauermann2017). Woolston (Reference Woolston2017) finds that many PhD students are desirous of academic positions, but that career uncertainty and stresses have led to widespread mental health issues. These studies echo Reithmeier et al. (Reference Reithmeier, O’Leary, Zhu, Dales, Abdulkarim, Aquil, Brouillard, Chang, Miller, Shi, Vu and Zou2019) by calling for sweeping changes to graduate education.
Our project also speaks more broadly to studies on how recessions affect career choice, the majority of which have used undergraduate students’ college major decisions as a proxy for choice. These studies indicate that students respond strategically to recessions. Ersoy (Reference Ersoy2019) finds that the 2008 Great Recession resulted in a shift away from recession-sensitive majors and toward recession-resistant majors. Liu Sun and Winters (Reference Liu, Sun and Winters2019) similarly find that the 2008 recession led to greater registration of STEM majors, and a decline in business majors, and they document some stronger effects for white and Asian men. And Shu (Reference Shu2016) finds that undergraduates who were first-year students during the 2008 recession and who had below-average academic credentials were more likely to major in STEM fields as opposed to management or economics, and to improve their academic performance.
Theory and hypotheses
How should we expect PhD students to respond to the COVID-19 pandemic and its associated economic fallout? If PhD students respond strategically to the recession as studies indicate undergraduate students do, then we should expect them to invest more heavily in preparation for, and become more open to, non-academic careers as compared with academic careers (Ersoy Reference Ersoy2019; Liu Sun and Winters Reference Liu, Sun and Winters2019; Shu Reference Shu2016). Footnote 3
Hypothesis 1 COVID-19 will make PhD students more receptive to non-academic careers, and will lead them to invest more heavily in non-academic skills.
Note that there are multiple reasons that such a shift could occur: notably, students could be driven to non-academic careers because the recession leads them to a) update downward on their chances of obtaining an academic job or b) adopt more risk-averse (salary, security) preferences for what they want from a post-graduate job.
Hypothesis 2 COVID-19 will make PhD students less optimistic about their chances of obtaining an academic position and/or more desirous of non-academic job characteristics that provide financial security.
While we pose the above hypotheses, we acknowledge that Roach and Sauermann (Reference Roach and Sauermann2017) find that declining interest in academic positions over the course of graduate study is caused by a mismatch in preferences, as opposed to perceived academic job availability. Should their results hold with our own data, then perceptions of a less robust job market might not lead to confirmation of Hypothesis 1 posed above – though a change in preferences still might. Indeed, Woolston (Reference Woolston2017) also finds that many students pursue academic positions despite knowledge of a difficult job market, which results in uncertainty and significant mental stress.
Hypothesis 3 COVID-19 will make PhD students more likely to report that they have difficulties managing stress, and to express greater uncertainty in the direction of their post-graduation career.
Studies show that doctoral programs offer limited support for non-academic careers (Reithmeier et al. Reference Reithmeier, O’Leary, Zhu, Dales, Abdulkarim, Aquil, Brouillard, Chang, Miller, Shi, Vu and Zou2019; Roach and Sauermann Reference Roach and Sauermann2017; Sauermann and Roach Reference Sauermann and Roach2012; Woolston Reference Woolston2017). Should we find that COVID-19 is leading more students to consider non-academic careers, then we expect that this should lead to greater dissatisfaction with academic department performance regarding preparation and support for their post-graduate career.
Hypothesis 4 COVID-19 will lead PhD students to express greater dissatisfaction with their academic department’s support and preparation for their desired post-graduate career.
Previous studies indicate that there may be reason to expect some heterogeneous effects. Sauermann and Roach (Reference Sauermann and Roach2012) and Roach and Sauermann (Reference Roach and Sauermann2017) document declines in interest in academic careers over the course of doctoral studies. COVID-19 might hasten a decline in interest in academic jobs that some 2nd year students would have experienced later in the program; COVID-19 might have a lesser effect among 5th year students who had already decided to either pursue academia or not prior to COVID-19 news breaking. A greater effect among 2nd years would also be consistent with evidence that the 2008 recession changed college majors among undergraduates who were first-year students when the recession hit (Shu Reference Shu2016). On the other hand, a negative shock to the academic job market might be more salient among 5th years than among 2nd years, as 2nd years might feel relatively insulated from the pandemic’s consequences and might expect a market recovery by the time they graduate. We propose the latter possibility, though we acknowledge both expectations.
Liu, Sun, and Winters (Reference Liu, Sun and Winters2019) find that the recession led to greater strategic shifts among men and white and Asian individuals. More advantaged groups may be more able to bear the costs of a weakened market and thus might be less affected by COVID-19. Alternatively, individuals from less advantaged groups may have already faced greater barriers to being in their current positions, and may thus be less swayed by market fluctuations. We follow evidence in Liu, Sun, and Winters (Reference Liu, Sun and Winters2019) in our formulation of the next hypothesis.
Hypothesis 5 COVID-19 effects detailed above will be greater among 5th year students, and among those from comparatively more advantaged social groups.
Research design
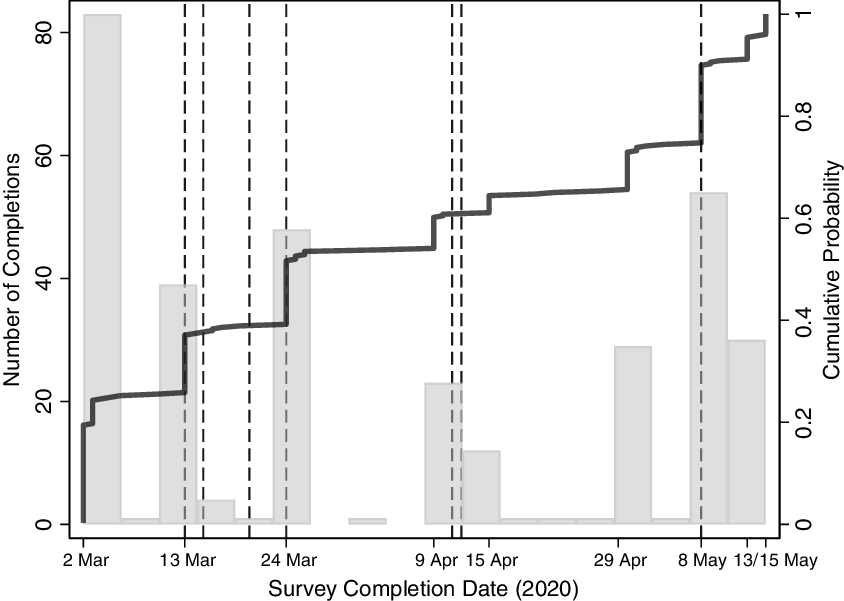
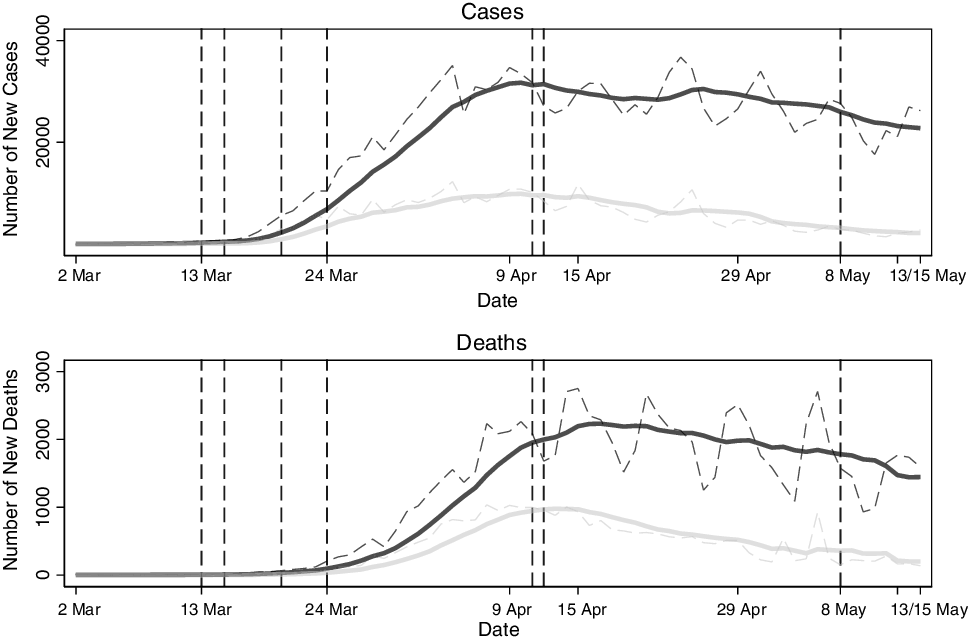
Our spring 2020 survey with 2nd and 5th year PhD students was the third and final annual survey in a series coordinated by the Council of Graduate Schools and implemented across a number of doctoral institutions. The survey was first fielded on March 2, 2020, before the news of COVID-19 reaching the university’s region or the anticipated impact of COVID-19 on the academic job market had broken, and concluded on May 15 (see Appendix Table C1 for a timeline of COVID-19 events). The survey was thus fielded prior to and following COVID-19 news being broken, and covered a period with significant fluctuation in recorded COVID-19 cases and deaths (see Figure 2).
Survey Responses Over Period of Study.
NOTES: This figure displays the number of completed surveys (light grey bars, which correspond to the left y-axis) and the cumulative distribution of completed surveys as more surveys are completed (black line, which corresponds to the right y-axis) by the survey completion day. Vertical black dashed lines indicate COVID-19-relevant cutoff dates. On the x-axis, we only label dates on which survey reminders were sent out to participants (see footnote 5).

To recruit participants, the survey team first obtained email addresses from the University’s online management system for all currently enrolled 2nd and 5th year PhD students. Using a university alias, the research team then sent all students invitations to participate in the survey, followed by scheduled email reminders. Footnote 4,Footnote 5 Participation was voluntary and students’ informed consent was elicited. Respondents were told that, should they wish to enter their information, they would receive a $10 Amazon.com gift card if they were among the first 200 respondents to complete the survey and claim the reward. Over 750 students received an initial invitation to complete the survey.
The questionnaire was programmed into Qualtrics survey software, included five sections that aimed to capture students’ career aspirations, priorities, and professional development, and took approximately 10 minutes to complete. To increase the statistical power of our tests and to address concerns about multiple comparisons, we combine individual survey items into six indices using inverse covariance weighting (Anderson Reference Anderson2008). Indices were chosen to facilitate testing of stated hypotheses, and they measure interest in (1) academic and (2) non-academic careers, investment in (3) academic vs. (4) non-academic skills, and desire for (5) academic vs. (6) non-academic job characteristics. We supplement these indices with a few individual survey measures, such as reported satisfaction with academic department support and preparation for one’s desired post-graduate career, where there were not multiple questions that could be combined into an index to evaluate a hypothesis. See Appendix Sections A and B for, respectively, survey text and details on which survey outcomes are used to create indices and to evaluate the hypotheses laid out in Section 3.
We take significant developments in COVID-19 as our “treatment” variable, under the assumption that the timing was as-if random as regards an individual’s probability of taking the survey. To estimate the causal effect of COVID-19 fallout on PhD students’ career aspirations and priorities, we can thus compare survey responses before and after critical moments in COVID-19. Blais et al. (Reference Blais, Bol, Giani and Loewen2020) use a similar identification strategy in their study on political attitudes, which was also fielded beginning March 2, 2020.
Following Blais et al. (Reference Blais, Bol, Giani and Loewen2020), we run four different specifications of an ordinary least squares regression model (see Appendix Section D). In the first, we regress outcomes of interest on a treatment indicator that demarcates whether a respondent completed the survey before news of COVID-19 and its economic impact broke, or after. Additional specifications incorporate the progressive spread of COVID-19 and introduce time trends (specification #2), include demographic variables as controls (#3), and account for any observed imbalance between subjects interviewed before and after the treatment cutoff using entropy balancing (Hainmueller (Reference Hainmueller2012), #4). As a placebo test, we run the same analysis on data from spring 2019.
Results
Descriptive statistics and balance
In total, 329 participants completed the survey, reflecting a response rate of approximately 44%. Footnote 6 Figure 1 displays survey responses, and Figure 2 the number of cases and deaths in the US and New York (a more localized reference point for students at the University), over the period of study. Figure 1 shows that responses are distributed across the period of study, with responses recorded for 33 distinct days in the period, and tend to peak on survey invitation and reminder email dates. Figure 2 reveals that cases and deaths began to reach large magnitudes in April, and that they stayed at a high level through the end of the survey period. Table 1 indicates that subjects across cutoffs were balanced on most demographic observables, with statistically significant differences inconsistently emerging on the percentage of women and white respondents. Footnote 7 Nevertheless, in specification 3 we include controls for all demographic variables for which we have sufficient data, and in specification 4 we conduct analysis using entropy balancing.
COVID-19 Cases, Deaths Over Period of Study (US and New York).
NOTES: This figure displays the number of recorded cases (top panel) and deaths (bottom panel) attributed to COVID-19 over the course of study. Black lines are for the entire US, and light grey lines for New York state only. Dashed lines are daily counts, and solid lines are 7-day averages. Vertical black dashed lines indicate COVID-19-relevant cutoff dates. On the x-axis, we only label dates on which survey reminders were sent out to participants (see footnote 5). Raw data used to generate these figures is publicly available on the following New York Times GitHub page: https://github.com/nytimes/covid-19-data.

Balance on Demographics: Full Sample
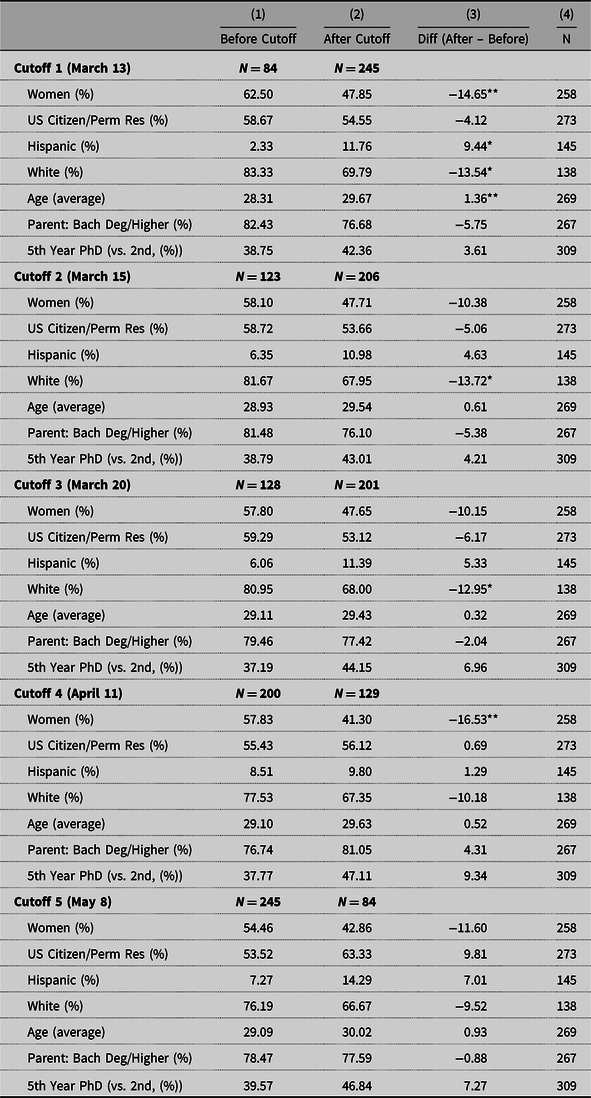
NOTES: *p < 0.1, **p < 0.05, ***p < 0.01.
Figure 2 indicates that the severity of the COVID-19 crisis was unlikely to be clear to respondents completing the survey at earlier dates in our survey, as the number of cases and deaths attributed to COVID-19 only began to accelerate in late March. In our analysis in the main text, we therefore mainly present effects using our latest specified cutoff, April 11, which in our data also corresponds closely to peaks in daily and 7-day average COVID-19 cases and deaths in the US and New York. We also consider a later cutoff, May 8, which is the first day that a respondent explicitly mentioned COVID-19 in an open-ended response. Responses later in the survey period, and beginning May 8 in particular, suggested that students were beginning to recognize the potential severity of the pandemic and its implications for job prospects. One wrote, “COVID19 might affect my answers to this, since I am worried about what the academic job market is going to look like (even though it was already very intense before this).” Another commented, “Devastating to consider that academia as we knew it is most likely gone now. I had solid job possibilities in talks already that will probably not exist when I’m finished with my degree.” We therefore consider May 8 as a cutoff though we acknowledge that it was not specified in our pre-analysis plan. Footnote 8 Appendix Section F also presents results for some earlier cutoff dates.
Evaluation of hypotheses
We begin by presenting in Table 2 effects in the aggregate using our four different specifications and two different cutoffs (April 11 and May 8). Footnote 9 We do not find strong support of our stated Hypotheses 1–4 on our full sample: there is some evidence that subjects after specified COVID-19 cutoff dates desire non-academic job characteristics, careers and skills more, and academic careers and skills less, but it is inconsistent and some findings run contrary. There is also some evidence that subjects after the May 8 cutoff are more likely to claim the gift card incentive, potentially signaling greater economic anxiety (H2). Contrary to expectation, there is some evidence that respondents after COVID-19 cutoffs feel that they can manage stress better, and that their academic departments are more supportive of, and have prepared them more effectively for, their desired post-graduate career.
Overall Effects by Cutoff Date
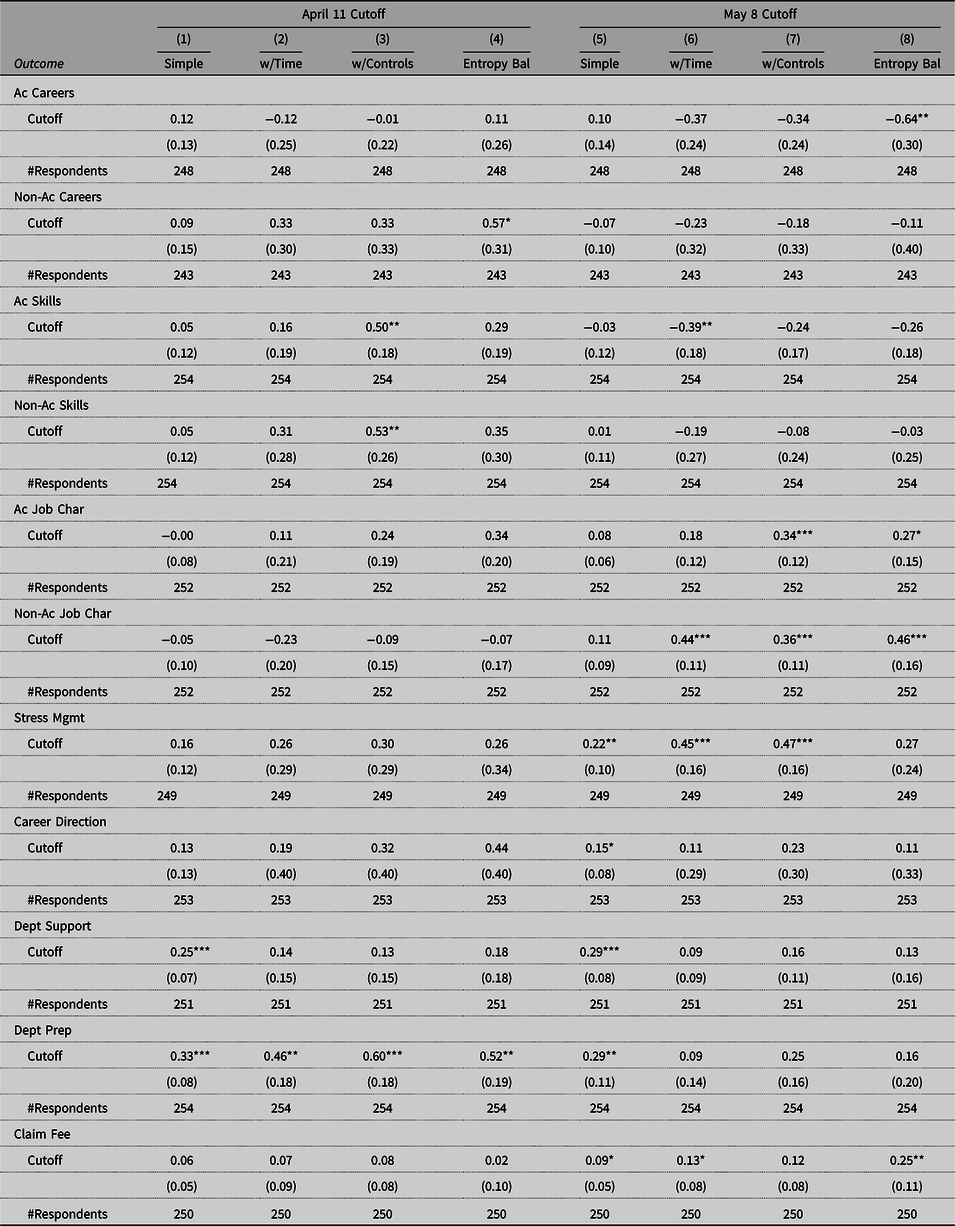
NOTES: *p < 0.1, **p < 0.05, ***p < 0.01. Standard errors clustered by survey completion day in parentheses.
Our first four hypotheses are grounded in the notion that COVID-19 and its associated economic fallout will change PhD students’ perceptions of their likely post-graduate career, their preferences for what they want in a career, and how well they feel prepared for their desired career. As we note in Hypothesis 5, 2nd year students may feel comparatively more insulated from career concerns than 5th year students and thus might be expected to respond less strongly to COVID-19 news. Table 3 offers some weak support for this hypothesis: 5th year students are more likely than 2nd year students to favor non-academic careers and non-academic job characteristics following COVID-19 cutoff dates.
Interaction Effects by Cutoff Date
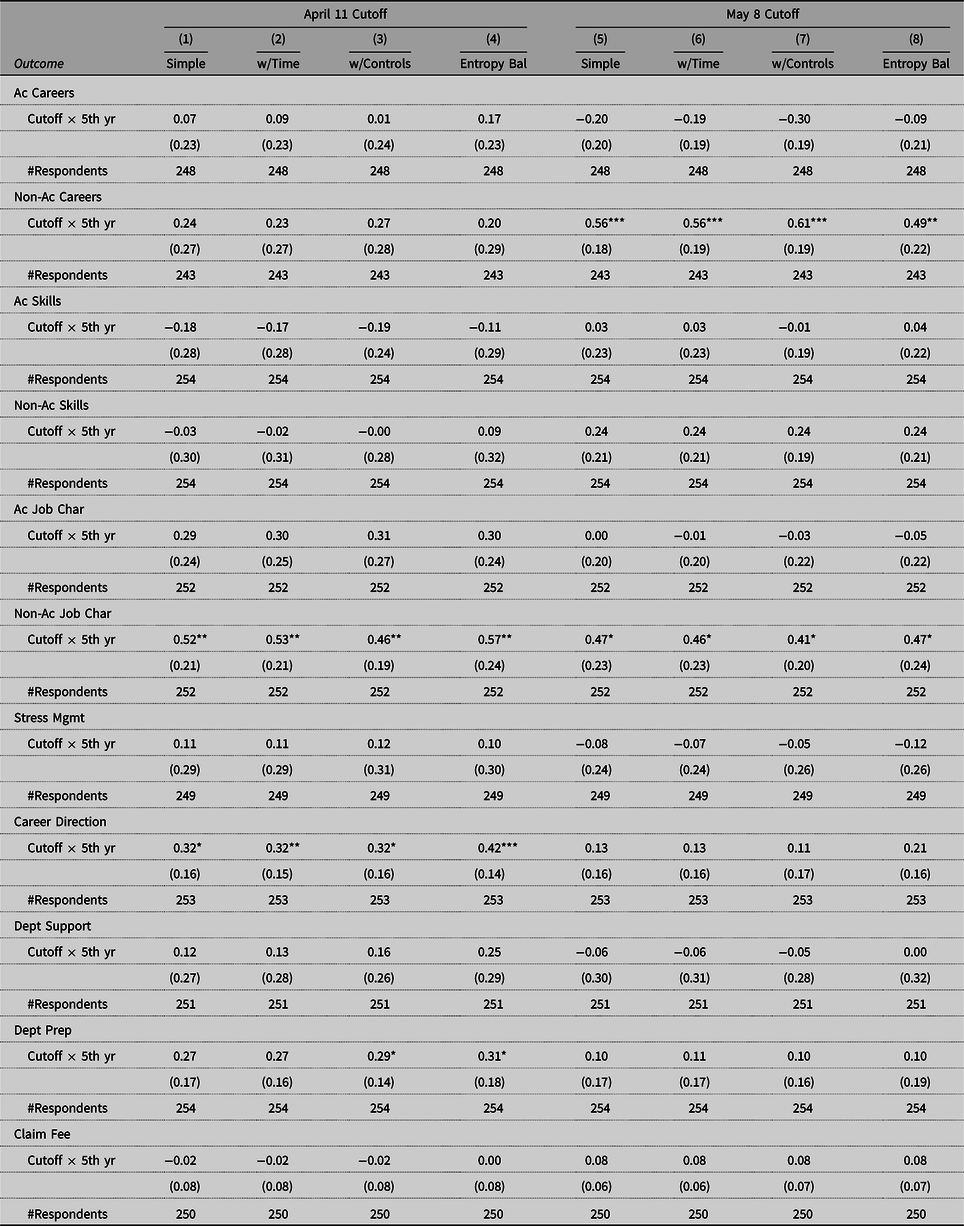
NOTES: *p < 0.1, **p < 0.05, ***p < 0.01. Standard errors clustered by survey completion day in parentheses. All regressions include component parts of interaction term, that is, indicators for the cutoff date and PhD year are entered as independent terms in the regressions but are not shown here to retain space.
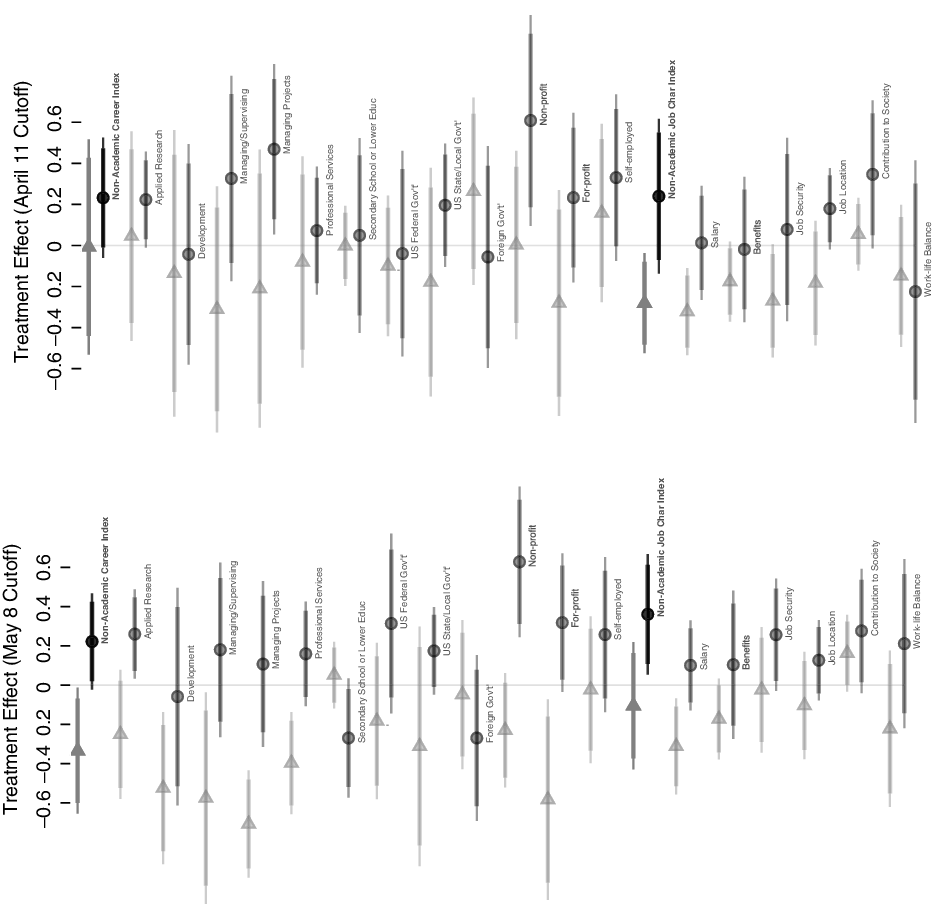
What is driving these heterogeneous effects? Figure 3 breaks down results on non-academic careers and job characteristics by index component parts for 2nd and 5th year students. A few findings are worth note. First, the figure provides some support for Hypotheses 1, 2, and 5: 5th year students following COVID-19 cutoff dates register more interest in non-academic careers in non-profit and for-profit industries (H1), appear to more highly value job characteristics not as readily associated with academia such as job location and security, salary and benefits, and contribution to society (H2), and these effects appear to be much stronger for 5th as compared with 2nd year students (H5). Second, it appears that some of the trends developing with our April 11 cutoff date become more exaggerated with our later cutoff date. Third, we find some evidence that 2nd year students particularly following the May 8 cutoff appear to sour on non-academic careers and job characteristics after the outbreak of COVID-19: they become less interested in applied research, management, development, non-profit and for-profit work, and professional services, and they appear to prioritize salary less.
Treatment Effects by PhD Year: Index Components.
NOTES: This figure plots treatment effects separately for 2nd (light grey with triangles) and 5th (black with circles) year students using our simple OLS specification. The top panel displays treatment effects for the April 11 cutoff date, and the bottom panel displays effects for the May 8 cutoff date. We show effects for two overall indices (bolded, non-academic career index and non-academic job characteristics index), followed by effects for their component parts on their original 1–5 scales, and labels refer to the outcome for the two most immediate intervals to their left. 90% and 95% confidence intervals are shown.
Appendix Section F probes the robustness of the results we present using data from the previous year’s survey in 2019. We find that the results we report are largely robust to these exercises and results increase our confidence that any changes we document are attributable to COVID-19 and not differences between early and late survey participants, or other differences between 2019 and 2020.
Discussion
We study how news about COVID-19 and its associated economic fallout and implications for the academic job market affected current 2nd and 5th year PhD students’ career aspirations and priorities. To do so, we compare PhD students’ responses to a career survey prior to and following significant developments in the US COVID-19 news cycle.
We do not find much support for the expectation that COVID-19 would powerfully alter PhD students’ aspirations and priorities. While there is some evidence that PhD students became more desirous of non-academic job characteristics and skills, evidence is limited and other findings run contrary. Contrary to expectation, we also find some evidence indicating that respondents feel that their academic departments are better meeting their needs, and that they are better able to manage stress, following the pandemic outbreak. We also find some evidence that 5th year students, perhaps because they are less insulated from the pernicious consequences of the pandemic, are more likely to embrace non-academic positions following the outbreak than are 2nd year students (who for some outcomes appear to pivot even more strongly toward academic careers). These findings only emerge for later cutoffs in our survey period, when the number of documented COVID-19 cases and deaths was peaking over the period.
How should we interpret these results? There are a few reasons why we might not have observed that COVID-19 led many students away from academic aspirations. First, it is possible that COVID-19 was an insufficient shock to students’ commitment to an academic career. Research has shown that many PhD students pursue academia despite knowledge of a challenging job market (Roach and Sauermann Reference Roach and Sauermann2017; Woolston Reference Woolston2017); those who had committed to academia despite an already very difficult job market might not have been swayed by the pandemic. Further, students, particularly those who are more junior, may have viewed the pandemic as creating a temporary negative shock, and thus may have felt that their long-term prospects remained largely unchanged.
A second possibility is that the efforts of departments and universities to blunt some of the worst consequences of the pandemic were effective at reducing students’ concerns. Although no agreement had been reached during the survey period, discussions regarding extension of graduate student funding due to the pandemic were already in process, a fact of which many students were well aware. Indeed, a third possibility for which we find some evidence is that the pandemic may have reaffirmed some students’ commitment to academia. Students who are more satisfied with their academic departments may be more eager to seek out academic careers; those who anticipated receiving more future funding than they would have otherwise could have even updated positively about the academic market.
A fourth possibility is that the cutoffs we consider were too early to capture more substantial effects. Footnote 10 The effects we report begin to emerge when considering cutoffs in late March only, and the first mention of COVID-19 in an open-ended response occurred on May 8. It is possible that students were still processing the consequences of COVID-19, and that they would have offered more pessimistic opinions had we surveyed them later. While this is certainly possible, evidence that students view their departments more favorably at later cutoffs suggests that there might be some countervailing forces. Nevertheless, we hope that future work will consider longer-term effects of the pandemic on career aspirations, in particular by investigating responses from students who graduated in summer and early fall 2020.
Why do some students report lesser stress, and greater satisfaction with academic career support and preparation, following pandemic cutoffs? First, students may have been pleased with the efforts taken by their departments and universities to mitigate pandemic consequences, as detailed above. Faculty were especially vocal in advocating for their graduate students during this time, in some instances allying with their doctoral students as they requested a number of protections from the University. Such efforts, and the frequent communication by many departments’ directors of graduate study, may have been received favorably and may have helped to reduce student stress. We acknowledge that our findings might not be as applicable to less well-resourced schools. Second, some departments may have become more welcoming and encouraging of non-academic careers, which could also work to increase the mental health of graduate students considering such paths. We also highlight this as a potential area for future research, which may reveal department strategies that proved particularly successful and which could be exported elsewhere.
While results show some reasons for optimism, they also indicate that the gap between demand for and supply of academic positions may continue to grow in the wake of the pandemic, as changes in demand in our sample do not appear to keep up with sharp expected decreases in supply. While we cannot know how well our results will speak to other cases, we hope to move this literature forward by providing new information and data against which others can compare their own.
Supplementary material
To view supplementary material for this article, please visit https://doi.org/10.1017/XPS.2020.34


 Open access