

This study looks at antiquities trafficking in conflict zones, taking Syria as a case study, a country that has faced a decade of ceaseless civil strife and that, today, is risking losing much of its cultural heritage due to military destruction, looting, and pillaging. The key objective of this work is to assess the efficiency of a quantitative method mixing statistical and mapping techniques to analyze the occurrence of looting and trafficking of antiquities in conflict scenarios. The research will be structured through five main sections: (1) the first will introduce the definitions needed to specify key terminology in cultural heritage crime, followed by a literature review of antiquities crime and a choice of Syria as a study case; (2) the second section will involve detailing the data collected for the study and its visualization on maps through either thematic or count-based maps; (3) the third section looks at the mapping and satellite analysis of clusters and hotspots of looting and theft through Kernel density estimation (KDE) and dual KDE mapping; and (4) the fourth section, which considers instead a regression model assessing the statistical significance of the hotspots identified.
Definitions
The field of enquiry of antiquities trafficking faces a lack of clarity in the use of concepts that are often used interchangeably despite carrying slightly different meanings, connotation, and theoretical underpinnings. To avoid misinterpretations and confusion, a terminological note is necessary. “Antiquities” will refer to cultural goods, cultural property, patrimony, artifacts, and artwork held both by public or private entities or in unknown locations.Footnote 3 This study uses “antiquities” as the main term to refer to all objects that are of archaeological, historical, artistic, and cultural importance for a nation’s heritage and collective identity. “Antiquities trafficking” is often synonym of “illicit antiquities trade,” “illegal heritage trafficking,” or even “cultural racketeering.” For the purpose of this study, “antiquities trafficking” and “illicit antiquities trade” will be used interchangeably and will refer to the network of operations aimed at transporting looted and/or stolen antiquities abroad. “Looting” refers to the act of illegal excavation aimed at finding antiquities previously unknown. This criminal activity always involves excavation and happens in locations where looters believe with no absolute guarantee that antiquities are buried in the ground. “Theft” is used to refer to the removal of known antiquities from their prior established and known location. This criminal activity does not involve excavation and is more likely to happen in renown and open archaeological sites, museums, collections, or any location where the presence of antiquities is certain.
Brief literature review on antiquities crime
Antiquities trafficking and organized crime
As academic researchers have put it, “we are failing in our responsibility to conserve (and convince others to conserve) the world’s archaeological heritage.”Footnote 4 Studies in antiquities trafficking show that a significant part of the damage to the world’s heritage is been done by a growing illegal economy of stolen art and looted antiquities.Footnote 5 In the last half a century in fact, art and antiquities acquisition has become renowned amongst experts, law enforcement agencies, and, to some extent, also amongst the general public, as an instrument of money laundering for organized criminal groups and mafias.Footnote 6 Loose international regulation of the licit antiquities market provides a ready environment for the laundering of unprovenanced and stolen artifacts into pieces proudly exhibited in museums and private collections.Footnote 7 Such a context is prone for the involvement of organized crime groups well placed to organize or tap into pre-existing networks to transport, promote, and sell illicit antiquities on the same marketplace of legal ones.Footnote 8
Antiquities trafficking and conflict
The phenomenon of antiquities looting and smuggling is also growingly associated with localized conflict, when fighting militias and especially non-state actors resolve to heritage trafficking as a way to guarantee revenue to fund armed insurgency.Footnote 9 In conflict contexts, moreover, looting comes hand in hand with outright destruction of heritage. Even beyond insurgency, antiquities trafficking has been also increasingly associated with international terrorism, especially after the world witnessed Islamic State (IS) fighters bombing and ransacking the World Heritage Site of Palmyra in Syria in 2015. In 2018, the Spanish national police launched Operation Harmakhis to investigate the trafficking of antiquities from Libya’s Cyrenaica region to fund al-Qaida cells in North Africa.Footnote 10
Overall, empirical research looking at the relation between heritage trafficking, conflict, and terrorism financing suggests that terrorist organizations do benefit from the illicit heritage trade in three main ways: (1) by directly excavating antiquities; (2) by directly obtaining antiquities; or (3) by facilitating their transportation and trade.Footnote 11
Source versus market research
Concerning the academic literature on antiquities trafficking, critiques have it broadly split between research focusing on either the start (source) or the end (market) of the trafficking supply chain. In a 2013 article, Neil Brodie and Simon Mackenzie, two of the most prolific scholars on the illicit antiquities trade, explained this split as a matter of both research focus and research methods used by scholars.Footnote 12 Research on the starting point of the supply chain focuses on “source countries” and, therefore, on the illegal excavations, looting, and theft of antiquities from their original site. These types of research have been mostly tied to qualitative methodologies of data collection, involving direct fieldwork and interviews with looters and traffickers.Footnote 13 Research focusing on the end point of the supply chain focuses instead on so-called “market countries,” using quantitative and statistical research methods to study the workings of the trade and consumption of antiquities.Footnote 14
Quantitative research on looting estimation
Quantitative studies have mostly been concerned with estimating the damage caused by looting and trafficking in archaeological sitesFootnote 15 or with estimating the magnitude of the business at market level. Studies at the site level have involved damage estimation of sites through pedestrian surveys, where teams of archaeologists would systematically analyze a site to record signs of looting.Footnote 16 These techniques today have mostly been substituted with less labor-intensive methods such as satellite imageryFootnote 17 and machine-learning algorithms,Footnote 18 emerging especially after the devastating consequences from the US invasion of Iraq.Footnote 19
The growing use of satellite imagery is a direct development of the use of photography in forensic archaeology, where photography was extensively used for the protection, identification, and recovery of antiquities.Footnote 20 Today, research relying on satellite imagery analysis has developed methods to measure the extent of looting through pre-images and after-images of archaeological and heritage sites, where photographic evidence from pre-looting periods can be used as a benchmark to assess present-day looting.Footnote 21 Especially in contexts where fieldwork is not possible, the use of satellite imagery has become very useful in monitoring archaeological sites in conflict countries such as Afghanistan, Iraq, and, most recently, Syria.Footnote 22
Quantitative research though crime mapping
Quite unexpectedly, however, the increased use of satellite imagery has not been combined with a more extensive use of crime-mapping techniques. Maps and mapmaking have been mostly used to assess and visualize the count or density of episodes in a specific location.Footnote 23 Similarly, the Washington-based non-profit Antiquities Coalition has invested a great deal of time and resources in the creation of the #Culture under Threat Map, partnering with Hexagon Geospatial to utilize open source intelligence to produce a digital map that shows locations of antiquities theft, looting, and destruction in the Middle East.Footnote 24 Aside from these important attempts at mapping the extent of heritage damage in the Middle East, there is hardly any research done on antiquities trafficking that attempts to map the most statistically significant locations of antiquities crime and correlate it with the analyses from satellite imagery. Therefore, this remains an area of enquiry that is open to further developments.
Why Syria? Aims and purposes of this case study
Most scholars and specialized archaeologists agree that Syria’s archaeological heritage was one of the richest in the whole of the Middle East region.Footnote 25 This was the case at least up to the beginning of the present civil war, a conflict that, since the outbreak of the Syrian revolution in 2011, has turned into a civil and international war, devastating its people and the country and producing irreversible damage to Syrian cultural heritage.Footnote 26 This study will assess whether Syria can be taken as an exemplary case study of today’s antiquities-trafficking business in conflict countries. In the past 10 years, Syria has been the world’s greatest victim of human and heritage loss, a total destruction caused by the internationalization of a localized conflict.Footnote 27 Looting and theft of Syria’s heritage have been reported on since the beginning of the conflict, with perpetrators coming from the local population, armed militias, and organized criminal groups alike.Footnote 28 The availability of such extensive reporting and an international focus is a main reason to choose Syria as a case study, suggesting that data must be lying somewhere.Footnote 29
Finally, the choice of this case study was also moved by personal motives. Having recently spent three years living and working on the Syrian-Lebanese border, the first author of this work has directly witnessed the immeasurable struggle for life that millions of Syrian civilians are put through every day since the start of the conflict. The sorrow for the destruction of their beloved country and its invaluable cultural treasures is a wound that might never heal.
Data collection and visualization
For its qualitative approach, this study conducted an open source enquiry directed at organizations, professionals, and activist groups that have had, or are still having, a role in monitoring the extent of the looting and trafficking damage in Syria. The aim was to bring together a series of quantitative datasets with hypothetical explanatory or statistical value in relation to antiquities trafficking in the country. Multiple sources were contacted over the period from January to June 2020, through a multi-step process involving:
-
• requesting access to data (both if openly available or on restricted access);
-
• gaining access to data;
-
• assessing the literature for data’s relevance;
-
• checking for data’s completeness and reliability; and
-
• recompiling the data in a unified database.
This first stage of open source research revealed a surprisingly high number of interested organizations, professionals, and activists interested in the research and available to share data. Table 1 includes the list of the databases sourced and used in this study’s analysis as well as the names of the organizations who provided the data. Following the table, each of the specific datasets is briefly introduced.
Sources for quantitative data on Syrian antiquities trafficking

Source: David L. Suber, University College London, 2021.
Locations of looting, theft, and destruction of Syrian antiquities
In 2014, the ASOR initiated an international collaboration between scholars in the United States, Europe, and the Middle East, known as the Cultural Heritage Initiative (CHI), with the aim of gathering open source intelligence to document cultural heritage at risk in Syria and Iraq.Footnote 30 By producing detailed reports on a monthly basis between 2014 and 2018, the ASOR CHI was able to build a detailed database of information on locations reporting heritage damage in Syria and Iraq. This data, received from the ASOR CHI, was organized in three distinct files: (1) incident reports published on their website; (2) unpublished heritage observations made by archaeologists in the field; and (3) satellite assessments run by ASOR’s geospatial team, also still unpublished. For the purpose of this research, the three files were collated, and the data was carefully cleaned of all events that were not related to either looting or theft (that is, all episodes of collateral military damage) were re-categorized along with two main distinguished variables: (1) the type of damage action, distinguishing whether a specific site had been raided as part of a military activity, looted, or had been the victim of theft and (2) the site type, distinguishing between religious and secular sites, archaeological sites, or museums.
The data from the ASOR CHI was the most important dataset sourced during the data collection phase, as it provided, after the data-cleaning phase, a clear representation of all locations in Syria where antiquities looting, theft, or destruction was happening and where looting or theft intentions and co-occurrence had been denounced between 2014 and 2018. This was the data that was used as a dependent variable in the following analysis and that gave the temporal coordinates (2014–18) for all other relevant variables (see Figure 1).
Distribution theft, looting, and heritage destruction events in Syria (courtesy of Luca Mazzali, Appears Pro, 2020).

Location of all archaeological sites in Syria
Another important dataset was provided by ARCHI UK Maps, an open source geo-localization database that catalogues the location of world heritage (United Nations Educational, Scientific and Cultural Organization), archaeological, and historical heritage sites all over the world. This information was gathered from their website through multiple web-scraping searches, informing this research’s database with the basic opportunity structure for looting in Syria, as archaeological sites and museums are attractors of antiquities crime by definition.
Location of all museums in Syria
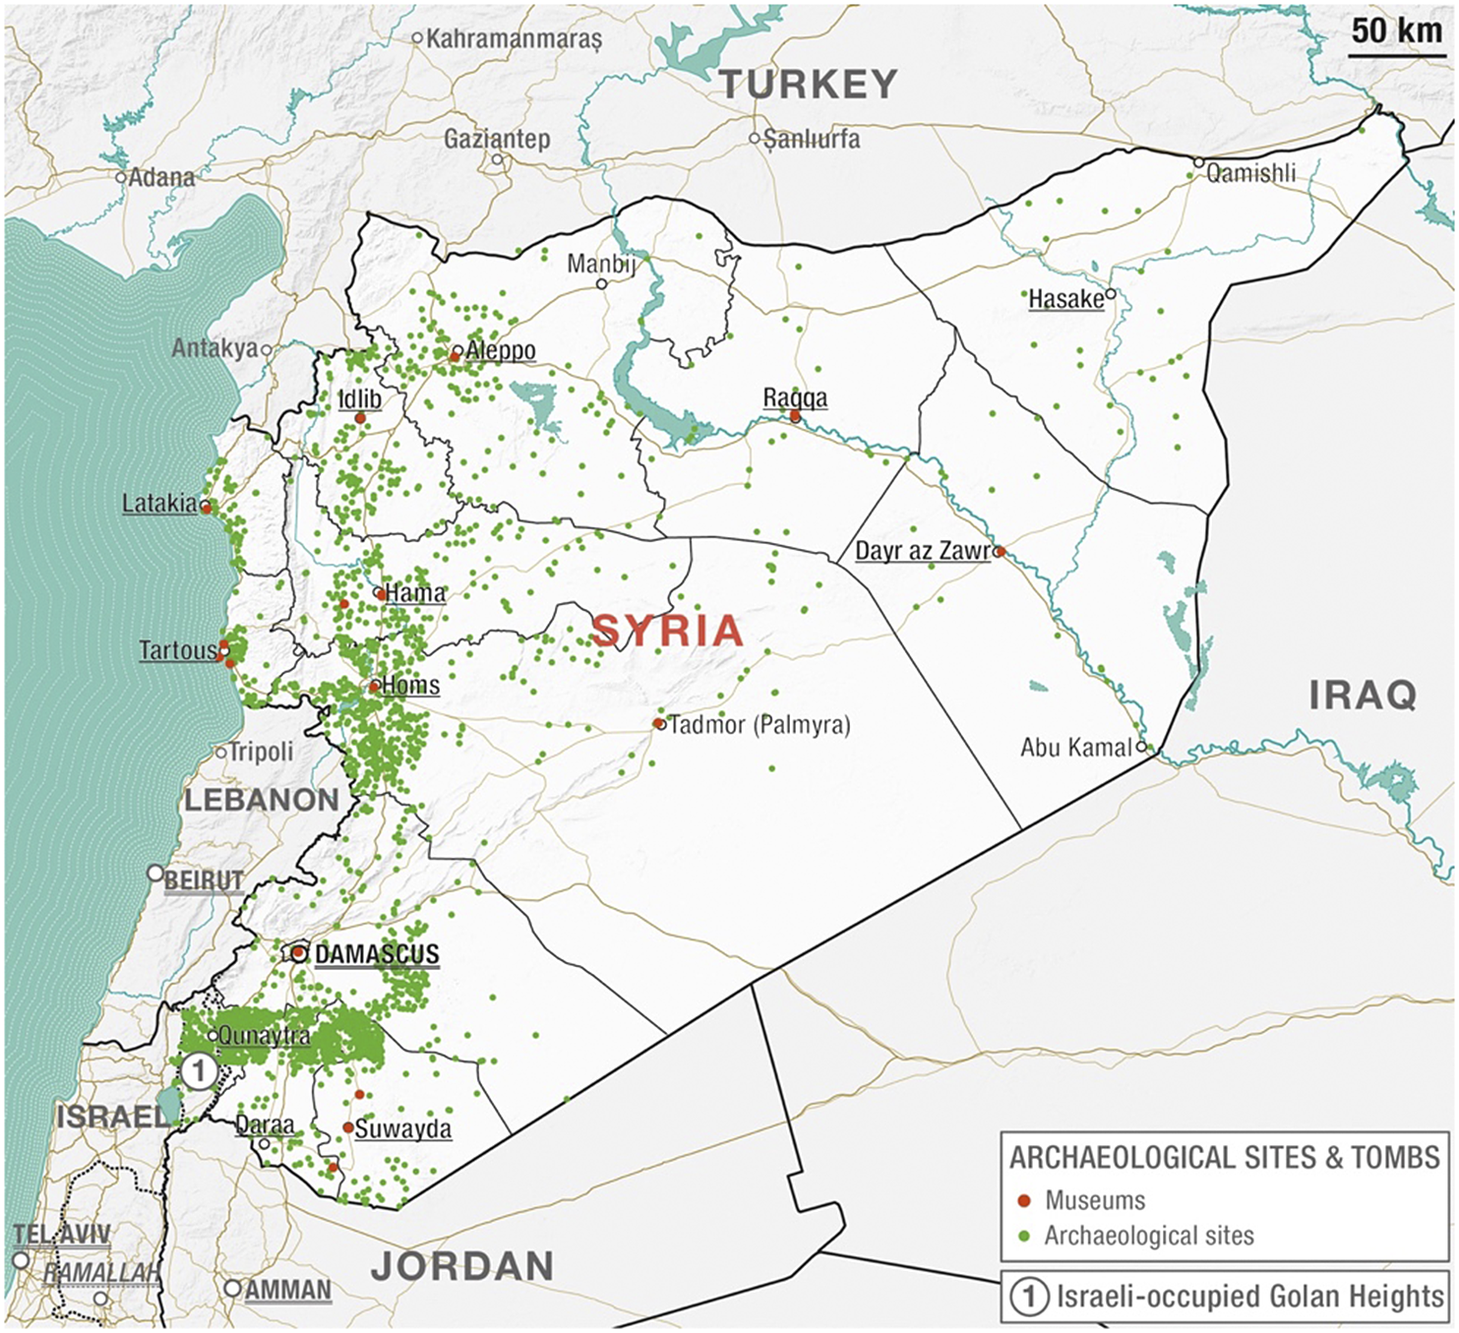
The Washington-based organization Antiquities Coalition integrated the list of Syria’s archaeological sites by providing access to their “Syria museums location” data included in their open source Culture under Threat smart app. This data was manually extracted in order to integrate Syrian museum sites with the ARCHI UK map of all archaeological sites in Syria, as museums have been a reported target of antiquities thieves during the war (see Figure 2).Footnote 31
Distribution of archaeological sites and museums in Syria (courtesy of Luca Mazzali, Appears Pro, 2020).
Political instability
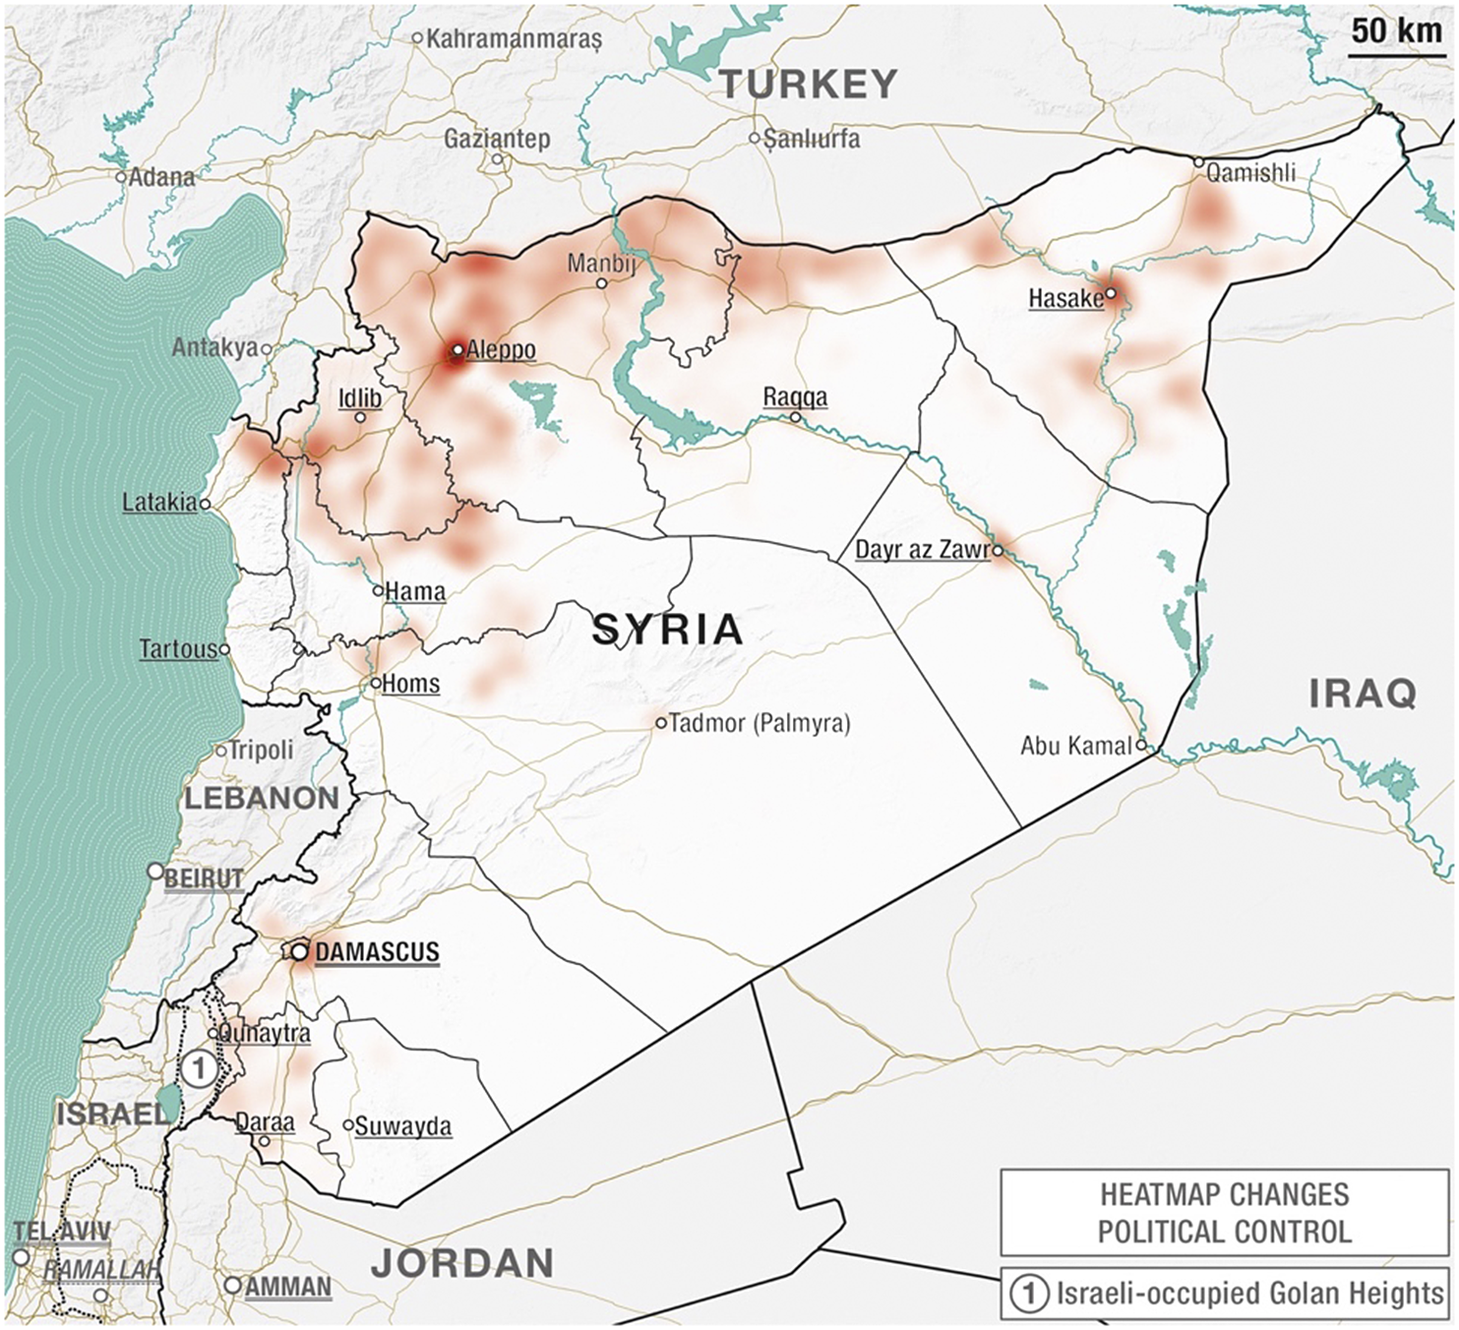
To account for the conflict situation in Syria, some form of measure of political turmoil needed to be found. A number of organizations have been monitoring the progression of the Syrian conflict, one of the most complicated and violent conflicts of recent history. Amongst the many institutes contacted, however, the most complete database was the one provided by the US-based Carter Centre. As part of their Support for Peace in Syria Initiative, the Carter Centre, similarly to the ASOR CHI, had issued conflict-mapping and analysis reports on a monthly basis, reporting the valuable information of which territories were shifting political control throughout the fighting and labeling actors in charge or territory as different groups emerged on the scene. The specificity of this data allowed us to calculate how many times a territory has changed political control during the conflict and, hence, provide a measure of how “unstable” that territory had been during the conflict, assuming that shifts of political control during a civil war imply political instability (see Figure 3).Footnote 32
Heatmap of changes of political control in Syria (courtesy of Luca Mazzali, Appears Pro, 2020.
Distance to border data
Helpful insights were provided by Michael Frith, a researcher at the UCL Security and Crime Science department, who was driven by interest into this research data collection process and helpfully shared data that he had processed to calculate the distance of inhabited locations to Syria’s international borders, data that he had been using himself for agent-based modeling of Syrian refugee’s internal and international displacement during the civil war. Frith’s dataset was very helpful in including a distance-to-border variable with potential explanatory power of cross-border trafficking dynamics.Footnote 33
Food insecurity
Looting is also a factor of the population’s economic condition, as the local population will turn to looting and antiquities theft when faced with economic and political hardship as the results of war.Footnote 34 In order to have a measure of the economic situation in different areas of the country, a food insecurity measure was calculated, using data from the World Food Program’s Integrated Platform for Hunger Analytics, which provided measures of the inflation of wages and inflation of food prices in Syria from 2015 to 2019. According to literature on the topic, a measure of food insecurity can be calculated as the quotient between the inflation of wages and the inflation of food prices.Footnote 35 Measures were converted and calculated in US dollars according to the correspondence rate at different points in time, so as to account for the huge volatility of inflation suffered by the Syrian currency throughout the conflict.
Administrative boundaries, population, and populated areas
Finally, for information on the administrative boundaries for Syria and data on Syria’s population (calculated through the 2004 census and its 2011 projection) and data on the geographical distribution of populated areas (cities, towns, and villages) in Syria, visualization-utilizing geographic information system (GIS) processing tools were accessed through the United Nations (UN) Office for Coordination and Humanitarian Affairs (OCHA) and Humanitarian Data Exchange online portal.
Quantitative methods analyses
Once the data was sourced, all datasets were formatted to provide the structural basis for four different analyses of the data:
-
• nearest neighbor analysis to control for non-random spatial clustering of looting;
-
• visualizing descripting thematic mapping (GIS);
-
• crime-mapping analysis (heat maps and hotspots);
-
• satellite analysis of hotspots; and
-
• regression analysis for variables’ significance.
Near-neighbor analysis of dependent variables (DV)
Checking for the spatial concentration of crime is a crucial first step to start the crime-mapping analysis of the looting and theft data. This can be done by running global tests for spatial clustering and, in particular, conducting a nearest neighbor analysis to calculate the nearest neighbor index (NNI) measuring how clustered the looting and theft data is in space. Running a nearest-neighbor analysis on CrimeStat provided the results shown in Table 2.
Results from nearest-neighbor analysis on looting and theft DVs
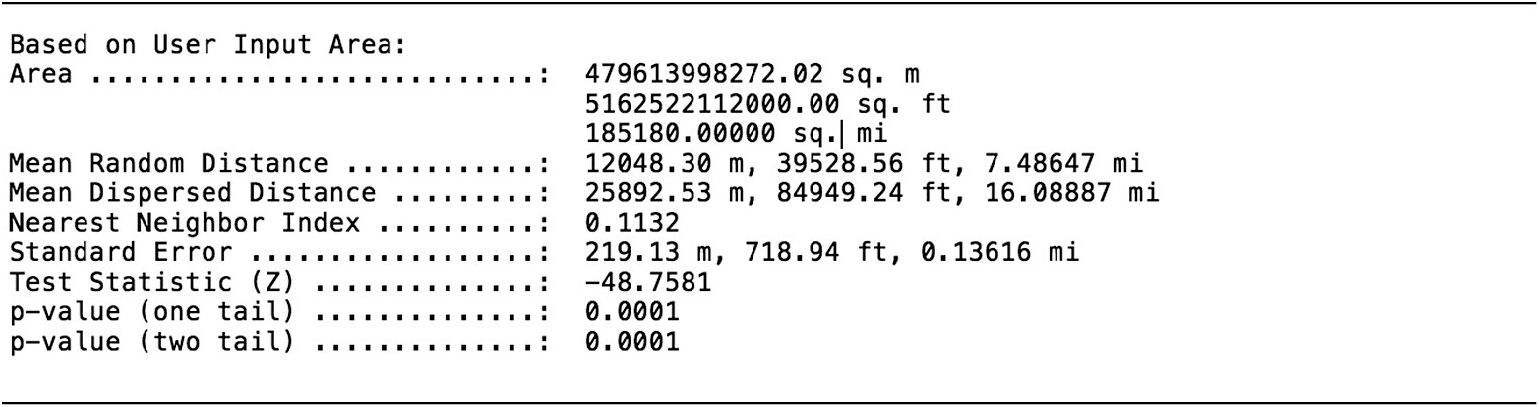
Source: David L. Suber, University College London, CrimeStat, version 3.0, 2021.
The NNI being < 1 indicates that crime is clustered in space and suggests that there will be looting hotspots to be identified further in the analysis. However, the NNI in itself is only a descriptive statistic and does not indicate whether any spatial clustering is statistically significant. The Z-score does test for significance, with values between –1.96 and +1.96 being non-significant, values < –1.96 indicating that crime events are significantly spatially clustered and values > 1.96 indicating that crime events are significantly dispersed. In the case of looting and theft DVs, the test statistic indicates that looting and theft of antiquities are significantly clustered in space.
Figure 4 shows a thematic map of the calculation of looting and theft at Syria’s subdistrict level. Excluding the highly targeted region of Palmyra (a site that has witnessed multiple looting events due to its world famous ruins), the map shows that the areas most targeted by looting are principally in northeastern region along the Euphrates River, in the northwestern regions around Idlib and Aleppo, and in the very southwestern region bordering the Israeli-occupied Golan heights and Jordan. This thematic visualization of significantly clustered locations from where antiquities have been looted and stolen confirms that further hotspot analysis is needed.
Thematic map showing the count of looting and theft (2014–18) in Syria at the sub-district level (courtesy of Luca Mazzali, Appears Pro, 2020).

Thematic mapping of independent variables (IVs)
After having verified that the DV of antiquities looting and theft events is spatially distributed in a meaningful and non-random way, this analysis moves on to look at the distribution of all hypothesized IVs that could hold explanatory and predictive power on antiquities looting and theft.Footnote 36 Table 3 shows the list of all variables provided, with the adjusted timing of the data considered to normalize the time bracket according to the initially different period of data availability.
List of variables used for crime mapping and regression analysis
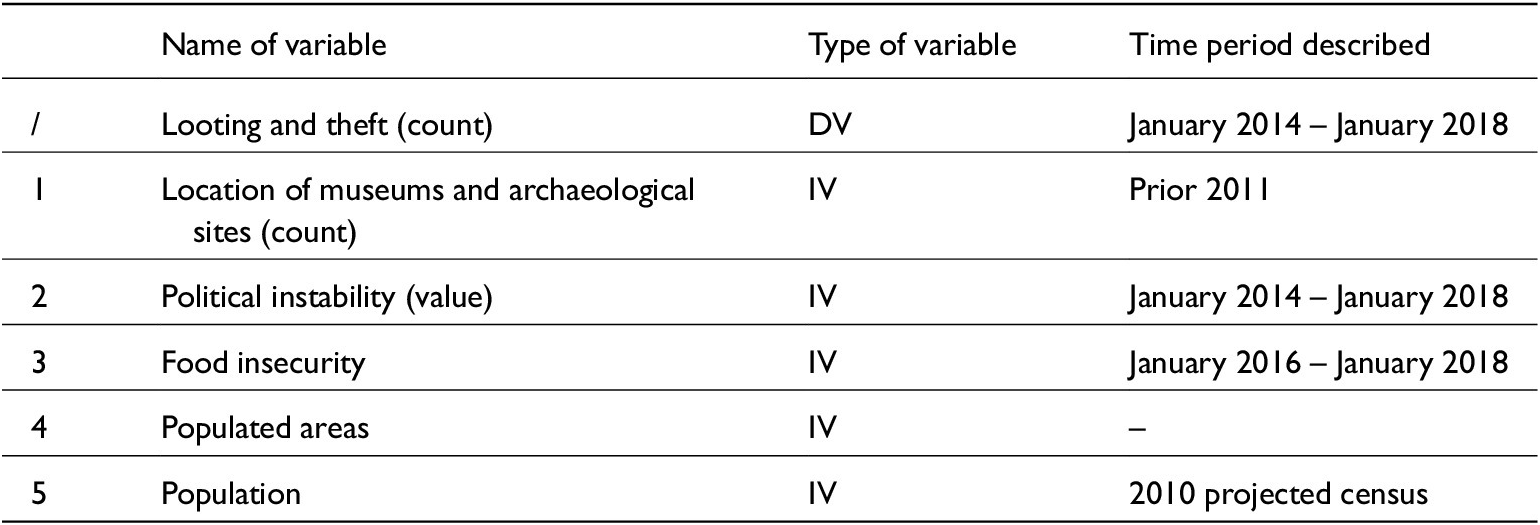
Source: David L. Suber, University College London, 2021.
Locations of museums and archaeological sites
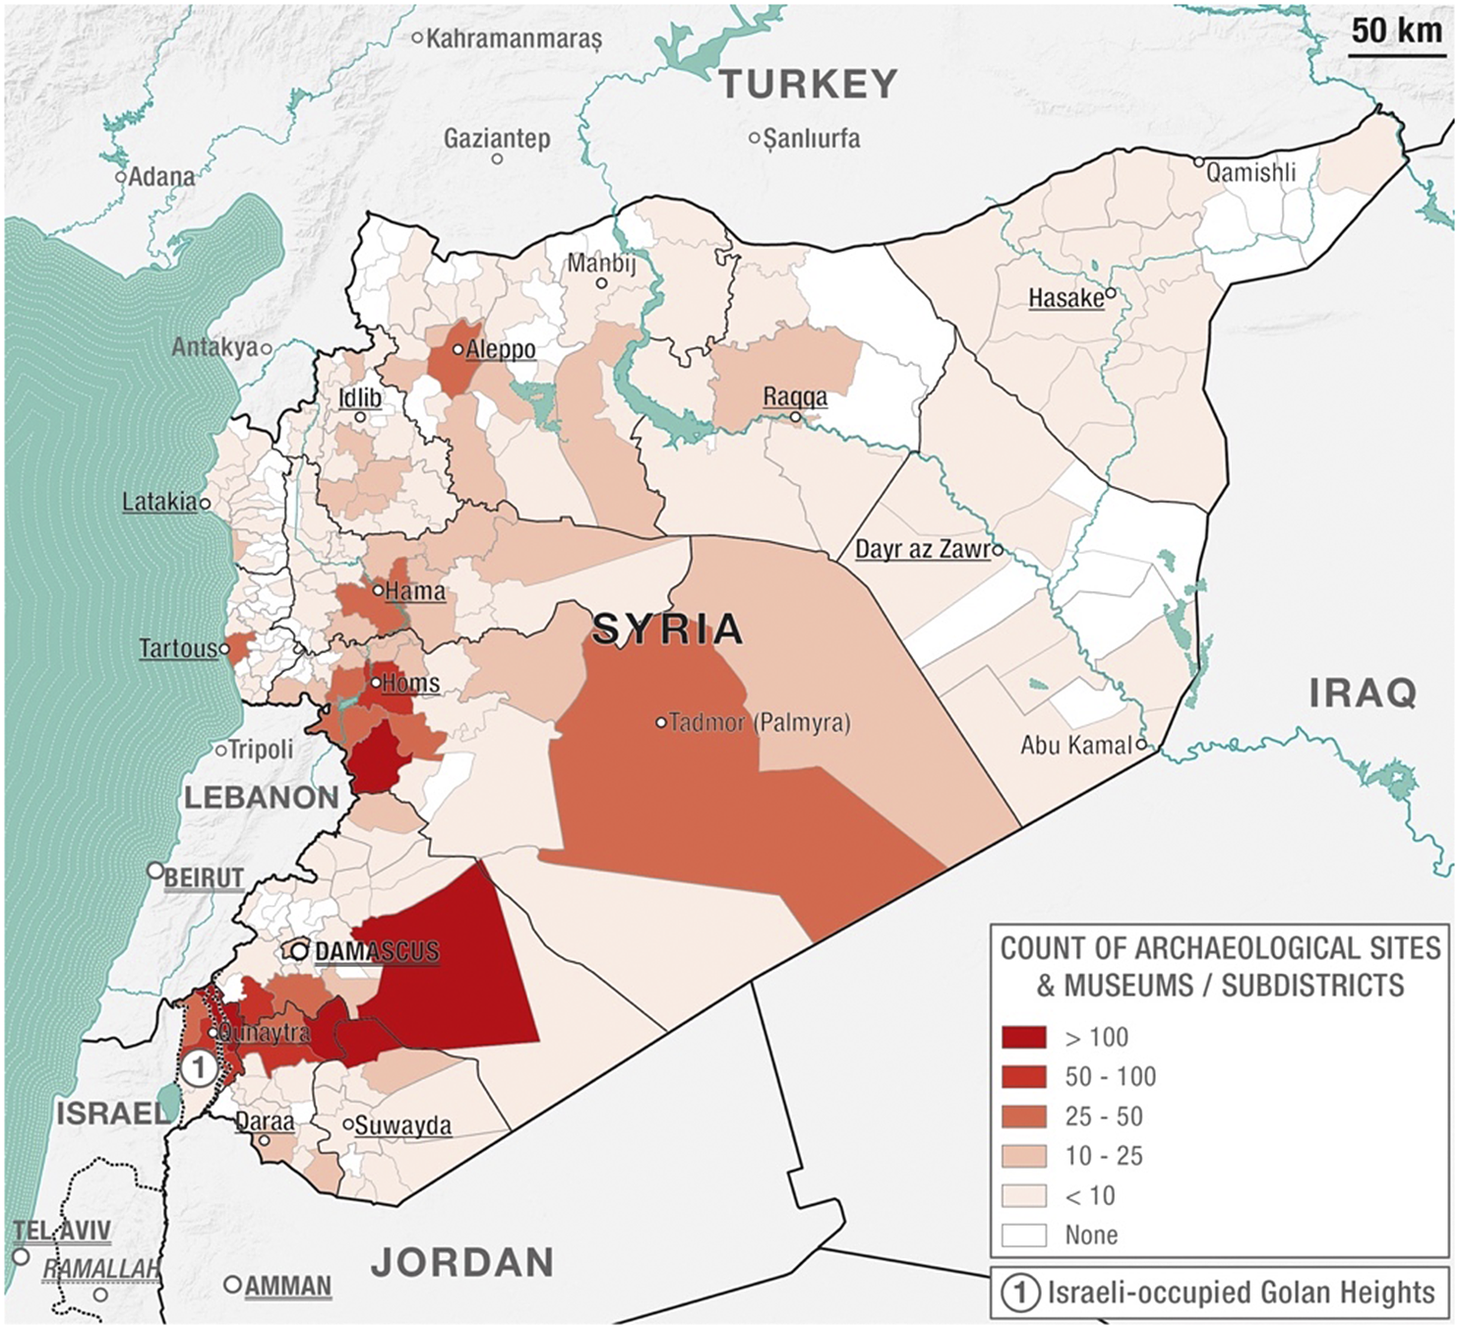
Figure 5 shows the distribution of museums and archaeological sites in Syria before 2011. The map is an important indicator of the opportunity structure for antiquities looting and theft, providing an overview of where most of the known locations at risk are. The higher volume of these are in the regions southeast of Damascus, around the city of Homs, Hama, Aleppo, and Palmyra, with lesser densities in the Euphrates Valley.
Thematic map showing the count of museums and archaeological sites in Syria prior to 2011 (courtesy of Luca Mazzali, Appears Pro, 2020).
Political instability
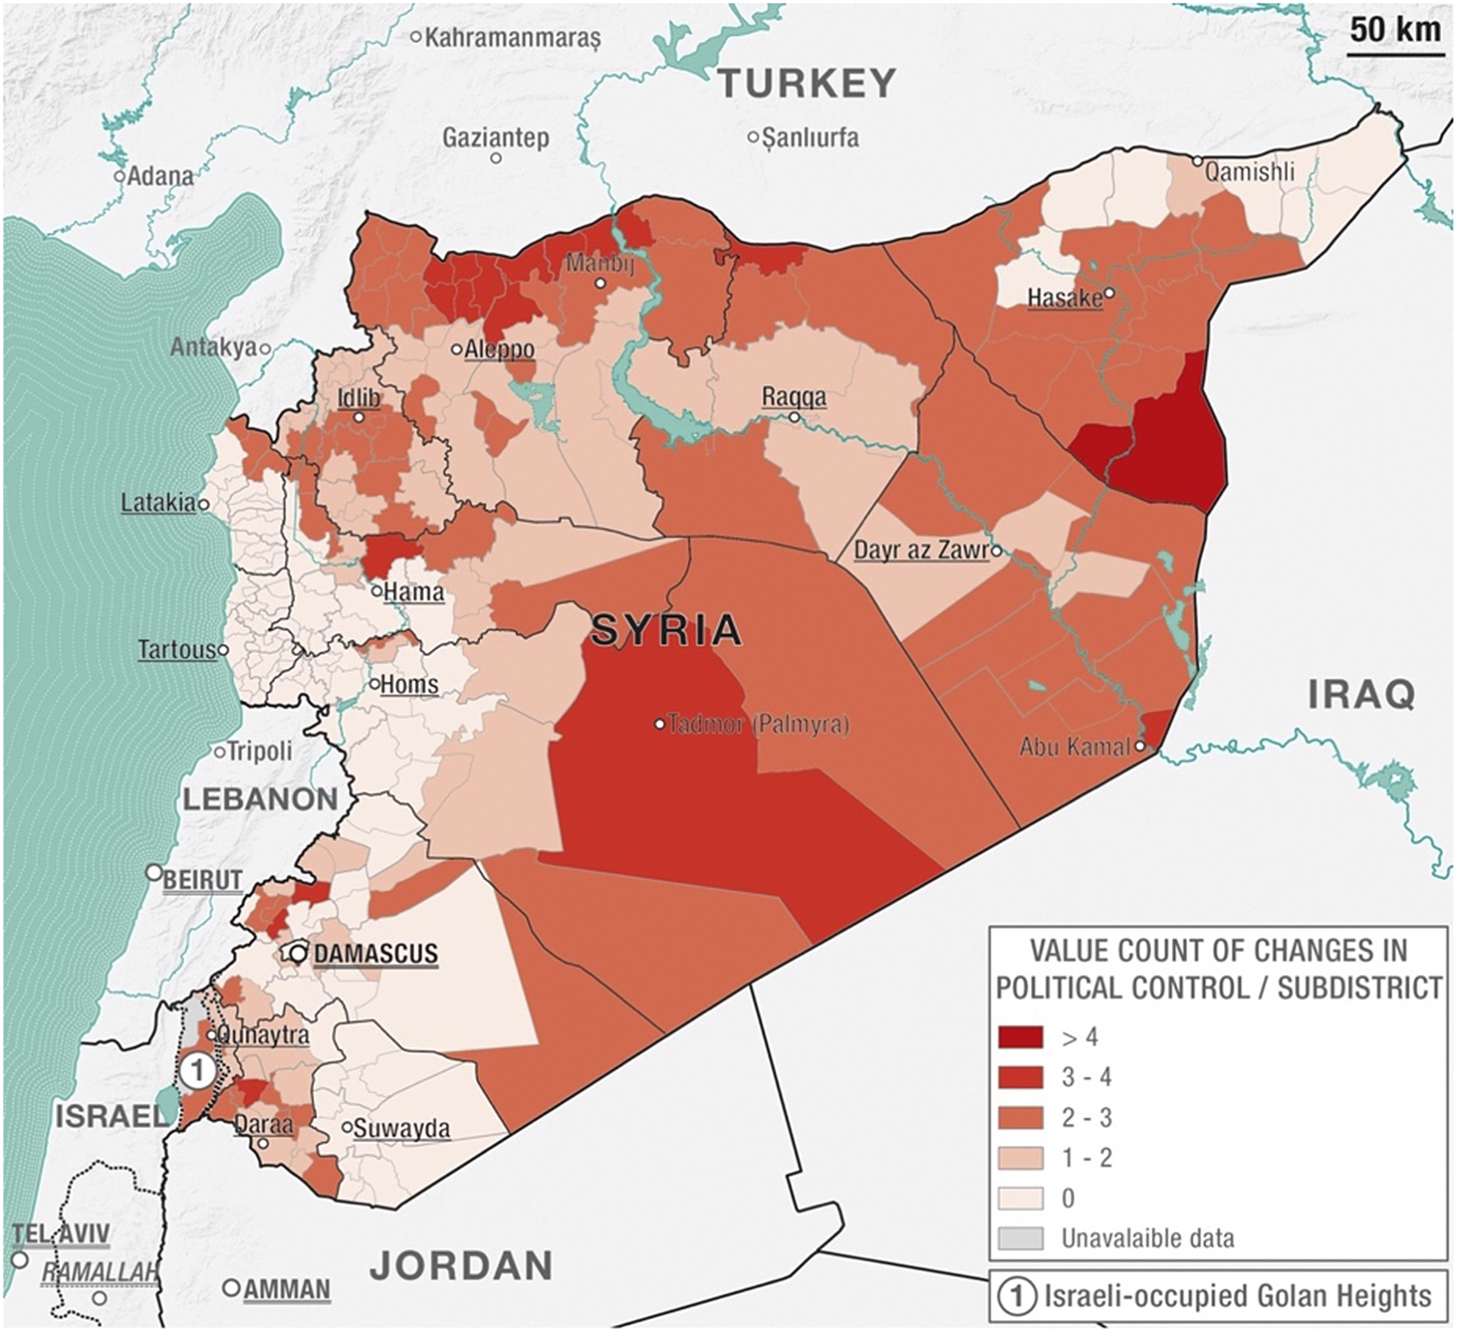
The political instability variable shows how many times a sub-district (nahiyya in Arabic) in Syria has changed political control. This variable provides a measure of “political instability” assuming that the more an area faces changes in political control, the more unstable it is.Footnote 37 In a country at war, this might be a meaningful variable related to looting and trafficking events.
The thematic map in Figure 6 shows that a major area of the country was affected by numerous shifting levels of political control. The north and eastern areas of the country were the major battlegrounds between the anti-IS coalition and IS militias from 2014 and 2016, while the western part of the country between Idlib and Hama is the area where high levels of fighting were recorded at the beginning of the conflict and are still occurring today.Footnote 38 On the other hand, areas that are showing lesser political shifts are the regions of Latakia and Tartous – regime strongholds – reaching all the way down to Hama and Homs, which were areas of intense regime-rebel fighting in the early part of the conflict (2011–2013) and, hence, unrepresented in the current dataset.
Thematic map showing the sum of values related to political control changes in each sub-district of Syria (courtesy of Luca Mazzali, Appears Pro, 2020).
Food insecurity
The food insecurity measure is useful to have a variable that reflects the economic situation of the country, a factor that might have explanatory power over looting and trafficking of antiquities as shown by the literature when providing motivation for subsistence looters.Footnote 39 Figure 7 shows a thematic map of Syria’s governorates according to the food insecurity measure, calculated as the quotient of the inflation of wages and the inflation of food prices.Footnote 40 Calculating this measure at the district and sub-district level was not possible as the data sourced was not at that level of detail. The map shows that the highest levels of food insecurity – therefore, indicating economic hardship – were mostly felt in the eastern governorate of Dayr az Zawr and the southern-most governorate of Daraa. Once again, the regime strongholds of Tartus and Latakia were comparatively better off.
Thematic map showing values of food insecurity measures in each Syrian governorate (courtesy of Luca Mazzali, Appears Pro, 2020).

Population
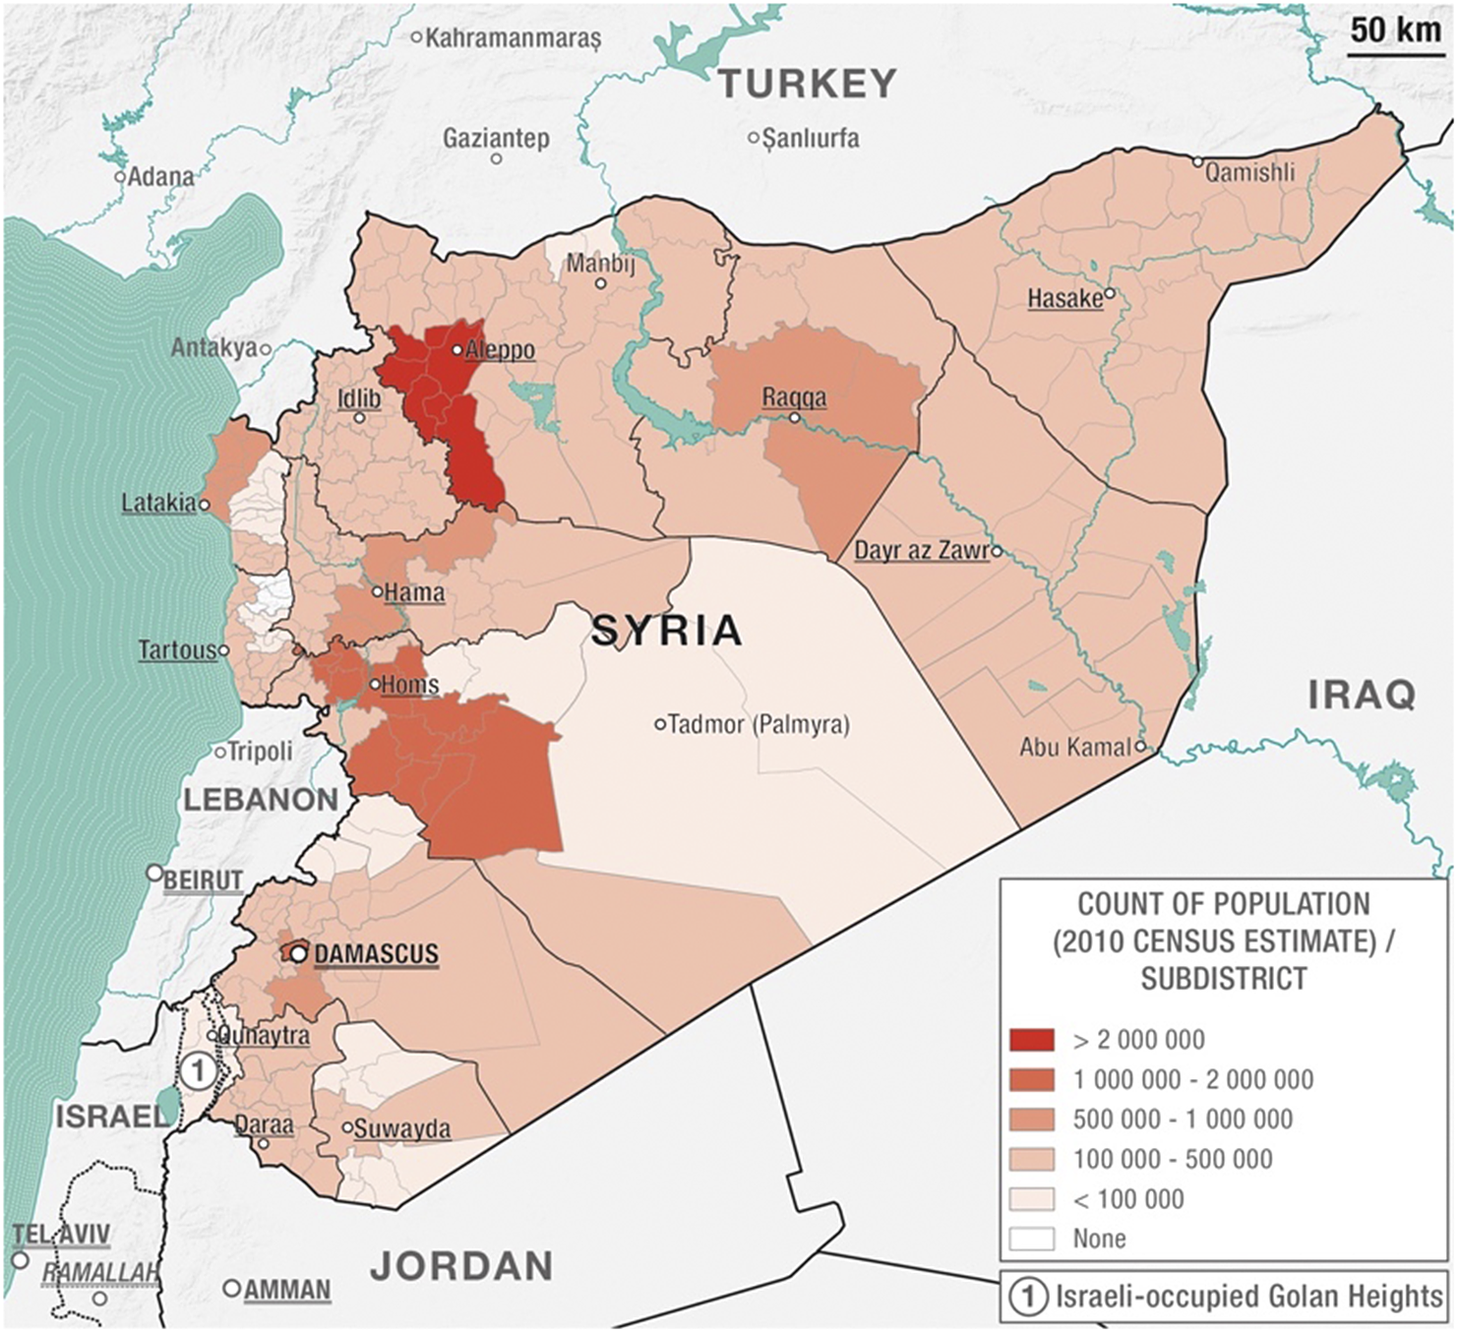
The population variable for Syria simply shows the count of population in Syria in each sub-district. The most up-to-date UN population data is the 2004 Syrian national census, with projected estimates of population numbers in 2010. This was the only and most recent population data available for Syria, and, as a major drawback, it does nothing to reflect population movements and internal displacement during the war. As shown in Figure 8, the population distribution per sub-district in Syria indicates a concentration of population around the three major Syrian cities of Damascus, Aleppo, and Homs, with the suburbs and countryside areas (rif in Arabic) of Aleppo and Homs being the most densely populated areas in the country.
Thematic map showing the count of population per Syrian sub-district (Luca Mazzali, Appears Pro, 2020).
Populated areas
An interesting comparison can be made looking at the distribution of the population versus the distribution of populated areas. Figure 9 shows the distribution of populated areas in Syria per sub-district, giving densities of the count of cities, towns, and villages in Syria and showing that, despite the fact that population densities are greater toward the western coast (Figure 7), the northeastern province of Hasaka has amongst the highest densities of populated areas.Footnote 41
Thematic map showing the count of populated areas per Syrian subdistrict (courtesy of Luca Mazzali, Appears Pro, 2020).

Hotspot analysis
The nearest-neighbor analysis confirmed that looting and theft cases are spatially concentrated. A better way to summarize the data is to see if there are any looting hotspots. The spatial statistics software CrimeStat III allowed us to generate more sophisticated maps from the thematic maps created through ArcMap.Footnote 42
KDE maps
First, however, a KDE heat map was produced to visualize the locations of greater density of the looting and theft of antiquities variable. Figure 10 shows a KDE heat map of antiquities looting and theft events in Syria, created as a default function on QGIS thanks to a discrete default interpolation showing a surface with the density of occurrence of looting and theft events in each grid cell. The visualization of the data on a heat map is a very subjective representation, as gradients can be manipulated to assign density values to raster cells.Footnote 43
Linear KDE interpolation heat map of looting and theft of antiquities in Syria, 2014–18 (courtesy of Luca Mazzali, Appears Pro, 2020).

KDE hotspot map
Differently from a heat map, hotspot analysis identifies statistically significant areas of high occurrence versus areas of low occurrence.Footnote 44 Hotspot analysis is performed through KDE techniques, where a smoothing algorithm calculates risk intensity values reflecting the intensity of crime at each location.Footnote 45 This is done by placing a grid of cells over the area of study, determining a specific bandwidth and “window size” for each cell.Footnote 46 The value assigned to each cell is the number of crimes calculated within the window, with each crime event being assigned a weighting that is proportionate to the distance between the crime event and the center of the cell.Footnote 47 As such, crimes that happen close to the center of the cell have a higher weighting than those that are further away from the center of the cell, deriving a high KDE estimate for those cells that, simply by adding together the weightings of each crime event within the cell, have a high number of crimes happening close to the center of the cell (see Figure 11).Footnote 48
KDE hotspot map of looting and theft of antiquities in Syria, 2014–18 (courtesy of Luca Mazzali, Appears Pro, 2020).

Dual KDE hotspot map
A further step from a KDE hotspot analysis can be done by moving beyond the simple count of antiquities looting and theft crimes and by looking at the opportunity structure of this type of crime. This can only be done by knowing the locations of opportunities to commit the type of crime, which, in the case of antiquities looting and theft, is best explained by the geographical distribution of known archaeological sites and museums. A dual KDE technique involves producing two KDE maps: one that describes the distribution of crime (looting and theft events) and one with the opportunity or target structure for crime (the locations of archaeological sites and museums). The density estimation for the crime data is then divided by the density estimation of the target density, providing a dual density estimation producing a surface map in which each cell expresses a ratio of the density of crime’s spatial distribution and the density of crime opportunity.Footnote 49 Figure 12 shows the hotspots of high rates of looting and theft of antiquities, and, as the looting and theft opportunity in Syria is not uniformly distributed, the dual KDE map differs from the KDE map of Figure 11, showing that the greatest risks appear to be in the Idlib area, which is also where the greatest frequency of looting and theft happens.
Dual KDE hotspot map of looting and theft of antiquities / archaeological site location in Syria, 2014–18 (courtesy of Luca Mazzali, Appears Pro, 2020).

Satellite analysis
To verify the results of the hotspot analysis, a time series of KDE values should be generated, but this could not be done due to the looting and theft data missing specific time variables. Instead, a satellite analysis was conducted of the 11 hotspots identified through the dual KDE mapping process. Satellite imagery offers the ability to visualize the damage caused by both conflict and looting across large regions from space.Footnote 50 To do this, recommendations by Neil Brodie and Daniel Contreras were followed, suggesting that images made available on Google Earth are suited to assessing the incidence of looting through time, despite the shortcoming that they do not update imagery very frequently and therefore are limited tools in the use of monitoring fast-changing conflict zones.Footnote 51
This approach, however, showed that there is no association emerging between the identified hotspots and satellite photographs of the hotspots, captured through a pre-image and after-image approach in attempting to compare recent photos to photos of the same location in a pre-conflict period. Figure 13 shows an identified Idlib hotspot compared to a satellite image of the Apamea site, showing the lack of looting signs in the identified hotspot versus what looted sites can look like from satellite imagery. From an initial analysis of the image, conducted in collaboration with professional photographers and satellite image analysts, no significant signs of theft and looting emerge from the images. Appendix 1 provides a full list of the nine hotspots photographed through satellite imagery from Google Earth, comparing pre-2011 photographs to the most recent images available.
Satellite imagery of hotspot R5C4 identified (Idlib province, Syria) through hotspot analysis compared to satellite photograph of looted site in Apamea, Syria, on 13 May 2019 and 26 July 2019 (© Marco Tiberio, Google Earth).

Negative binomial regression analysis
The last state of this quantitative mixed methods analysis involves checking the statistical significance of the variables sourced and described so far, as to finally check which of them have potential explanatory and predicting power over the dependent variable of looting and theft events. Ultimately, this stage could determine a model for finding and testing how well can certain predictor variables explain the frequency and location of looting events and hotspots in Syria during the last 10 years of civil war and possibly point in the direction of new ones that have not been included in this study but could be sourced for further ones. Regression analysis is one of the most common statistical techniques used in model building. Linear regression models are suitable to study dependent variables that are normally distributed and continuous around the mean. In the case of the looting and theft variable however, the count data is discrete suggesting the possibility of using a Poisson regression (Figure 14).
The discrete distribution of the dependent variable’s count of antiquities looting and theft per district (Stata software; courtesy of Luca Mazzali, Appears Pro, 2020).

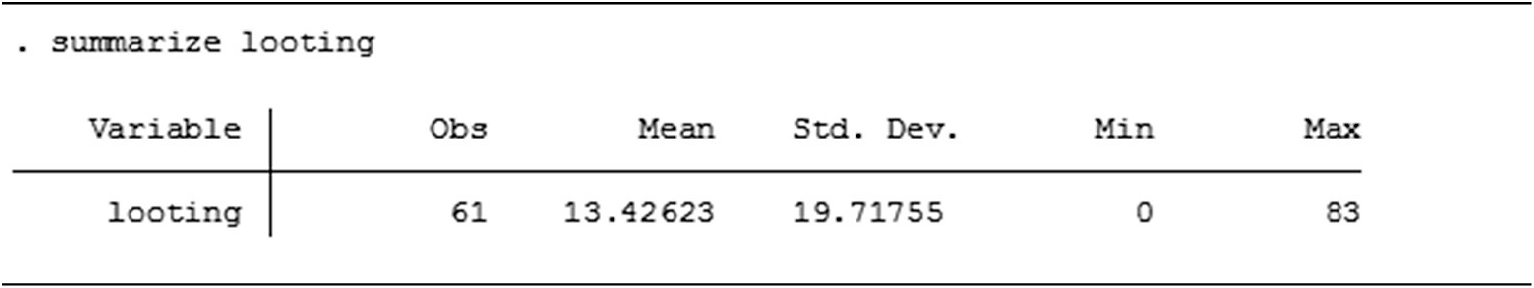
However, Poisson distributions carry the assumption that the mean of the DV needs to equal the variance. As shown in Table 4, with respect to the DV (looting and theft), this assumption cannot be met, as the mean of the DV (mean = 13.4) is much lower than its variance (standard deviation = 19.7). The failure of this key assumption for Poisson distributions indicates that the data of DV is over-dispersed, justifying the use of a negative binomial regression model, typically used for the modeling of over-dispersed count variables.
Descriptive statistic on Stata software of the dependent variable looting and theft of Syrian antiquities at district level, 2014–18
Source: David L. Suber, University College London, 2021.
IVs
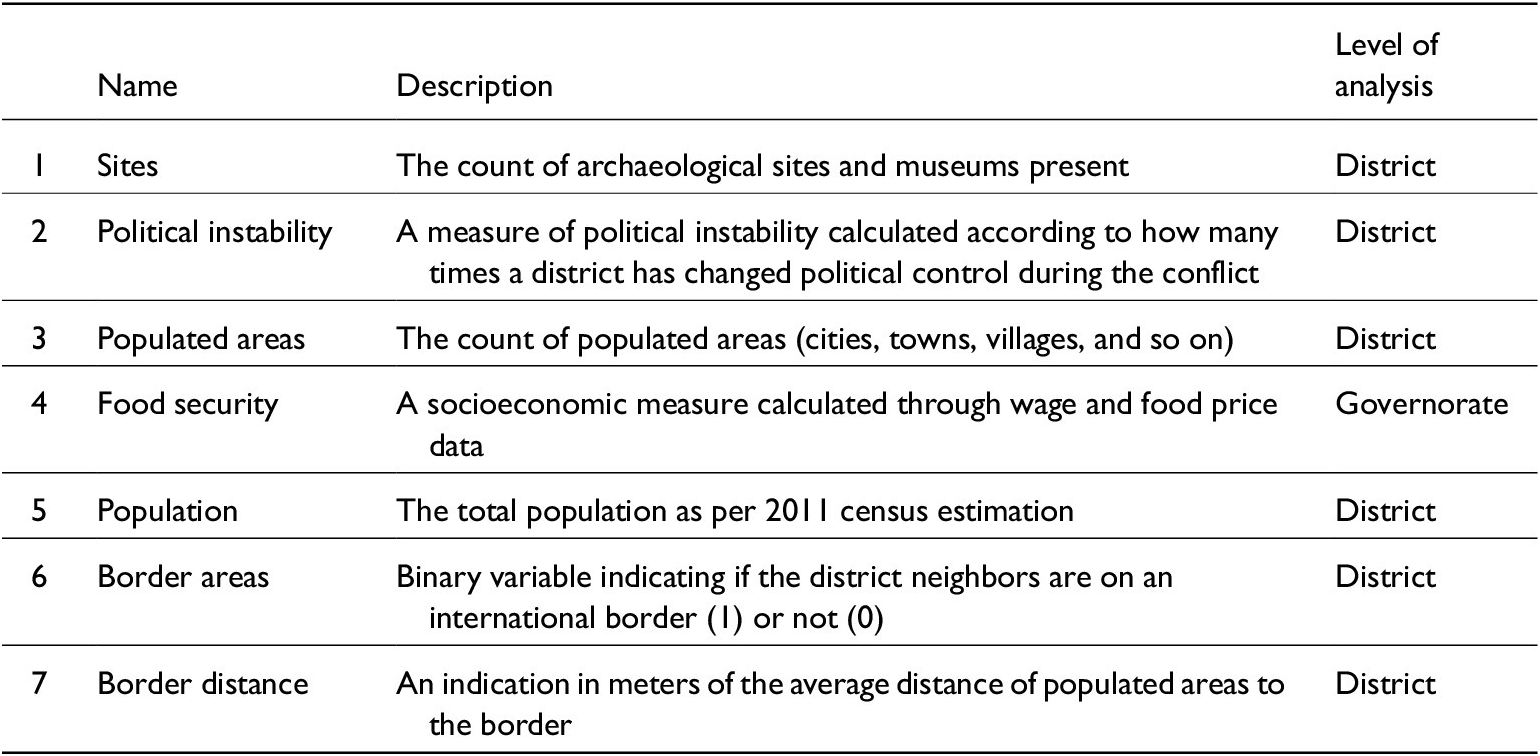
The predictor variables that this model wants to test are all included in Table 5, with the actual database reported in Appendix 2. The only difference to the variables used for the crime-mapping analysis is the addition of border areas and border distance variables to calculate whether an area shares an international border or not as well as the overall distance of that area from the closest border point.
IVs used for negative binomial regression model of looting and theft of Syrian antiquities
Source: David L. Suber, University College London, 2021.
The aim of this regression is to see which of these IVs is statistically significant in the model and positively associated with the dependent variable (that is, the more of any IV = more looting and theft). Importantly, in addition to the first five variables in Table 5, which were accounted for also in the crime-mapping analysis, two other variables have been added for the regression model, both related to whether districts in Syria are close or not to an international border zone. This was an added outcome of the crime-mapping analysis, hypothesizing through the visualization of hotspots that distance to a border does play a significant part in predicting antiquities looting and theft locations.
Checking assumptions
Assumptions to run a negative binomial regression are:
-
• that the DV (looting incidents) has to be count based and over-dispersed and
-
• that there is no multicollinearity between the IVs chosen.
As demonstrated above, the first assumption is met. To check for multicollinearity between the IVs, the following function is computed on Stata software. Since anything above 0.5/0.75 indicates the presence of collinearity between variables, the only emerging collinearity is between populated areas and political stability.Footnote 52 To better fit the model therefore, excluding the IV populated areas will be excluded from the regression model so as to fit the multicollinearity assumption (see Table 6).
Correlation between independent variables

Source: Stata software; David L. Suber, University College London, 2021.
Adjusting for clustered standard errors
Before proceeding to run the model, however, another precaution needs to be considered. Unlike all other IVs in fact, the variable for food security is calculated at the governorate level rather than at the district level (Figure 7; Table 5). This was a limiting characteristic of the data that could not be better accounted for, as most economic and social data collected by the OCHA is only calculated at the governorate level. Because there are not many observations forming the distribution of this variable, adjusting clustered standard errors is a good approach to relax the requirement that observations be independent across (but not necessarily within) groups.
Regression results
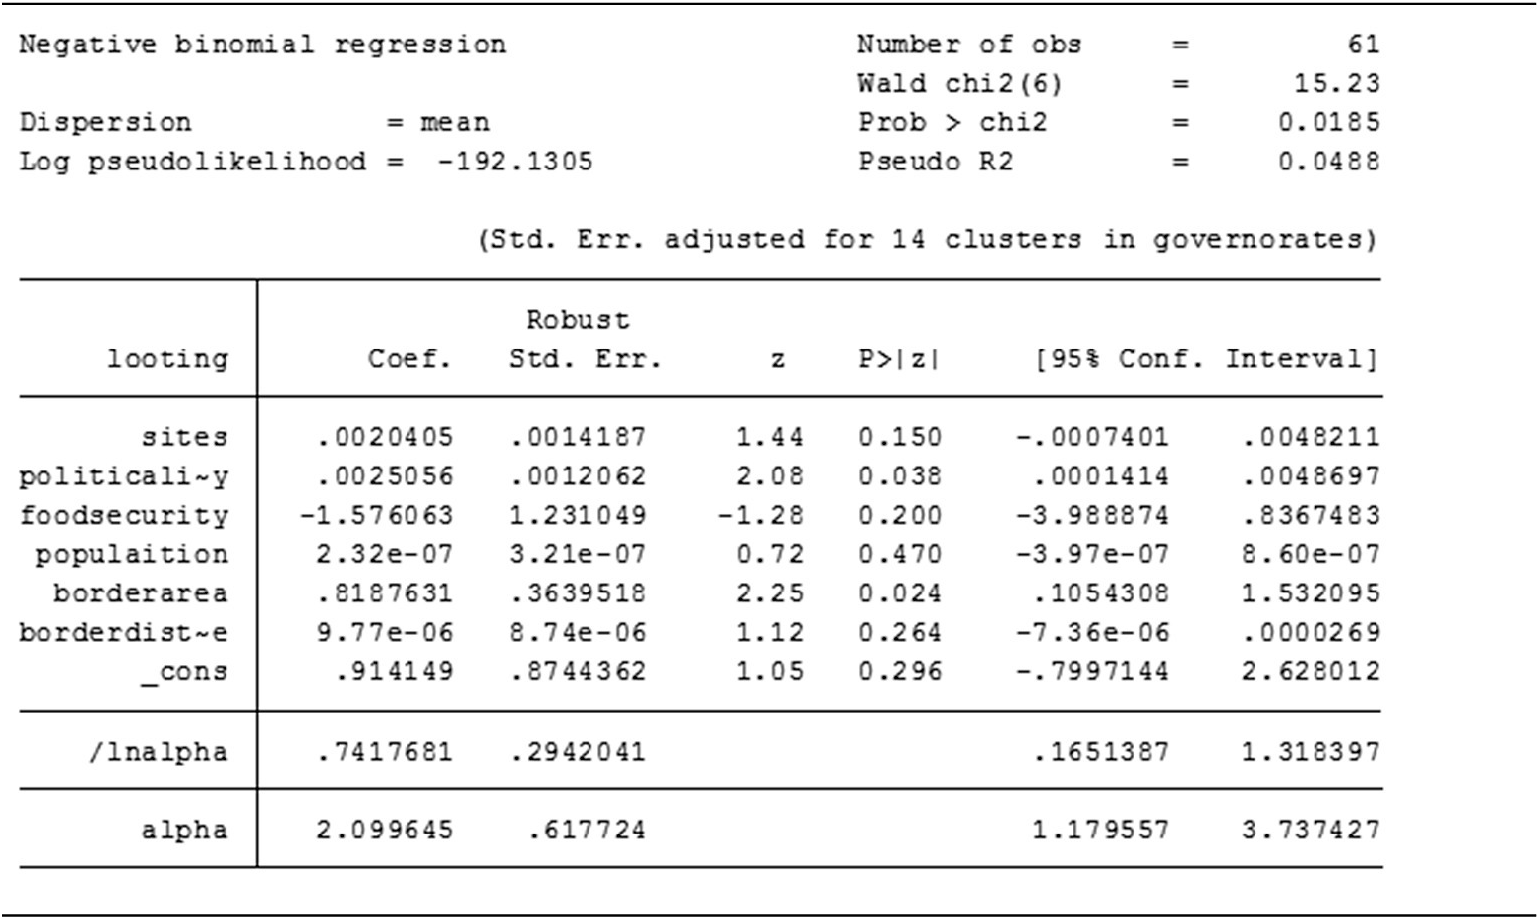
Table 7 shows the results of the negative binomial regression, with 61 observations, a chi-square statistic with six degrees of freedom and an overall model that is statistically significant for P = 0.02 (as P ≤ 0.05 for significance) and standard errors adjusted in the 14 governorate clusters.
Negative binomial regression results
Source: Stata software; David L. Suber, University College London, 2021.
Below the header results, the table shows negative binomial coefficients for each of the variables, along with standard errors, z-scores, p-values, and 95 percent confidence intervals for the coefficients. The variables for political instability and border areas respectively have a p-value of 0.038 and 0.024, indicating a both positive and statistically significant (p ≤ 0.05) association with the output variable (the DV looting and theft) in the direction expected (more instability = more looting and if border area = more looting). This means that for each one-unit increase in political instability, the expected log count of the number of looting increases by 0.002 and that for each one-unit increase in border areas, the expected log count of the number of looting increases by 0.82. On the other hand, the model shows that all other variables are not statistically significant (all have p > 0.05).
Regression results with indicator variables
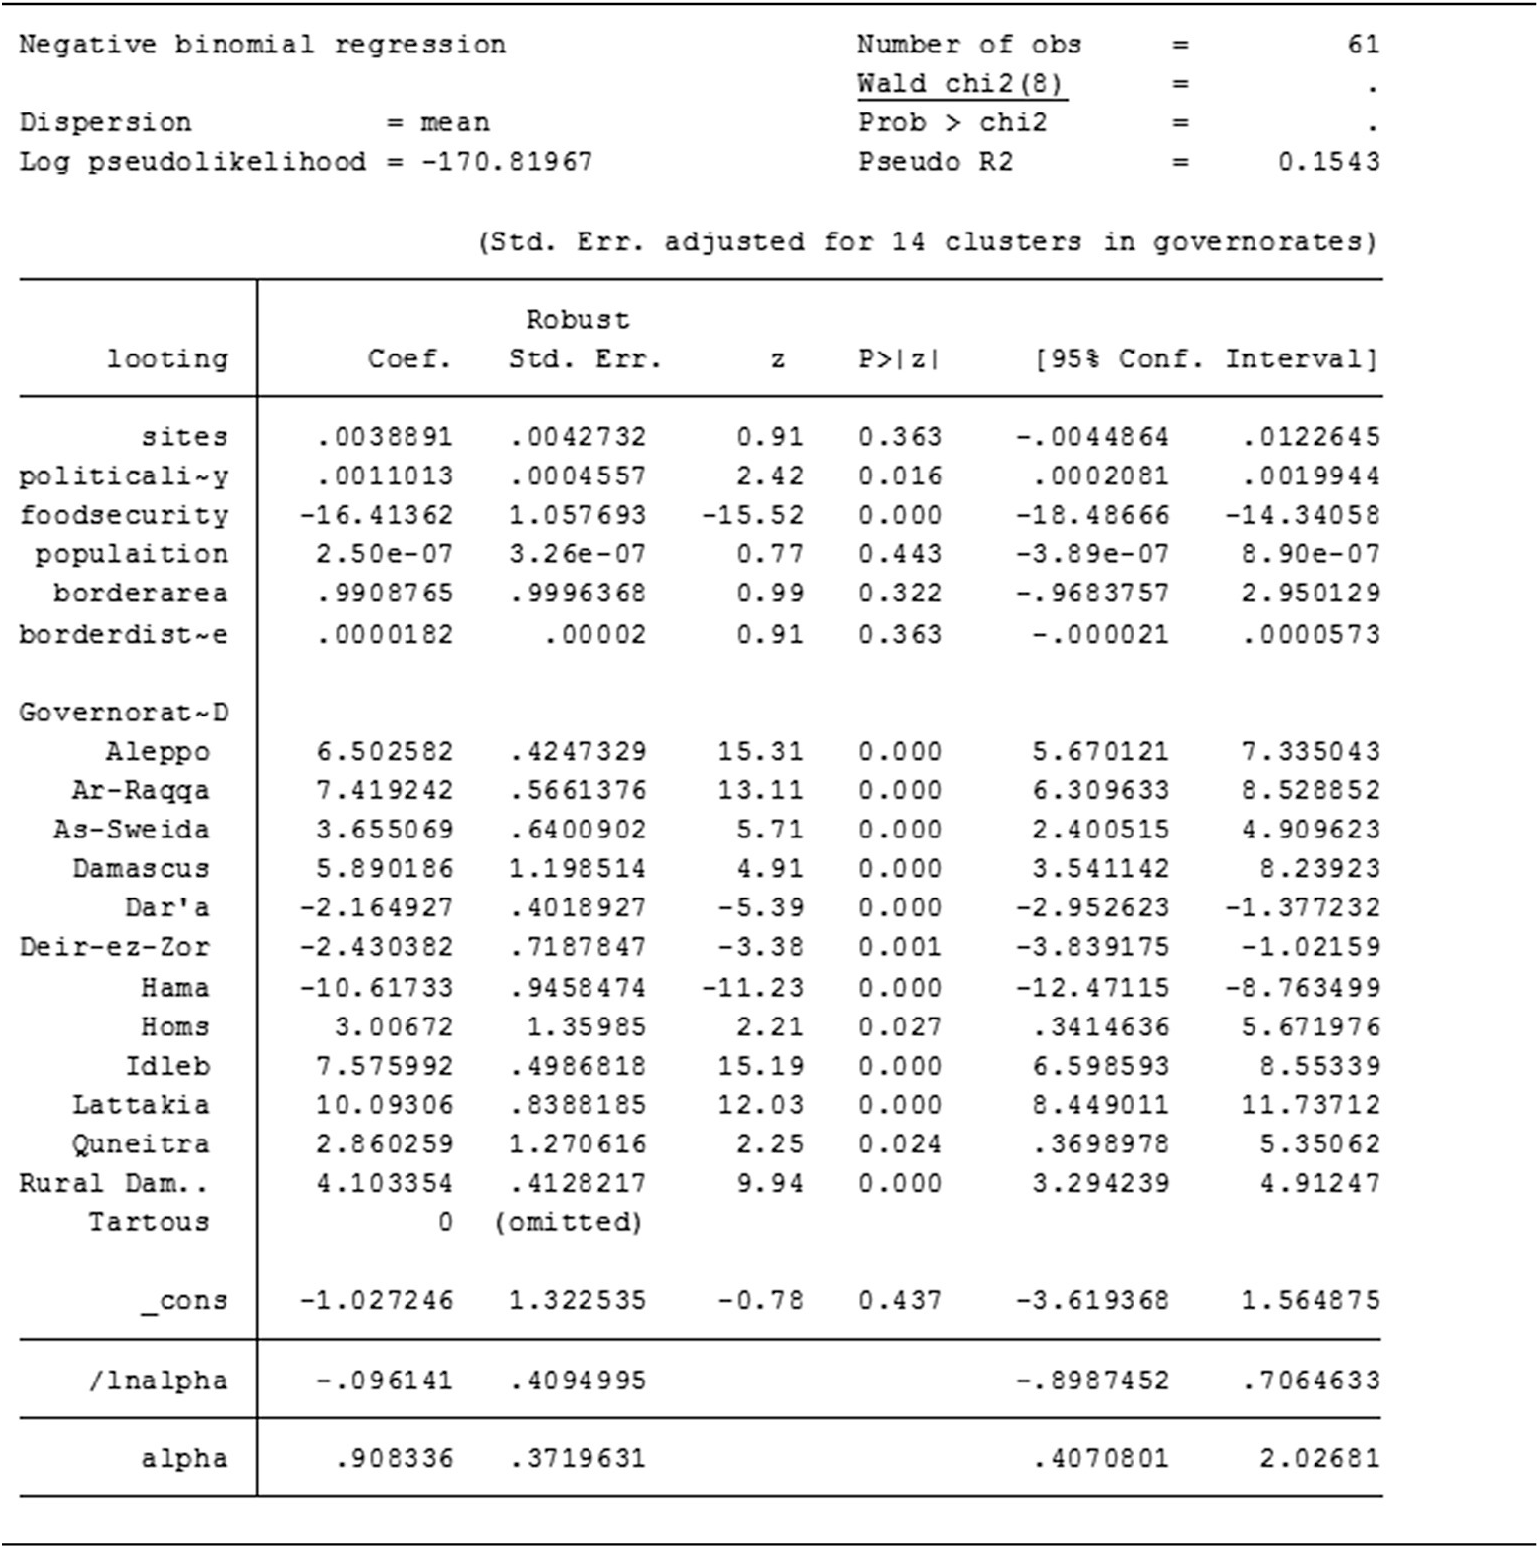
A further step toward better clarity in the regression results is to include an indicator variable for each governorate, so as to understand how much the model is over- or under-predicting for each governorate. Introducing an indicator variable allows one to see what the volume of looting incidents would be at the governorate level if all other variables were equal to zero. The value indicated for each governorate shows the calculated level of change in looting incidents. Thus, by assuming that the regression model explains all variations in the DV, if the z constant is above or below zero for a certain governorate it means that governorate has a higher or lower than normal “default” rate/count and that the model is missing something, as theoretically each governorate should show the same z constant after explaining all other factors (see Table 8).
Negative binomial results with indicator variables
Source: Stata software; David L. Suber, University College London, 2021.
The regression results clearly show that the model is missing certain explanatory factors, indicating that there is a significant under-prediction in Idlib (15.19), Aleppo (15.31), Ar-Raqqa (13.11), Latakia (12.03), and all other governorates with effects > 0 and that the model is under-predicting in Hama (–11.23), Dar’a (–5.39), and Deir Ezzor (–3.38).
Results
The results of the first analysis will be presented following the order in which the analysis was conducted, starting from the results of the crime-mapping analysis (thematic maps and hotspots), to the results of the satellite imagery analysis, and, finally, to the results from the regression analysis. As the actual visual or statistical results have already been presented in the analysis section, this section will discuss the implication of these results.
Hotspots identified
The limitations of thematic maps biased by the irregularity of Syria’s administrative boundaries suggested further crime-mapping analysis through heat maps and hotspot maps, to understand where the statistically significant areas of antiquities looting and theft are in relation to the opportunity structure of archaeological sites and museums. Statistically significant hotspots were identified close to the borders of Lebanon, Turkey, and Iraq, while hotspots calculated as a rate of the crime’s opportunity structure showed an interesting specific focus around the area of Idlib (Atma and Sarmada), in the northwest of Syria, right on the Turkish border, an area that in 2020 was one of the last locations where active fighting was still taking place between the Syrian regime and its allies and a loose configuration of rebel factions.Footnote 53
No association between hotspots and satellite imagery
Satellite imagery analysis was conducted to try and visualize the most statistically significant looting and theft hotspots emerging out of the crime-mapping analysis. The aim of this effort was to try and see if Google Earth images of the hotspots could identify any actual signs of looting and antiquities crime. The analysis of the imagery, compared to pre-conflict photographs of the same site, shows no relevant looting events taking place in the most up-to-date images. This result places a question mark on the reasons justifying this analytical approach and surely requires further insights to possibly reassess whether the calculated hotspots are actually supposed to identify a looted area rather than just provide a statistical estimation of a site resulting from an average localization of looted areas. In that case, enlarging the perspective of the hotspots might lead to better visualization results, but the theoretical underpinnings that this research has provided to justify this approach surely need to be revised.
Significance of the model
The results from the negative binomial regression model shows that, overall, the model is significant, with two out of the five variables having a certain degree of explanatory power over the distribution of looting events. The inclusion of “distance to border” variables proved to be a successful hypothesis as it resulted in one of the two statistically significant IVs of the regression analysis, together with political instability. The assumption that can be drawn from this result is that, in the case of Syrian antiquities looting, the instability created by war and the proximity to a border are indeed two key factors in the opportunity structure that shapes and explains the looting and trafficking of antiquities.
However, the regression calculated through the open sourced IVs does show the limits of this model, with over and under predictions in most governorates suggesting that there is something meaningful missing. While it is not easy to measure everything in complex cases like conflict countries, these indications can help point to new directions of thinking when attempting to change and improve the model, assuming, for example, that other explanatory variables could provide new insights into the model. The model over-predicted the value of looting and theft in Idlib, Aleppo, and Raqqa, three of the most heavily bombarded areas during the war (see Table 8).Footnote 54 Might there be an association between who is controlling those areas and the level of looting observed? Could a time-series analysis of looting episodes reveal even more information? What about the type of locations looted or other key population data like displacement of refugees?
And this is what further qualitative analysis could provide. The analysis of the quantitative analysis and its limitations encourage further thinking about new variables explaining antiquities trafficking, something that could be aided by information provided by experts and informants involved in antiquities-trafficking operations, information that can inspire further thinking and new data.
Conclusion
Overall results
Mixed method quantitative statistical and mapping methods data have been used to provide an overview analysis of antiquities trafficking in source countries, sourcing all available data, measuring explanatory and statistically significant variables such as “distance to border” and “political instability,” as well as identifying looting hotspots through a number of mapping techniques. Through the analysis of 2014–18 open sourced quantitative data on looting and theft of antiquities, the most targeted locations in Syria have been archaeological areas close to the borders of Lebanon and Turkey, with high-density hotspots emerging in the region of Palmyra, Aleppo Raqqa, and Hasaka, cities that have seen most of the violent clashes and political instability. The border towns of Atma and Sarmada, north of the Idlib governorate, were identified as statistically significant hotspots, a result that was further supported by statistical regression analysis of variables considered to have predictive power on looting events, showing that both the influence of political instability and the distance between sites and an international border do have a certain explanatory value in predicting looting events.
Relation between antiquities trafficking and conflict
Overall, this study has tried to test if quantitative statistical and geospatial mapping methods of research and analysis can be rightfully used to analyze the phenomenon of antiquities trafficking in a context of conflict. As in the case of Syria, the structural social, economic, and political circumstances created by war have surely helped shape a context of systemic criminal opportunity, emerging both in the presence of war-induced chaos and social strife, creating new motivational structures for antiquities crime. Findings of this study confirm literature arguing that war, just like poverty, motivates people and organized groups to loot heritage sites either to guarantee individual/familiar survival or to fund insurgency. This study’s perspective on the relation between war and antiquities crime has been unidirectional, and could further be problematized: instead of looking at whether conflict is the main promoter of looting and trafficking, further research should ask whether conflict can rather be a disruptor to antiquities looting and trafficking.
Implications for policy
From a methodological perspective, this study confirms the utility of data-driven research methods in collecting and analyzing crime data related to antiquities trafficking. The identification of hotspots can provide important insights into the localization of so-called “convergence settings,” locations where interactions occur between actors involved in the trafficking chain.Footnote 55 From a crime prevention perspective, targeting locations where actors are known to meet and interact removes opportunities much more than targeting individuals.Footnote 56 Further research into crime approaches to antiquities trafficking could involve focusing on transit countries such as Turkey, especially at border points, border towns, and main trafficking border cities of Gaziantep and Salinurfe, which are the major convergence settings for most of the illicit antiquities trade from northern Syria. A similar research recommendation could be made for online “convergence settings” such as Facebook and eBay. Meaningful research into this direction has and is being conducted mostly in the United States by anti-online trafficking heritage protection associations.Footnote 57
Future of antiquities trafficking from Syria?
Considering the magnitude of the business, the availability of antiquities, the ongoing nature of the conflict, and the scarce international cooperation on antiquities crime detection and prevention, the trafficking business of Syrian antiquities is likely to continue undisturbed well after the war. The eventual reconstruction phase could prove to be as difficult as the war itself, facing the costs of much needed direct foreign investment to rebuild the country top to bottom. International funders have already eyed Syria as the location of major infrastructural investment, with projects such as the Road and Belt Initiative (OBOR) promoted by the Chinese government being currently under discussion in Damascus.Footnote 58 Criminologists have already raised concerns about possible criminogenic opportunities that the OBOR and similar reconstruction projects might provide for organized groups, especially in relation to enhanced transportation routes to smuggle antiquities.Footnote 59 The future safety of Syrian antiquities is an endemic problem for which there are no simple solutions. As long as international approaches will focus on restitution rather than prevention, weak states will struggle to face organized networks and opportunistic looters, especially in contexts of conflict and scarce heritage protection.Footnote 60
Limitations
Despite the encouraging results, significant limitations emerged from this study.
Issues with data collection
Data accuracy is a difficult standard to reach in crime studies and criminology, considering the inherent secrecy of crime events. Using multiple data sources is a technique that can limit the imprecision of data. The mixed data collection and analysis approach taken in this study reveals a certain degree of unreliable and questionable data, both from a methodological perspective and as a consequence of the results. The looting and theft dataset compiled and shared by the ASOR Cultural Heritage Initiative, for example, provides an excellent starting point for analysis on antiquities looting and trafficking in Syria.Footnote 61 Nonetheless, the database is far from complete as well as positively skewed in favor of events happening in non-regime-controlled areas, from which there is more information and access. The data was also collected with the aim of monitoring destruction and damage of heritage rather than specifically looting and theft of antiquities.
Issues with data interpretation
Despite the added value of attempting a visual analysis approach through satellite imagery of hotspots, the unsuccessful results indicate that such approaches should be reconsidered, informed by further insights into identification methods of image assessments. Some researchers have made substantial progress at using methods to calculate the number of holes in the ground, their depth and spacing, and other features using promising yet very labor and cost intensive tools.Footnote 62 Enquiry into how to better integrate satellite imagery analysis to hotspot and crime mapping might suggest better insights into the visual identification and verification of hotspots.
Further analysis: Object typology analysis
This study has also identified a third level of analysis, one that could not be carried out due to a lack of time and, quite simply, writing space. This third level of analysis would have involved compiling a typology analysis of Syrian looted antiquities, to be measured against a typology analysis of antiquities sold online so as to estimate the similarity degree between what is going missing at the source level and what is resurfacing back on the market. The needed databases for this further research analysis also need to be sourced: for the missing objects, Interpol has given authorization and access to the Psyche database, collecting all looted Syrian objects that have been reported during the conflict from both archaeological sites and museums in both rebel and opposition areas. For the resurfacing objects instead, Mark Altaweel at UCL’s Department of Archaeology has provided access to his web-scrape database of antiquities sold on eBay. Such a study could verify if the typology of objects that are being looted at the source level match up nicely with the types of objects being sold on the online market.
Conclusive remarks
In conclusion, this study has investigated the phenomenon of antiquities looting and trafficking in Syria through the best-suited methodological approaches available in the antiquities crime literature. Quantitative data were collected through open source research, analyzed through a crime-mapping, satellite imagery analysis and statistical regression analysis. Ultimately, results from the quantitative analyses show that research methods traditionally used in quantitative criminology and crime science approaches can be applied to the study of antiquities trafficking.
Any further insights and comments by readers of this work are thoroughly welcome, addressing this study’s methodological approaches, as well any shortcomings in the research design, data collection methods, hypotheses formulation, and derived results. This work was conducted in the belief that any rigorous research produced on the topic of antiquities trafficking and heritage loss in countries suffering from political and economic turmoil is a small but significant step toward safeguarding a human treasure that otherwise risks being lost. We hope that this contribution to the academic literature on antiquities trafficking, and especially to the case studies emerging from the context of the Syrian war, can be used to further a more explicit implementation of international regulations for the safeguarding of archaeological and cultural heritage locations in conflict countries, hand in hand with the protection of the civilian communities that live and cherish such places.
Supplementary Materials.
To view supplementary material for this article, please visit http://doi.org/10.1017/S0940739122000248.


 Open access