


1. Introduction
Viscous droplet impacts onto solid surfaces are prevalent in numerous industrial and scientific applications, including three-dimensional printing and bioprinting (Gudapati, Dey & Ozbolat Reference Gudapati, Dey and Ozbolat2016; Piskunov et al. Reference Piskunov, Khomutov, Semyonova, Di Martino, Khan and Bolbasov2023), inkjet printing (Krainer, Smit & Hirn Reference Krainer, Smit and Hirn2019; Lohse Reference Lohse2022), spray painting (Kamamoto, Onuki & Tagawa Reference Kamamoto, Onuki and Tagawa2021), spray coating (Bange et al. Reference Bange, Upadhyay, Patil and Bhardwaj2022) and agricultural pesticide spraying (Damak et al. Reference Damak, de Ruiter, Panat and Varanasi2022), to name a few. When an isolated single droplet impacts a substrate with sufficiently high kinetic energy, the induced liquid flow may encounter resistance due to viscous dissipation occurring within the bulk and along the advancing contact line. Subsequently, the relative dominance of capillary forces and viscous dissipation determines the spreading behaviour of the droplet on the impact substrate (Clanet et al. Reference Clanet, Béguin, Richard and Quéré2004). Moreover, droplet liquid viscosity can significantly alter the splashing dynamics during droplet impacts (Josserand & Thoroddsen Reference Josserand and Thoroddsen2016). These liquid viscosity effects can become more complex in spray-based applications involving non-isolated multiple-droplet impacts, where interactions between neighbouring droplets can modify the outcomes expected from isolated single-droplet impacts (Roisman et al. Reference Roisman, Prunet-Foch, Tropea and Vignes-Adler2002; Goswami & Hardalupas Reference Goswami and Hardalupas2023, Reference Goswami and Hardalupas2024). Therefore, understanding how liquid viscosity influences the outcomes of multiple-droplet impacts is crucial for optimising and controlling a broad range of spray-based technologies.
Single-droplet impacts on solid substrates have been the focus of extensive research since the seminal experiments of Worthington (Worthington Reference Worthington1877). Over the past two decades, advancements in high-speed imaging technology have enabled detailed, time-resolved observations of droplet-impact processes across diverse droplet–substrate combinations, as reviewed by Mohammad Karim (Mohammad Karim Reference Mohammad Karim2022). This has significantly advanced our understanding of pertinent impact outcomes, including droplet spreading, splashing and the rebound dynamics. These outcomes are mainly scaled by dimensionless numbers such as the impact Weber number
 $ \textit{We} = \rho D_0 V_0^2 / \sigma$
and Reynolds number
$ \textit{We} = \rho D_0 V_0^2 / \sigma$
and Reynolds number
 $ \textit{Re} = \rho V_0 D_0 / \mu$
, with
$ \textit{Re} = \rho V_0 D_0 / \mu$
, with
 $\rho$
,
$\rho$
,
 $D_0$
,
$D_0$
,
 $V_0$
,
$V_0$
,
 $\sigma$
and
$\sigma$
and
 $\mu$
representing liquid density, initial droplet diameter, impact velocity, interfacial surface tension and liquid viscosity, respectively. Additionally, the dimensionless Ohnesorge number
$\mu$
representing liquid density, initial droplet diameter, impact velocity, interfacial surface tension and liquid viscosity, respectively. Additionally, the dimensionless Ohnesorge number
 $ \textit{Oh} = \sqrt {\textit{We} / \textit{Re}} = \mu / \sqrt {\rho \sigma D_0}$
defines the relative influence of viscous forces compared with surface tension and inertial forces. The temporal evolution of droplet-impact processes is typically described using a dimensionless time
$ \textit{Oh} = \sqrt {\textit{We} / \textit{Re}} = \mu / \sqrt {\rho \sigma D_0}$
defines the relative influence of viscous forces compared with surface tension and inertial forces. The temporal evolution of droplet-impact processes is typically described using a dimensionless time
 $\tau = t V_0 / D_0$
, with
$\tau = t V_0 / D_0$
, with
 $t$
as the dimensional time measured from the moment of impact. Numerous empirical correlations and theoretical models have been developed using these dimensionless parameters to predict and characterise the splash/deposition boundaries and liquid fragments during splashing for single-droplet impacts on solid substrates, as reviewed in Josserand & Thoroddsen (Reference Josserand and Thoroddsen2016). Despite the extensive insights gained from single-droplet-impact studies, multiple-droplet impacts – which are more representative of practical spray-based applications – remain comparatively underexplored and insufficiently understood.
$t$
as the dimensional time measured from the moment of impact. Numerous empirical correlations and theoretical models have been developed using these dimensionless parameters to predict and characterise the splash/deposition boundaries and liquid fragments during splashing for single-droplet impacts on solid substrates, as reviewed in Josserand & Thoroddsen (Reference Josserand and Thoroddsen2016). Despite the extensive insights gained from single-droplet-impact studies, multiple-droplet impacts – which are more representative of practical spray-based applications – remain comparatively underexplored and insufficiently understood.
The dynamics of multiple adjacent droplets impacting a solid substrate is influenced by the inter-droplet spacing
 $\Delta x$
and the time lag
$\Delta x$
and the time lag
 $\Delta t$
between droplet impacts, leading to three primary scenarios: successive (
$\Delta t$
between droplet impacts, leading to three primary scenarios: successive (
 $\Delta x = 0$
and
$\Delta x = 0$
and
 $\Delta t \neq 0$
), simultaneous (
$\Delta t \neq 0$
), simultaneous (
 $\Delta x \neq 0$
and
$\Delta x \neq 0$
and
 $\Delta t = 0$
) and non-simultaneous (
$\Delta t = 0$
) and non-simultaneous (
 $\Delta x \neq 0$
and
$\Delta x \neq 0$
and
 $\Delta t \neq 0$
) impacts. Figure 1 illustrates the latter two impact cases for a droplet pair. To date, successive droplet impacts – commonly referred to as droplet train impacts – have received relatively greater attention for both isothermal (Barnes et al. Reference Barnes, Hardalupas, Taylor and Wilkins1999; Tong, Kasliwal & Fujimoto Reference Tong, Kasliwal and Fujimoto2007; Fujimoto, Tong & Takuda Reference Fujimoto, Tong and Takuda2008; Zhang et al. Reference Zhang, Muthusamy, Alvarado, Kanjirakat and Sadr2016; Chen et al. Reference Chen, Chen, Yan, Li and Lin2020; Kanjirakat, Sadr & Alvarado Reference Kanjirakat, Sadr and Alvarado2021) and non-isothermal (Muthusamy et al. Reference Muthusamy, Zhang, Alvarado, Kanjirakat and Sadr2016; Zhang et al. Reference Zhang, Alvarado, Muthusamy, Kanjirakat and Sadr2017; Guggilla, Narayanaswamy & Pattamatta Reference Guggilla, Narayanaswamy and Pattamatta2020; Luo et al. Reference Luo, Wu, Xiao and Chen2021; Muthusamy et al. Reference Muthusamy, Zhang, Alvarado, Kanjirakat and Sadr2021; Wibowo, Widyatama & Kamal Reference Wibowo2021; Benther et al. Reference Benther, Bhatt, Restrepo, Stanley and Rosengarten2022) conditions, leading to a better understanding than that of simultaneous and non-simultaneous impacts. While simultaneous and non-simultaneous impacts both result in the interaction of spreading lamellae on a solid substrate, successive impacts differ in that the liquid film generated by the preceding droplet alters the impact conditions for the trailing one – leading to the formation and propagation of a crown around the impact centre (Yarin et al. Reference Yarin2006). The near-wall flow field characteristics within the thin liquid film formed during successive impacts differ significantly from those of an equivalent single-droplet impact, owing to enhanced fluid mixing and complex flow structure induced by droplet-crown propagation (Lewis, Anumolu & Trujillo Reference Lewis, Anumolu and Trujillo2013; Kanjirakat et al. Reference Kanjirakat, Sadr and Alvarado2021). Kanjirakat et al. (Reference Kanjirakat, Sadr and Alvarado2021), using near-wall velocimetry, demonstrated pronounced radial velocity fluctuations in the impingement zones of droplet trains, underscoring the complexity of these thin-film flow fields. It is noted that most practical and industrial droplet-impact scenarios involve a train or spray of droplets, rather than isolated droplet pairs. The frequency of droplet arrival, set by the time interval between successive droplets, strongly influences liquid film thickness, crown and crater dynamics and heat transfer in continuous impact regimes. Studies such as Muthusamy et al. (Reference Muthusamy, Zhang, Alvarado, Kanjirakat and Sadr2016) and Zhang et al. (Reference Zhang, Alvarado, Muthusamy, Kanjirakat and Sadr2017) have shown that high-frequency droplet trains can sustain continuous crown propagation, modify the crown or crater interactions and enhance convective heat transfer compared with isolated impacts.
$\Delta t \neq 0$
) impacts. Figure 1 illustrates the latter two impact cases for a droplet pair. To date, successive droplet impacts – commonly referred to as droplet train impacts – have received relatively greater attention for both isothermal (Barnes et al. Reference Barnes, Hardalupas, Taylor and Wilkins1999; Tong, Kasliwal & Fujimoto Reference Tong, Kasliwal and Fujimoto2007; Fujimoto, Tong & Takuda Reference Fujimoto, Tong and Takuda2008; Zhang et al. Reference Zhang, Muthusamy, Alvarado, Kanjirakat and Sadr2016; Chen et al. Reference Chen, Chen, Yan, Li and Lin2020; Kanjirakat, Sadr & Alvarado Reference Kanjirakat, Sadr and Alvarado2021) and non-isothermal (Muthusamy et al. Reference Muthusamy, Zhang, Alvarado, Kanjirakat and Sadr2016; Zhang et al. Reference Zhang, Alvarado, Muthusamy, Kanjirakat and Sadr2017; Guggilla, Narayanaswamy & Pattamatta Reference Guggilla, Narayanaswamy and Pattamatta2020; Luo et al. Reference Luo, Wu, Xiao and Chen2021; Muthusamy et al. Reference Muthusamy, Zhang, Alvarado, Kanjirakat and Sadr2021; Wibowo, Widyatama & Kamal Reference Wibowo2021; Benther et al. Reference Benther, Bhatt, Restrepo, Stanley and Rosengarten2022) conditions, leading to a better understanding than that of simultaneous and non-simultaneous impacts. While simultaneous and non-simultaneous impacts both result in the interaction of spreading lamellae on a solid substrate, successive impacts differ in that the liquid film generated by the preceding droplet alters the impact conditions for the trailing one – leading to the formation and propagation of a crown around the impact centre (Yarin et al. Reference Yarin2006). The near-wall flow field characteristics within the thin liquid film formed during successive impacts differ significantly from those of an equivalent single-droplet impact, owing to enhanced fluid mixing and complex flow structure induced by droplet-crown propagation (Lewis, Anumolu & Trujillo Reference Lewis, Anumolu and Trujillo2013; Kanjirakat et al. Reference Kanjirakat, Sadr and Alvarado2021). Kanjirakat et al. (Reference Kanjirakat, Sadr and Alvarado2021), using near-wall velocimetry, demonstrated pronounced radial velocity fluctuations in the impingement zones of droplet trains, underscoring the complexity of these thin-film flow fields. It is noted that most practical and industrial droplet-impact scenarios involve a train or spray of droplets, rather than isolated droplet pairs. The frequency of droplet arrival, set by the time interval between successive droplets, strongly influences liquid film thickness, crown and crater dynamics and heat transfer in continuous impact regimes. Studies such as Muthusamy et al. (Reference Muthusamy, Zhang, Alvarado, Kanjirakat and Sadr2016) and Zhang et al. (Reference Zhang, Alvarado, Muthusamy, Kanjirakat and Sadr2017) have shown that high-frequency droplet trains can sustain continuous crown propagation, modify the crown or crater interactions and enhance convective heat transfer compared with isolated impacts.
Recently, several studies have addressed simultaneous (Roisman et al. Reference Roisman, Prunet-Foch, Tropea and Vignes-Adler2002; Batzdorf et al. Reference Batzdorf, Breitenbach, Schlawitschek, Roisman, Tropea, Stephan and Gambaryan-Roisman2017; Ersoy & Eslamian Reference Ersoy and Eslamian2020; Liang et al. Reference Liang, Yu, Chen and Shen2020; Liu, Kijanka & Urban Reference Liu, Kijanka and Urban2020; Gultekin et al. Reference Gultekin, Erkan, Ozdemir, Colak and Suzuki2021; Huang, Wang & He Reference Huang, Wang and He2022; Goswami & Hardalupas Reference Goswami and Hardalupas2023) and non-simultaneous (Roisman et al. Reference Roisman, Prunet-Foch, Tropea and Vignes-Adler2002; Ersoy & Eslamian Reference Ersoy and Eslamian2020; Liang et al. Reference Liang, Yu, Chen and Shen2020; Benther et al. Reference Benther, Bhatt, Restrepo, Stanley and Rosengarten2022; Gholijani, Gambaryan-Roisman & Stephan Reference Gholijani, Gambaryan-Roisman and Stephan2022; Goswami & Hardalupas Reference Goswami and Hardalupas2024) droplet-pair impacts, revealing key distinctions in their hydrodynamic behaviour. In simultaneous impacts (
 $\Delta x \neq 0$
and
$\Delta x \neq 0$
and
 $\Delta t = 0$
), the spreading lamellae interact along a collision plane, forming a central uprising sheet whose morphology, stability and splashing dynamics are influenced by the impact Weber number (
$\Delta t = 0$
), the spreading lamellae interact along a collision plane, forming a central uprising sheet whose morphology, stability and splashing dynamics are influenced by the impact Weber number (
 $ \textit{We}$
), inter-droplet spacing (
$ \textit{We}$
), inter-droplet spacing (
 $\Delta x$
) and substrate properties (Gultekin et al. Reference Gultekin, Erkan, Ozdemir, Colak and Suzuki2021; Goswami & Hardalupas Reference Goswami and Hardalupas2023). Conversely, non-simultaneous impacts (
$\Delta x$
) and substrate properties (Gultekin et al. Reference Gultekin, Erkan, Ozdemir, Colak and Suzuki2021; Goswami & Hardalupas Reference Goswami and Hardalupas2023). Conversely, non-simultaneous impacts (
 $\Delta x \neq 0$
and
$\Delta x \neq 0$
and
 $\Delta t \neq 0$
) introduce additional complexity due to the time lag, including inequal momentum contribution by the interacting lamellae that leads to the formation of inclined central sheets with distinct morphological and temporal characteristics (Ersoy & Eslamian Reference Ersoy and Eslamian2020; Goswami & Hardalupas Reference Goswami and Hardalupas2024). Our recent studies (Goswami & Hardalupas Reference Goswami and Hardalupas2023, Reference Goswami and Hardalupas2024) have provided detailed morphological and quantitative characterisation of simultaneous and non-simultaneous impacts, highlighting the crucial roles of
$\Delta t \neq 0$
) introduce additional complexity due to the time lag, including inequal momentum contribution by the interacting lamellae that leads to the formation of inclined central sheets with distinct morphological and temporal characteristics (Ersoy & Eslamian Reference Ersoy and Eslamian2020; Goswami & Hardalupas Reference Goswami and Hardalupas2024). Our recent studies (Goswami & Hardalupas Reference Goswami and Hardalupas2023, Reference Goswami and Hardalupas2024) have provided detailed morphological and quantitative characterisation of simultaneous and non-simultaneous impacts, highlighting the crucial roles of
 $\Delta t$
,
$\Delta t$
,
 $\Delta x$
and impact
$\Delta x$
and impact
 $ \textit{We}$
in central sheet evolution, deposition and splash outcomes of water droplet-pair impacts. In both scenarios, the dimensionless maximum height of a ‘semilunar’ sheet was found to scale with the square root of a dimensionless lamella–lamella impact Weber number, which depends on the velocities and thicknesses of lamellae at the moment of their first interaction (Goswami & Hardalupas Reference Goswami and Hardalupas2023, Reference Goswami and Hardalupas2024).
$ \textit{We}$
in central sheet evolution, deposition and splash outcomes of water droplet-pair impacts. In both scenarios, the dimensionless maximum height of a ‘semilunar’ sheet was found to scale with the square root of a dimensionless lamella–lamella impact Weber number, which depends on the velocities and thicknesses of lamellae at the moment of their first interaction (Goswami & Hardalupas Reference Goswami and Hardalupas2023, Reference Goswami and Hardalupas2024).
Despite these advancements, the effect of liquid viscosity on simultaneous and non-simultaneous droplet-pair impacts remains unexplored, to the best of our knowledge. While viscosity is known to significantly affect single-droplet-impact outcomes – dampening splashing (Kumar & Mandal Reference Kumar and Mandal2019; García-Geijo et al. Reference García-Geijo, Riboux and Gordillo2022) and modifying the spreading dynamics (Clanet et al. Reference Clanet, Béguin, Richard and Quéré2004; Qin et al. Reference Qin, Tang, Tong, Zhang and Huang2019; Aksoy et al. Reference Aksoy, Eneren, Koos and Vetrano2022; Abbot et al. Reference Abbot, Lannert, Kiran, Bakshi, Hussong and Roisman2024) – its effect on the interacting lamella dynamics and central sheet evolution during droplet-pair impacts remains unclear. Therefore, a comprehensive study focusing on the role of liquid viscosity in droplet-pair impacts on solid surfaces is essential to develop scaling laws or correlations that characterise these phenomena, considering the liquid viscosity effects on impact outcomes.
The present study systematically investigates both simultaneous and non-simultaneous droplet-pair impacts on solid substrates across a broad viscosity range, focusing on the role of viscosity in spatial and temporal characteristics of the central sheet evolution driven by lamella interactions. Through synchronised high-speed imaging and quantitative analysis, this work offers the first detailed insight into the hydrodynamic effects of viscosity on the droplet-pair impact dynamics. The next sections are outlined as follows. Section 2 describes the experimental methodology, detailing the physical properties of the droplet liquids and the generation of droplet pairs. Section 3 presents the results, starting with an analysis of impact morphologies in simultaneous droplet-pair impacts across different viscosities for a fixed Weber number and droplet spacing (§ 3.1). Section 3.2 provides a quantitative evaluation of the lamella spreading behaviour while comparing it with existing theoretical models. The dynamics of the central uprising sheet, including maximum sheet expansion, is discussed in § 3.3. Section 3.4 investigates the spreading behaviour and sheet dynamics for non-simultaneous impacts for different viscosities, comparing the findings with those from the simultaneous impacts. The paper ends with highlights of the major findings and their broader implications.

Figure 1. Schematic of the experimental arrangement. The right-top inset image represents simultaneous droplet impacts (i.e. time lag
 $ \Delta t = 0$
) and the right-bottom inset image represents non-simultaneous droplet impacts (
$ \Delta t = 0$
) and the right-bottom inset image represents non-simultaneous droplet impacts (
 $ \Delta t \gt 0$
). The considered test rig coordinate system has its origin on the solid substrate, at the midpoint of the inter-droplet spacing.
$ \Delta t \gt 0$
). The considered test rig coordinate system has its origin on the solid substrate, at the midpoint of the inter-droplet spacing.
2. Experimental methodology
Figure 1 shows a simplified schematic of the experimental arrangement with the test rig coordinate system and the nomenclature of a typical droplet-pair impact scenario explored in this study. Different mixtures of distilled water and pure glycerol (
 $\geq$
99.5 %; G9012 from Sigma-Aldrich®) were used as droplet liquids. The impact surface was a smooth acrylic (Poly(methyl methacrylate)) substrate with an average roughness amplitude
$\geq$
99.5 %; G9012 from Sigma-Aldrich®) were used as droplet liquids. The impact surface was a smooth acrylic (Poly(methyl methacrylate)) substrate with an average roughness amplitude
 $R_a \approx 1.2$
nm (measured with Bruker-Nano, Contour GT-K, optical microscope). By varying the glycerol volume fraction
$R_a \approx 1.2$
nm (measured with Bruker-Nano, Contour GT-K, optical microscope). By varying the glycerol volume fraction
 $\phi _g$
from 0 % to 80 %, different glycerol–water mixtures were prepared with viscosity
$\phi _g$
from 0 % to 80 %, different glycerol–water mixtures were prepared with viscosity
 $\mu$
ranging from 1.01 to 91.46 mPa s, maintaining nearly invariant surface tension (
$\mu$
ranging from 1.01 to 91.46 mPa s, maintaining nearly invariant surface tension (
 $\sigma$
) and liquid density (
$\sigma$
) and liquid density (
 $\rho$
) at a room temperature of
$\rho$
) at a room temperature of
 $20 \pm 1 ^\circ$
C. The physical properties of the mixtures are listed in table 1; the viscosity and density values are obtained from Cheng (Reference Cheng2008) and Volk & Kähler (Reference Volk and Kähler2018), and surface tension values are obtained from Takamura, Fischer & Morrow (Reference Takamura, Fischer and Morrow2012).
$20 \pm 1 ^\circ$
C. The physical properties of the mixtures are listed in table 1; the viscosity and density values are obtained from Cheng (Reference Cheng2008) and Volk & Kähler (Reference Volk and Kähler2018), and surface tension values are obtained from Takamura, Fischer & Morrow (Reference Takamura, Fischer and Morrow2012).
Table 1. Glycerol volume fraction (
 $\phi _g$
), liquid viscosity (
$\phi _g$
), liquid viscosity (
 $\mu$
), surface tension (
$\mu$
), surface tension (
 $\sigma$
), liquid density (
$\sigma$
), liquid density (
 $\rho$
) of the glycerol-water mixtures, with the corresponding static (
$\rho$
) of the glycerol-water mixtures, with the corresponding static (
 $\theta _S$
), advancing (
$\theta _S$
), advancing (
 $\theta _A$
) and receding (
$\theta _A$
) and receding (
 $\theta _R$
) contact angles on the impact substrate, and the Ohnesorge numbers for droplet impacts.
$\theta _R$
) contact angles on the impact substrate, and the Ohnesorge numbers for droplet impacts.


Figure 2. Optical images of 6 µl droplets of (a) water (
 $\phi _g=0$
%) and (b) 80 vol. % glycerol–water mixture (
$\phi _g=0$
%) and (b) 80 vol. % glycerol–water mixture (
 $\phi _g=80$
%), with the corresponding static contact angle (
$\phi _g=80$
%), with the corresponding static contact angle (
 $\theta _S$
) measurements on the acrylic impact substrate.
$\theta _S$
) measurements on the acrylic impact substrate.
The static (
 $\theta _S$
), receding (
$\theta _S$
), receding (
 $\theta _R$
) and advancing (
$\theta _R$
) and advancing (
 $\theta _A$
) contact angles of the droplet liquids on the acrylic impact substrate were determined using a contact angle goniometer (model 100-12-U1-UPG, Ramé-Hart Inc., USA) and are listed in table 1. The reported angle values represent average values of at least six measurements repeated at different locations on the acrylic plate surface. Figure 2 shows example optical images of 6
$\theta _A$
) contact angles of the droplet liquids on the acrylic impact substrate were determined using a contact angle goniometer (model 100-12-U1-UPG, Ramé-Hart Inc., USA) and are listed in table 1. The reported angle values represent average values of at least six measurements repeated at different locations on the acrylic plate surface. Figure 2 shows example optical images of 6
 $\unicode{x03BC}$
l droplets with
$\unicode{x03BC}$
l droplets with
 $\phi _g = 0$
% and
$\phi _g = 0$
% and
 $\phi _g = 80$
%, with their respective static contact angle (
$\phi _g = 80$
%, with their respective static contact angle (
 $\theta$
) measurements.
$\theta$
) measurements.
Experiments were carried out by releasing simultaneous and non-simultaneous glycerol–water droplets using a custom-built, microcontroller-based droplet generator. The design and droplet release mechanism of the droplet generator were detailed in our previous work (Goswami & Hardalupas Reference Goswami and Hardalupas2023, Reference Goswami and Hardalupas2024). Before conducting experiments with a glycerol–water mixture, the tube and needles of the droplet generator were cleaned by pumping distilled water and then air through the tube-needle assembly. This cleaning procedure confirmed that no residue remained from prior experiments with different mixtures. In order to ensure trapped-air-free needle tips and to avoid any change in glycerol concentration due to ambient air humidity, a volume of liquid was drained out through the needle tips by employing a liquid jetting operation of the droplet generator before releasing the test droplets. After the impact of a test droplet pair on the impact substrate, the substrate was cleaned thoroughly with distilled water and made dry with tissue and compressed air before releasing the next droplet pair.
Two synchronised high-speed cameras simultaneously recorded the front and side perspectives of the impact events. A Nikon AF Nikkor 50 mm lens (aperture set to f/11) coupled with an achromatic lens (AC508-100-A-ML,
 $f = 100$
mm, Thorlabs) was attached at the front camera (FASTCAM APX RS, Photron), while a Nikon Micro-Nikkor 55 mm lens (aperture set to f/11) coupled with an achromatic lens (AC508-150-A-ML,
$f = 100$
mm, Thorlabs) was attached at the front camera (FASTCAM APX RS, Photron), while a Nikon Micro-Nikkor 55 mm lens (aperture set to f/11) coupled with an achromatic lens (AC508-150-A-ML,
 $f = 150$
mm, Thorlabs) was attached at the side camera (FASTCAM SA1.1, Photron). The imaging rate and the exposure time of both cameras were set to 9000 frames/s and 50
$f = 150$
mm, Thorlabs) was attached at the side camera (FASTCAM SA1.1, Photron). The imaging rate and the exposure time of both cameras were set to 9000 frames/s and 50
 $\unicode{x03BC}$
s, respectively. The front camera had an effective resolution of
$\unicode{x03BC}$
s, respectively. The front camera had an effective resolution of
 $640 \times 480$
pixel
$640 \times 480$
pixel
 $^2$
with a pixel size of 0.03 mm, while the side camera had a resolution of
$^2$
with a pixel size of 0.03 mm, while the side camera had a resolution of
 $896 \times 752$
pixel
$896 \times 752$
pixel
 $^2$
with a pixel size of 0.04 mm. Uniform illumination of the droplet-impact area was ensured using two LED lamps paired with diffusers, configured in a shadowgraph imaging arrangement, as shown in figure 1. The temporal resolution of the imaging set-up was
$^2$
with a pixel size of 0.04 mm. Uniform illumination of the droplet-impact area was ensured using two LED lamps paired with diffusers, configured in a shadowgraph imaging arrangement, as shown in figure 1. The temporal resolution of the imaging set-up was
 ${\approx} 0.11$
ms, corresponding to 9000 frames/s, and droplet impacts were considered ‘simultaneous’ only if both droplets made contact with the impact substrate within the same frame. The reference time
${\approx} 0.11$
ms, corresponding to 9000 frames/s, and droplet impacts were considered ‘simultaneous’ only if both droplets made contact with the impact substrate within the same frame. The reference time
 $t = 0$
(i.e.
$t = 0$
(i.e.
 $\tau = t V_0 / D_0 = 0$
) was defined as the moment of touchdown of both droplets for simultaneous impacts or the first droplet for non-simultaneous impacts. Experimental data on impact parameters (i.e.
$\tau = t V_0 / D_0 = 0$
) was defined as the moment of touchdown of both droplets for simultaneous impacts or the first droplet for non-simultaneous impacts. Experimental data on impact parameters (i.e.
 $D_0$
,
$D_0$
,
 $\Delta x$
and
$\Delta x$
and
 $V_0$
), droplet spreading behaviour and central sheet dynamics were extracted from the recorded images using several customised MATLAB image analysis routines, as detailed in our previous work (Goswami & Hardalupas Reference Goswami and Hardalupas2023). In general, these routines involved initial noise removal and contrast enhancement of the sequential 8-bit grey-scale images using specified filtering operations, followed by binarising the images with a set threshold. The resulting binary images were subsequently processed to extract the desired quantitative parameters, including operations such as binary image complementation, hole filling and the removal of objects with pixel counts smaller than a specified value. The initial droplet diameter was calculated as the area-equal diameter, given by
$V_0$
), droplet spreading behaviour and central sheet dynamics were extracted from the recorded images using several customised MATLAB image analysis routines, as detailed in our previous work (Goswami & Hardalupas Reference Goswami and Hardalupas2023). In general, these routines involved initial noise removal and contrast enhancement of the sequential 8-bit grey-scale images using specified filtering operations, followed by binarising the images with a set threshold. The resulting binary images were subsequently processed to extract the desired quantitative parameters, including operations such as binary image complementation, hole filling and the removal of objects with pixel counts smaller than a specified value. The initial droplet diameter was calculated as the area-equal diameter, given by
 $D_0 = 2\sqrt {A_p/\pi }$
, where
$D_0 = 2\sqrt {A_p/\pi }$
, where
 $A_p$
is the projected droplet area in an image (see Appendix A for further details). The impact velocity
$A_p$
is the projected droplet area in an image (see Appendix A for further details). The impact velocity
 $V_0$
was obtained from the measured displacement of the droplet between two successive images before impact. The inter-droplet spacing
$V_0$
was obtained from the measured displacement of the droplet between two successive images before impact. The inter-droplet spacing
 $\Delta x$
was defined as the distance between droplet centroids. The measurement uncertainties of
$\Delta x$
was defined as the distance between droplet centroids. The measurement uncertainties of
 $D_0$
,
$D_0$
,
 $\Delta x$
and
$\Delta x$
and
 $V_0$
are within
$V_0$
are within
 $1$
% (see Appendix A for details on the uncertainty analysis). The evolution of droplet spreading and central sheet dynamics was extracted from batches of post-impact images (
$1$
% (see Appendix A for details on the uncertainty analysis). The evolution of droplet spreading and central sheet dynamics was extracted from batches of post-impact images (
 $t\gt 0$
), as discussed in § 3.1. All experimental conditions were repeated at least three times, and the reported data are the mean values of the replicates.
$t\gt 0$
), as discussed in § 3.1. All experimental conditions were repeated at least three times, and the reported data are the mean values of the replicates.
The average initial droplet diameter
 $D_0$
for different droplet liquids was
$D_0$
for different droplet liquids was
 $3.25 \pm 0.13$
mm. The inter-droplet spacing
$3.25 \pm 0.13$
mm. The inter-droplet spacing
 $\Delta x$
was varied between
$\Delta x$
was varied between
 $\Delta x \approx 1.43 D_0$
and
$\Delta x \approx 1.43 D_0$
and
 $\Delta x \approx 1.85 D_0$
. The droplet-impact velocity
$\Delta x \approx 1.85 D_0$
. The droplet-impact velocity
 $V_0$
was varied by adjusting the droplet release height to achieve a target impact Weber number (
$V_0$
was varied by adjusting the droplet release height to achieve a target impact Weber number (
 $ \textit{We}$
) as follows. First, the required impact velocity
$ \textit{We}$
) as follows. First, the required impact velocity
 $V_0$
for the impact
$V_0$
for the impact
 $ \textit{We}$
was estimated from
$ \textit{We}$
was estimated from
 $V_0 = \sqrt {\sigma \textit{We} / \rho D_0}$
for a given droplet liquid. Then, the corresponding approximate droplet release height
$V_0 = \sqrt {\sigma \textit{We} / \rho D_0}$
for a given droplet liquid. Then, the corresponding approximate droplet release height
 $z_D$
was calculated from
$z_D$
was calculated from
 $V_0 = \sqrt {2g(z_D - D_0)}$
, where
$V_0 = \sqrt {2g(z_D - D_0)}$
, where
 $g$
is the gravitational acceleration. The height of the needle tips for the experiment was then initially fixed based on this calculation. However, after recording a few test experiments and based on the measured
$g$
is the gravitational acceleration. The height of the needle tips for the experiment was then initially fixed based on this calculation. However, after recording a few test experiments and based on the measured
 $D_0$
and
$D_0$
and
 $V_0$
of the test droplets through image post-processing, further adjustments on the droplet release height were introduced to achieve the target impact
$V_0$
of the test droplets through image post-processing, further adjustments on the droplet release height were introduced to achieve the target impact
 $ \textit{We}$
more precisely. The impact
$ \textit{We}$
more precisely. The impact
 $ \textit{We}$
in the experiments ranged from
$ \textit{We}$
in the experiments ranged from
 $54$
to
$54$
to
 $188$
, corresponding to droplet-impact velocities
$188$
, corresponding to droplet-impact velocities
 $V_0$
from
$V_0$
from
 $1.13\ \mathrm{}$
to
$1.13\ \mathrm{}$
to
 $1.78\ \mathrm{m\,s^{-1}}$
. The dimensionless Ohnesorge number (
$1.78\ \mathrm{m\,s^{-1}}$
. The dimensionless Ohnesorge number (
 $ \textit{Oh}$
) was varied from
$ \textit{Oh}$
) was varied from
 ${\sim} 0.002$
to
${\sim} 0.002$
to
 ${\sim} 0.177$
(table 1). The shape of a falling droplet can oscillate and deviate from a spherical form prior to impact; Thoroddsen & Sakakibara (Reference Thoroddsen and Sakakibara1998) observed up to
${\sim} 0.177$
(table 1). The shape of a falling droplet can oscillate and deviate from a spherical form prior to impact; Thoroddsen & Sakakibara (Reference Thoroddsen and Sakakibara1998) observed up to
 ${\approx} 20$
% deviations in water droplet sphericity for an impact with
${\approx} 20$
% deviations in water droplet sphericity for an impact with
 $ \textit{We}\approx 363$
. In our experiments, the droplets were also not perfectly spherical. The circularity ratio,
$ \textit{We}\approx 363$
. In our experiments, the droplets were also not perfectly spherical. The circularity ratio,
 $C = 4\pi A/P^2$
(with
$C = 4\pi A/P^2$
(with
 $A$
as the droplet area and
$A$
as the droplet area and
 $P$
as the droplet perimeter), was evaluated from
$P$
as the droplet perimeter), was evaluated from
 $20$
consecutive images prior to impact using the MATLAB regionprops function in the image analysis routine. Across all experimental conditions of this study (
$20$
consecutive images prior to impact using the MATLAB regionprops function in the image analysis routine. Across all experimental conditions of this study (
 $54 \leq \textit{We} \leq 188$
,
$54 \leq \textit{We} \leq 188$
,
 $0.002 \leq Oh \leq 0.177$
), the mean circularity ratio of droplets was
$0.002 \leq Oh \leq 0.177$
), the mean circularity ratio of droplets was
 $0.95 \pm 0.02$
(
$0.95 \pm 0.02$
(
 $\pm$
one standard deviation). In addition, for each droplet, its horizontal diameter
$\pm$
one standard deviation). In addition, for each droplet, its horizontal diameter
 $D_h$
and vertical diameter
$D_h$
and vertical diameter
 $D_v$
before impact were measured from consecutive images, and the percentage difference between these diameters, calculated as
$D_v$
before impact were measured from consecutive images, and the percentage difference between these diameters, calculated as
 $\lvert D_h - D_v \rvert /( (D_h + D_v)/2 ) \times 100$
, was within
$\lvert D_h - D_v \rvert /( (D_h + D_v)/2 ) \times 100$
, was within
 $\pm 3.2$
% for all cases. These deviations in droplet sphericity are considerably smaller than those reported by Thoroddsen & Sakakibara (Reference Thoroddsen and Sakakibara1998), consistent with the lower Weber number range of the current study, where droplet oscillations are less pronounced. Such small droplet sphericity deviations at the moment of impact led to negligible shape effects in lamella spreading and sheet evolution in the present experiments. Furthermore, in all cases examined in this study, interaction between droplet lamellae and the onset of central sheet formation occurred only after the early spreading phase (
$\pm 3.2$
% for all cases. These deviations in droplet sphericity are considerably smaller than those reported by Thoroddsen & Sakakibara (Reference Thoroddsen and Sakakibara1998), consistent with the lower Weber number range of the current study, where droplet oscillations are less pronounced. Such small droplet sphericity deviations at the moment of impact led to negligible shape effects in lamella spreading and sheet evolution in the present experiments. Furthermore, in all cases examined in this study, interaction between droplet lamellae and the onset of central sheet formation occurred only after the early spreading phase (
 $\tau \gt 0.4$
).
$\tau \gt 0.4$
).
3. Results and discussion
This section presents the effect of droplet liquid viscosity on simultaneous and non-simultaneous impacts of water–glycerol droplet pairs through morphological and quantitative analyses of the impact processes.
3.1. Impact morphologies
Figure 3 shows the temporal evolution of the morphology of simultaneous droplet-pair impacts for droplets with glycerol volume fraction
 $\phi _g$
ranging from 0 % to 80 % through time-resolved front-view images and side-view insets. The impact Weber number (
$\phi _g$
ranging from 0 % to 80 % through time-resolved front-view images and side-view insets. The impact Weber number (
 $ \textit{We}$
) and the non-dimensional inter-droplet spacing (
$ \textit{We}$
) and the non-dimensional inter-droplet spacing (
 $\Delta x^* = \Delta x / D_0$
) for these droplet impacts are fixed at
$\Delta x^* = \Delta x / D_0$
) for these droplet impacts are fixed at
 $ \textit{We} = 130 \pm 2$
and
$ \textit{We} = 130 \pm 2$
and
 $\Delta x^* = 1.80 \pm 0.04$
, respectively. For pure water droplets (i.e.
$\Delta x^* = 1.80 \pm 0.04$
, respectively. For pure water droplets (i.e.
 $\phi _g = 0$
%), the interaction between the two droplet lamellae generates stagnation points along their interaction line, where the liquid flows in the lamellae are redirected upward and sideways. At the midpoint of this interaction line (aligned with the
$\phi _g = 0$
%), the interaction between the two droplet lamellae generates stagnation points along their interaction line, where the liquid flows in the lamellae are redirected upward and sideways. At the midpoint of this interaction line (aligned with the
 $z$
-axis of the test rig coordinate system), the upward flow is maximum and reduces symmetrically about the
$z$
-axis of the test rig coordinate system), the upward flow is maximum and reduces symmetrically about the
 $z$
-axis, generating a rim-bounded uprising ‘semilunar’ central sheet, as depicted in the inset image for
$z$
-axis, generating a rim-bounded uprising ‘semilunar’ central sheet, as depicted in the inset image for
 $\tau = 0.75$
and
$\tau = 0.75$
and
 $\phi _g = 0$
% in figure 3. Similar ‘semilunar’ sheets are also observed for glycerol–water droplet pairs with
$\phi _g = 0$
% in figure 3. Similar ‘semilunar’ sheets are also observed for glycerol–water droplet pairs with
 $\phi _g = 40$
% and 60 % (figure 3), which possess higher viscosities than the water droplets (
$\phi _g = 40$
% and 60 % (figure 3), which possess higher viscosities than the water droplets (
 $\phi _g = 0$
%). However, with increased liquid viscosity (i.e. higher
$\phi _g = 0$
%). However, with increased liquid viscosity (i.e. higher
 $ \textit{Oh}$
), the central sheet size reduces and dissipates faster due to the increased shear stress within the droplet liquid, resisting droplet deformation and central sheet growth. Consequently, as
$ \textit{Oh}$
), the central sheet size reduces and dissipates faster due to the increased shear stress within the droplet liquid, resisting droplet deformation and central sheet growth. Consequently, as
 $\phi _g$
is increased to 70 % and 80 %, the sheets’ ‘semilunar’ shape does not appear in side-view images; instead, the sheets’ front views resemble relatively ephemeral liquid bumps, similar to those formed during the coalescence of two droplets upon their low-velocity impacts (Batzdorf et al. Reference Batzdorf, Breitenbach, Schlawitschek, Roisman, Tropea, Stephan and Gambaryan-Roisman2017). It is noted that probing the velocity field within thin liquid films, such as lamellae and the central uprising sheet, is experimentally challenging. Kanjirakat et al. (Reference Kanjirakat, Sadr and Alvarado2021) used microparticle tracking velocimetry (
$\phi _g$
is increased to 70 % and 80 %, the sheets’ ‘semilunar’ shape does not appear in side-view images; instead, the sheets’ front views resemble relatively ephemeral liquid bumps, similar to those formed during the coalescence of two droplets upon their low-velocity impacts (Batzdorf et al. Reference Batzdorf, Breitenbach, Schlawitschek, Roisman, Tropea, Stephan and Gambaryan-Roisman2017). It is noted that probing the velocity field within thin liquid films, such as lamellae and the central uprising sheet, is experimentally challenging. Kanjirakat et al. (Reference Kanjirakat, Sadr and Alvarado2021) used microparticle tracking velocimetry (
 $\mu$
PTV) to measure the near-wall velocities in the impingement zone of a droplet train and found significant differences compared with a jet-stream impact, primarily due to the enhanced mixing induced by the crown propagation on the substrate. The droplet impacts studied here do not exhibit such crown propagation around the impact centres, but rather involve interacting lamella segments that generate an uprising ‘semilunar’ sheet with distinct morphological characteristics. Therefore, although the present study does not measure liquid velocity fields, these observations highlight the need for future measurements using
$\mu$
PTV) to measure the near-wall velocities in the impingement zone of a droplet train and found significant differences compared with a jet-stream impact, primarily due to the enhanced mixing induced by the crown propagation on the substrate. The droplet impacts studied here do not exhibit such crown propagation around the impact centres, but rather involve interacting lamella segments that generate an uprising ‘semilunar’ sheet with distinct morphological characteristics. Therefore, although the present study does not measure liquid velocity fields, these observations highlight the need for future measurements using
 $\mu$
PTV or similar techniques to probe the flow within the central interaction zone and explore further the hydrodynamics of droplet-pair impacts.
$\mu$
PTV or similar techniques to probe the flow within the central interaction zone and explore further the hydrodynamics of droplet-pair impacts.

Figure 3. Impact morphologies of droplet pairs of different glycerol–water mixtures with glycerol volume fraction
 $\phi _g$
from 0 % (
$\phi _g$
from 0 % (
 $\mu = 1.01$
mPa s,
$\mu = 1.01$
mPa s,
 $ \textit{Oh} = 0.002$
) to 80 % (
$ \textit{Oh} = 0.002$
) to 80 % (
 $\mu = 91.46$
mPa s,
$\mu = 91.46$
mPa s,
 $ \textit{Oh} = 0.177$
). Related physical properties are summarised in table 1. The 2 mm scale bar indicated in the first front-view image applies to all front-view images and the 2 mm scale bar indicated in the first side-view inset applies to all side-view insets. The Weber number (
$ \textit{Oh} = 0.177$
). Related physical properties are summarised in table 1. The 2 mm scale bar indicated in the first front-view image applies to all front-view images and the 2 mm scale bar indicated in the first side-view inset applies to all side-view insets. The Weber number (
 $ \textit{We}$
) and the dimensionless inter-droplet spacing (
$ \textit{We}$
) and the dimensionless inter-droplet spacing (
 $\Delta x^*$
) are maintained at
$\Delta x^*$
) are maintained at
 $ \textit{We} = 130 \pm 2$
and
$ \textit{We} = 130 \pm 2$
and
 $\Delta x^* = 1.80 \pm 0.04$
, respectively.
$\Delta x^* = 1.80 \pm 0.04$
, respectively.

Figure 4. Impact morphologies of droplet pairs of different glycerol–water mixtures with glycerol volume fraction
 $\phi _g$
from 0 % (
$\phi _g$
from 0 % (
 $\mu = 1.01$
mPa s,
$\mu = 1.01$
mPa s,
 $ \textit{Oh} = 0.002$
) to 80 % (
$ \textit{Oh} = 0.002$
) to 80 % (
 $\mu = 91.46$
mPa s,
$\mu = 91.46$
mPa s,
 $ \textit{Oh} = 0.177$
). Related physical properties are summarised in table 1. The 2 mm scale bar indicated in the first front-view image applies to all front-view images and the 2 mm scale bar indicated in the first side-view inset applies to all side-view insets. The Weber number (
$ \textit{Oh} = 0.177$
). Related physical properties are summarised in table 1. The 2 mm scale bar indicated in the first front-view image applies to all front-view images and the 2 mm scale bar indicated in the first side-view inset applies to all side-view insets. The Weber number (
 $ \textit{We}$
) and the dimensionless inter-droplet spacing (
$ \textit{We}$
) and the dimensionless inter-droplet spacing (
 $\Delta x^*$
) are maintained at
$\Delta x^*$
) are maintained at
 $ \textit{We} = 104 \pm 1$
and
$ \textit{We} = 104 \pm 1$
and
 $\Delta x^* = 1.80 \pm 0.03$
, respectively.
$\Delta x^* = 1.80 \pm 0.03$
, respectively.

Figure 5. Impact morphologies of droplet pairs of different glycerol–water mixtures with glycerol volume fraction
 $\phi _g$
from 0 % (
$\phi _g$
from 0 % (
 $\mu = 1.01$
mPa s,
$\mu = 1.01$
mPa s,
 $ \textit{Oh} = 0.002$
) to 80 % (
$ \textit{Oh} = 0.002$
) to 80 % (
 $\mu = 91.46$
mPa s,
$\mu = 91.46$
mPa s,
 $ \textit{Oh} = 0.177$
). Related physical properties are summarised in table 1. The 2 mm scale bar indicated in the first front-view image applies to all front-view images and the 2 mm scale bar indicated in the first side-view inset applies to all side-view insets. The Weber number (
$ \textit{Oh} = 0.177$
). Related physical properties are summarised in table 1. The 2 mm scale bar indicated in the first front-view image applies to all front-view images and the 2 mm scale bar indicated in the first side-view inset applies to all side-view insets. The Weber number (
 $ \textit{We}$
) and the dimensionless inter-droplet spacing (
$ \textit{We}$
) and the dimensionless inter-droplet spacing (
 $\Delta x^*$
) are maintained at
$\Delta x^*$
) are maintained at
 $ \textit{We} = 81 \pm 2$
and
$ \textit{We} = 81 \pm 2$
and
 $\Delta x^* = 1.80 \pm 0.03$
, respectively.
$\Delta x^* = 1.80 \pm 0.03$
, respectively.

Figure 6. Schematic representation of the characteristic quantities measured for the impact processes: the lamella spread radius (
 $R$
), the central sheet height (
$R$
), the central sheet height (
 $H_S$
), the sheet length (
$H_S$
), the sheet length (
 $L_S$
), the lamella edge velocity (
$L_S$
), the lamella edge velocity (
 $V_L$
) and the lamella edge thickness (
$V_L$
) and the lamella edge thickness (
 $T_L$
).
$T_L$
).
Figures 4 and 5 show droplet-pair impact morphologies for different
 $\phi _g$
values for two other impact Weber numbers,
$\phi _g$
values for two other impact Weber numbers,
 $ \textit{We} = 104 \pm 1$
and
$ \textit{We} = 104 \pm 1$
and
 $ \textit{We} = 81 \pm 2$
, respectively, while keeping the inter-droplet spacing unchanged at
$ \textit{We} = 81 \pm 2$
, respectively, while keeping the inter-droplet spacing unchanged at
 $\Delta x^* \approx 1.80$
. The temporal evolutions of these impact cases are qualitatively similar to those observed for
$\Delta x^* \approx 1.80$
. The temporal evolutions of these impact cases are qualitatively similar to those observed for
 $ \textit{We} \approx 130$
in figure 3. However, for
$ \textit{We} \approx 130$
in figure 3. However, for
 $ \textit{We} \approx 81$
and
$ \textit{We} \approx 81$
and
 $\phi _g = 80$
%, the interaction between two lamellae is not strong enough to form a central sheet (or liquid bump). Instead, the lamella fronts gently touch and coalesce during the impact process. This weak interaction directly results from the combined effect of the reduced impact Weber number and increased Ohnesorge number (
$\phi _g = 80$
%, the interaction between two lamellae is not strong enough to form a central sheet (or liquid bump). Instead, the lamella fronts gently touch and coalesce during the impact process. This weak interaction directly results from the combined effect of the reduced impact Weber number and increased Ohnesorge number (
 $ \textit{Oh}$
), indicative of the reduced impact inertia and increased viscous dissipation. The next section will provide a quantitative assessment of the liquid viscosity effect on lamella spreading.
$ \textit{Oh}$
), indicative of the reduced impact inertia and increased viscous dissipation. The next section will provide a quantitative assessment of the liquid viscosity effect on lamella spreading.
Careful observation of the impact processes shown in figure 3–5 reveals several impact characteristics as follows. For a given impact Weber number (
 $ \textit{We}$
) and non-dimensional inter-droplet spacing (
$ \textit{We}$
) and non-dimensional inter-droplet spacing (
 $\Delta x^*$
), a higher droplet liquid viscosity (i.e. higher
$\Delta x^*$
), a higher droplet liquid viscosity (i.e. higher
 $ \textit{Oh}$
or
$ \textit{Oh}$
or
 $\phi _g$
) leads to a delayed lamella interaction and increased lamella-front thickness at their first instant of interaction, i.e. at
$\phi _g$
) leads to a delayed lamella interaction and increased lamella-front thickness at their first instant of interaction, i.e. at
 $\tau = \tau _0$
. This increased lamella thickness for higher liquid viscosities is not surprising, as the thickness of a spreading lamella formed during droplet impact on a solid substrate scales with a viscous boundary layer thickness,
$\tau = \tau _0$
. This increased lamella thickness for higher liquid viscosities is not surprising, as the thickness of a spreading lamella formed during droplet impact on a solid substrate scales with a viscous boundary layer thickness,
 $\sqrt {\nu t}$
, with
$\sqrt {\nu t}$
, with
 $\nu (= \mu / \rho )$
as the kinematic viscosity of the droplet liquid (Josserand et al. Reference Josserand, Lemoyne, Troeger and Zaleski2005; Roisman, Horvat & Tropea Reference Roisman, Horvat and Tropea2006; Xu, Barcos & Nagel Reference Xu, Barcos and Nagel2007; Bird, Tsai & Stone Reference Bird, Tsai and Stone2009). Consequently, the interaction of thicker lamella fronts leads to thicker central sheet formation for high-viscosity droplet impacts, as revealed in figures 3–5. For droplet impacts with
$\nu (= \mu / \rho )$
as the kinematic viscosity of the droplet liquid (Josserand et al. Reference Josserand, Lemoyne, Troeger and Zaleski2005; Roisman, Horvat & Tropea Reference Roisman, Horvat and Tropea2006; Xu, Barcos & Nagel Reference Xu, Barcos and Nagel2007; Bird, Tsai & Stone Reference Bird, Tsai and Stone2009). Consequently, the interaction of thicker lamella fronts leads to thicker central sheet formation for high-viscosity droplet impacts, as revealed in figures 3–5. For droplet impacts with
 $\phi _g = 0$
%, several concentric ripples (capillary waves) appear on the ascending central sheet surface and propagate toward the outer sheet rim (figures 3–5). The outer rim of these central sheets becomes destabilised with corrugations due to coupled Rayleigh–Taylor and Rayleigh–Plateau instabilities, as identified in our previous work (Goswami & Hardalupas Reference Goswami and Hardalupas2023). These instabilities amplify the sheet rim corrugations, eventually forming protruding fingers during the vertical descent of the central sheet. In contrast, such propagating ripples and subsequent rim corrugations are not observed for the droplet impacts with
$\phi _g = 0$
%, several concentric ripples (capillary waves) appear on the ascending central sheet surface and propagate toward the outer sheet rim (figures 3–5). The outer rim of these central sheets becomes destabilised with corrugations due to coupled Rayleigh–Taylor and Rayleigh–Plateau instabilities, as identified in our previous work (Goswami & Hardalupas Reference Goswami and Hardalupas2023). These instabilities amplify the sheet rim corrugations, eventually forming protruding fingers during the vertical descent of the central sheet. In contrast, such propagating ripples and subsequent rim corrugations are not observed for the droplet impacts with
 $\phi _g \gt 0$
%, indicating that the liquid viscosity suppresses the capillary waves. The next sections present a qualitative and quantitative analysis of the spreading dynamics and central sheet evolution for such droplet-pair impacts. Figure 6 provides a schematic overview of the main quantities measured and discussed in these sections.
$\phi _g \gt 0$
%, indicating that the liquid viscosity suppresses the capillary waves. The next sections present a qualitative and quantitative analysis of the spreading dynamics and central sheet evolution for such droplet-pair impacts. Figure 6 provides a schematic overview of the main quantities measured and discussed in these sections.
The evolution of the central sheet height (
 $H_S$
) and the liquid spreading on the impact surface (i.e. spread radius
$H_S$
) and the liquid spreading on the impact surface (i.e. spread radius
 $R$
and lamella edge velocity
$R$
and lamella edge velocity
 $V_L$
) was quantified from predefined batches of filtered post-impact binary front-view images. For the measurement of
$V_L$
) was quantified from predefined batches of filtered post-impact binary front-view images. For the measurement of
 $H_S$
, the vertical position of the peak of the central sheet relative to the impact substrate, and for the measurement of
$H_S$
, the vertical position of the peak of the central sheet relative to the impact substrate, and for the measurement of
 $R$
and
$R$
and
 $V_L$
, the horizontal positions of extreme points of the lamellae on the impact substrate were tracked in the processed images. An essential input parameter to these analyses is the position of the impact substrate line (the horizontal red dashed line in figure 6), which was carefully determined from the corresponding touchdown frame (e.g. images for
$V_L$
, the horizontal positions of extreme points of the lamellae on the impact substrate were tracked in the processed images. An essential input parameter to these analyses is the position of the impact substrate line (the horizontal red dashed line in figure 6), which was carefully determined from the corresponding touchdown frame (e.g. images for
 $\tau = 0$
in figures 5–6) based on the intersection of the droplet and its mirror reflection. It is noted that although fingers appear in central sheets for the water droplet (
$\tau = 0$
in figures 5–6) based on the intersection of the droplet and its mirror reflection. It is noted that although fingers appear in central sheets for the water droplet (
 $\phi _g = 0$
%) impacts with impact
$\phi _g = 0$
%) impacts with impact
 $ \textit{We} = 130$
and
$ \textit{We} = 130$
and
 $104$
, the fingers are formed only during the vertical descent of central sheets, i.e. only after
$104$
, the fingers are formed only during the vertical descent of central sheets, i.e. only after
 $\tau _{\textit{max}}$
(corresponding to the maximum sheet height,
$\tau _{\textit{max}}$
(corresponding to the maximum sheet height,
 $H_{S,\textit{max}}$
). This finger formation can lead to relatively increased standard deviations in sheet height (
$H_{S,\textit{max}}$
). This finger formation can lead to relatively increased standard deviations in sheet height (
 $H_S$
) measurements for
$H_S$
) measurements for
 $\tau \gt \tau _{\textit{max}}$
, as shown in § 3.3 (figure 9). The length of the inclined central sheet,
$\tau \gt \tau _{\textit{max}}$
, as shown in § 3.3 (figure 9). The length of the inclined central sheet,
 $L_S$
, for non-simultaneous droplet impacts was measured by analysing a predefined batch of images, as detailed in Appendix B. The lamella edge thickness (
$L_S$
, for non-simultaneous droplet impacts was measured by analysing a predefined batch of images, as detailed in Appendix B. The lamella edge thickness (
 $T_L$
) was measured only for the instant of the onset of lamella–lamella interaction (i.e. for
$T_L$
) was measured only for the instant of the onset of lamella–lamella interaction (i.e. for
 $\tau = \tau _0$
), using ImageJ software, as discussed in Appendix A.
$\tau = \tau _0$
), using ImageJ software, as discussed in Appendix A.
3.2. Spreading dynamics
In this section, the time-dependent radius of spreading lamellae, denoted by
 $R(\tau )$
and defined in the inset image of figure 7, for different viscosity cases is explored while compared with existing theoretical models. It is noted that, although numerous theoretical models for predicting the maximum spread radius (
$R(\tau )$
and defined in the inset image of figure 7, for different viscosity cases is explored while compared with existing theoretical models. It is noted that, although numerous theoretical models for predicting the maximum spread radius (
 $R_{\textit{max}}$
) have been proposed in the literature (Josserand & Thoroddsen Reference Josserand and Thoroddsen2016), quite a few studies have proposed theories for predicting the instantaneous spread radius
$R_{\textit{max}}$
) have been proposed in the literature (Josserand & Thoroddsen Reference Josserand and Thoroddsen2016), quite a few studies have proposed theories for predicting the instantaneous spread radius
 $R(\tau )$
(Roisman et al. Reference Roisman, Prunet-Foch, Tropea and Vignes-Adler2002; Gordillo, Riboux & Quintero Reference Gordillo, Riboux and Quintero2019). Among these, the theory by Roisman et al. (Reference Roisman, Prunet-Foch, Tropea and Vignes-Adler2002) assumes cylindrical droplet spreading beyond
$R(\tau )$
(Roisman et al. Reference Roisman, Prunet-Foch, Tropea and Vignes-Adler2002; Gordillo, Riboux & Quintero Reference Gordillo, Riboux and Quintero2019). Among these, the theory by Roisman et al. (Reference Roisman, Prunet-Foch, Tropea and Vignes-Adler2002) assumes cylindrical droplet spreading beyond
 $\tau = 1$
, leading to significant overestimation of
$\tau = 1$
, leading to significant overestimation of
 $R(\tau )$
, as shown in Goswami & Hardalupas (Reference Goswami and Hardalupas2023). In contrast, the spreading theory of Gordillo et al. (Reference Gordillo, Riboux and Quintero2019) reliably predicts the dimensionless spread radius,
$R(\tau )$
, as shown in Goswami & Hardalupas (Reference Goswami and Hardalupas2023). In contrast, the spreading theory of Gordillo et al. (Reference Gordillo, Riboux and Quintero2019) reliably predicts the dimensionless spread radius,
 $R^*(\tau ) = R(\tau ) / D_0$
, for water droplet impacts across different impact Weber numbers (Goswami & Hardalupas Reference Goswami and Hardalupas2023, Reference Goswami and Hardalupas2024). However, this theory depends on some adjustable constants, which have not been verified in the literature for high-viscosity droplet impacts, such as those involving droplets with
$R^*(\tau ) = R(\tau ) / D_0$
, for water droplet impacts across different impact Weber numbers (Goswami & Hardalupas Reference Goswami and Hardalupas2023, Reference Goswami and Hardalupas2024). However, this theory depends on some adjustable constants, which have not been verified in the literature for high-viscosity droplet impacts, such as those involving droplets with
 $\phi _g = 70$
% (
$\phi _g = 70$
% (
 $ \textit{Oh} = 0.067$
) and
$ \textit{Oh} = 0.067$
) and
 $\phi _g = 80$
% (
$\phi _g = 80$
% (
 $ \textit{Oh} = 0.177$
) in the present study. Therefore, this section initially evaluates how the proposed model of Gordillo et al. (Reference Gordillo, Riboux and Quintero2019) compares with the experimental data for high-viscosity cases of the present study, such as those involving
$ \textit{Oh} = 0.177$
) in the present study. Therefore, this section initially evaluates how the proposed model of Gordillo et al. (Reference Gordillo, Riboux and Quintero2019) compares with the experimental data for high-viscosity cases of the present study, such as those involving
 $\phi _g = 70$
% and 80 %.
$\phi _g = 70$
% and 80 %.
Gordillo et al. (Reference Gordillo, Riboux and Quintero2019) proposed a set of differential equations derived from mass and momentum balances at the expanding rim as follows:
 \begin{align} \left . \begin{aligned} \phi \frac {\pi }{4} \frac {{\rm d} w^2}{{\rm d} t^*} &= [u(s,t^*) - v] h(s,t^*) \\[5pt]\frac {{\rm d} r}{{\rm d} t^*} &= v \\[5pt]\phi \frac {\pi }{4} w^2 \frac {{\rm d} v}{{\rm d} t^*} &= [u(s,t^*) - v]^2 h(s,t^*) - (1 + \varepsilon ) \textit{We}_R^{-1} \end{aligned} \right \} , \end{align}
with
 $h(r,t^*)$
the dimensionless averaged lamella thickness and
$h(r,t^*)$
the dimensionless averaged lamella thickness and
 $u(r,t^*)$
is the dimensionless averaged radial velocity of the lamella. Also,
$u(r,t^*)$
is the dimensionless averaged radial velocity of the lamella. Also,
 $s(t^*)$
,
$s(t^*)$
,
 $w(t^*)$
and
$w(t^*)$
and
 $v(t^*)$
are the dimensionless radial position, thickness and velocity of the outer lamella rim. It is noted that Gordillo et al. (Reference Gordillo, Riboux and Quintero2019) considered the initial droplet radius
$v(t^*)$
are the dimensionless radial position, thickness and velocity of the outer lamella rim. It is noted that Gordillo et al. (Reference Gordillo, Riboux and Quintero2019) considered the initial droplet radius
 $R_0$
as the characteristic length scale for normalising relevant parameters, whereas this study considers the initial diameter
$R_0$
as the characteristic length scale for normalising relevant parameters, whereas this study considers the initial diameter
 $D_0 (= 2R_0)$
. This consideration leads to their dimensionless time being expressed as
$D_0 (= 2R_0)$
. This consideration leads to their dimensionless time being expressed as
 $t^* (= 2\tau )$
and the dimensionless spread radius as
$t^* (= 2\tau )$
and the dimensionless spread radius as
 $r (\approx s(t^*)) = 2R^*(\tau )$
. For our impact cases, the impact substrate is hydrophilic, resulting in the geometric parameter
$r (\approx s(t^*)) = 2R^*(\tau )$
. For our impact cases, the impact substrate is hydrophilic, resulting in the geometric parameter
 $\phi = 1/2$
and the wettability-related parameter
$\phi = 1/2$
and the wettability-related parameter
 $\varepsilon = 0$
(see Gordillo et al. Reference Gordillo, Riboux and Quintero2019 for more details).
$\varepsilon = 0$
(see Gordillo et al. Reference Gordillo, Riboux and Quintero2019 for more details).
Equation (3.1) was numerically solved using the initial boundary conditions detailed in Gordillo et al. (Reference Gordillo, Riboux and Quintero2019) using MATLAB ODE45 solver, while determining
 $u(r,t^*)$
and
$u(r,t^*)$
and
 $h(r,t^*)$
using the analytical expressions by Gordillo et al. (Reference Gordillo, Riboux and Quintero2019) as follows:
$h(r,t^*)$
using the analytical expressions by Gordillo et al. (Reference Gordillo, Riboux and Quintero2019) as follows:
 \begin{align} u(r,t^*) = \frac {r}{t^*} - \frac {Re^{-1/2}}{t^*} \left [ \frac {\sqrt {3} \chi x}{2 h_a (x)} + \frac {2\sqrt {3} \lambda }{7 h_a (x) x^{5/2}} \big (t^{*7/2} - x^{7/2} \big ) \right ] , \\[-28pt] \nonumber \end{align}
 \begin{align} h(r,t^*) &= 9 \frac {t^{*2}}{r^4} h_a \big [ 3 (t^* / r)^2 \big ] + \frac {Re^{-1/2}}{r t^*} \left [ \frac {\sqrt {3}}{2} x^2 + \frac {\sqrt {3} (105\chi - 60\lambda )}{42} x^3 \big (t^{*-1} - x^{-1} \big ) \right ] \nonumber \\&\quad + \frac {24\sqrt {3} \lambda }{105} x^{-1/2} \big (t^{*5/2} - x^{5/2} \big ), \\[0pt] \nonumber \end{align}
where
 $x = 3 ({t^*}/{r} )^2$
. The function
$x = 3 ({t^*}/{r} )^2$
. The function
 $h_a (x)$
was approximated using a polynomial function reported in Gordillo et al. (Reference Gordillo, Riboux and Quintero2019).
$h_a (x)$
was approximated using a polynomial function reported in Gordillo et al. (Reference Gordillo, Riboux and Quintero2019).
The solution process requires approximating two constants
 $\lambda$
and
$\lambda$
and
 $\chi$
in (3.2) and (3.3), where
$\chi$
in (3.2) and (3.3), where
 $\lambda$
is a free constant that absorbs the assumptions in the theory (
$\lambda$
is a free constant that absorbs the assumptions in the theory (
 $\lambda \neq 0$
in the presence of a viscous boundary layer on the impact substrate) and
$\lambda \neq 0$
in the presence of a viscous boundary layer on the impact substrate) and
 $\chi$
is a constant used for boundary condition approximation, as explained in Gordillo et al. (Reference Gordillo, Riboux and Quintero2019). Gordillo et al. (Reference Gordillo, Riboux and Quintero2019) fixed
$\chi$
is a constant used for boundary condition approximation, as explained in Gordillo et al. (Reference Gordillo, Riboux and Quintero2019). Gordillo et al. (Reference Gordillo, Riboux and Quintero2019) fixed
 $\lambda = 1$
based on the fit between the theoretical prediction and their experimental data. Additionally, they found
$\lambda = 1$
based on the fit between the theoretical prediction and their experimental data. Additionally, they found
 $\chi = 0.6$
worked well for the Ohnesorge number range
$\chi = 0.6$
worked well for the Ohnesorge number range
 $10^{-3} \lesssim Oh \lesssim 10^{-2}$
and proposed
$10^{-3} \lesssim Oh \lesssim 10^{-2}$
and proposed
 $\chi \lt 0.6$
for droplet impacts with higher
$\chi \lt 0.6$
for droplet impacts with higher
 $ \textit{Oh}$
(viscosity), i.e. for higher-viscosity boundary layer thickness.
$ \textit{Oh}$
(viscosity), i.e. for higher-viscosity boundary layer thickness.
Figure 7 shows a comparison of the proposed model of Gordillo et al. (Reference Gordillo, Riboux and Quintero2019) with the experimental data for
 $\phi _g = 70$
% (
$\phi _g = 70$
% (
 $ \textit{Oh} = 0.067$
) and
$ \textit{Oh} = 0.067$
) and
 $\phi _g = 80$
% (
$\phi _g = 80$
% (
 $ \textit{Oh} = 0.177$
), for an impact Weber number
$ \textit{Oh} = 0.177$
), for an impact Weber number
 $ \textit{We} = 81$
. For these high-viscosity cases, the theory cannot be solved by applying
$ \textit{We} = 81$
. For these high-viscosity cases, the theory cannot be solved by applying
 $\chi = 0.6$
; instead, as proposed by Gordillo et al. (Reference Gordillo, Riboux and Quintero2019) for similar conditions, adjustment of
$\chi = 0.6$
; instead, as proposed by Gordillo et al. (Reference Gordillo, Riboux and Quintero2019) for similar conditions, adjustment of
 $\chi$
to a new value of
$\chi$
to a new value of
 $\chi \lt 0.6$
was required to obtain solutions. Accordingly, for each case, starting from
$\chi \lt 0.6$
was required to obtain solutions. Accordingly, for each case, starting from
 $\chi = 0.60$
, the
$\chi = 0.60$
, the
 $\chi$
value was decreased in
$\chi$
value was decreased in
 $0.01$
increments until the first value resulting in a solution to the theory was identified, yielding
$0.01$
increments until the first value resulting in a solution to the theory was identified, yielding
 $\chi \approx 0.46$
and
$\chi \approx 0.46$
and
 $\chi \approx 0.30$
for
$\chi \approx 0.30$
for
 $\phi _g = 70$
% and
$\phi _g = 70$
% and
 $\phi _g = 80$
%, respectively. The other constant
$\phi _g = 80$
%, respectively. The other constant
 $\lambda$
is fixed at
$\lambda$
is fixed at
 $\lambda = 1$
, as set by Gordillo et al. (Reference Gordillo, Riboux and Quintero2019).
$\lambda = 1$
, as set by Gordillo et al. (Reference Gordillo, Riboux and Quintero2019).
Figure 7(a) shows that the proposed model of Gordillo et al. (Reference Gordillo, Riboux and Quintero2019) significantly overestimates the spread radius
 $R^*(\tau )$
, and this overestimation increases with increasing liquid viscosity (i.e. glycerol fraction
$R^*(\tau )$
, and this overestimation increases with increasing liquid viscosity (i.e. glycerol fraction
 $\phi _g$
). Similar overestimations of theoretical
$\phi _g$
). Similar overestimations of theoretical
 $R^*(\tau )$
from the experimental data are also found for these viscosities for impact
$R^*(\tau )$
from the experimental data are also found for these viscosities for impact
 $ \textit{We} = 130$
and
$ \textit{We} = 130$
and
 $ \textit{We} = 104$
. Such overestimations indicate that the theoretical model of Gordillo et al. (Reference Gordillo, Riboux and Quintero2019), with its proposed constants for high viscosities (i.e.
$ \textit{We} = 104$
. Such overestimations indicate that the theoretical model of Gordillo et al. (Reference Gordillo, Riboux and Quintero2019), with its proposed constants for high viscosities (i.e.
 $\chi \lt 0.6$
,
$\chi \lt 0.6$
,
 $\lambda = 1$
), cannot reliably capture droplet impacts involving larger Ohnesorge numbers (i.e. higher viscosities). In contrast, the constants originally suggested by Gordillo et al. (Reference Gordillo, Riboux and Quintero2019) for the range
$\lambda = 1$
), cannot reliably capture droplet impacts involving larger Ohnesorge numbers (i.e. higher viscosities). In contrast, the constants originally suggested by Gordillo et al. (Reference Gordillo, Riboux and Quintero2019) for the range
 $10^{-3} \lesssim Oh \lesssim 10^{-2}$
, i.e.
$10^{-3} \lesssim Oh \lesssim 10^{-2}$
, i.e.
 $\chi = 0.6$
and
$\chi = 0.6$
and
 $\lambda = 1$
, work well up to
$\lambda = 1$
, work well up to
 $\phi _g = 60$
% (
$\phi _g = 60$
% (
 $ \textit{Oh}=0.031$
) for the impacts with all considered Weber numbers (
$ \textit{Oh}=0.031$
) for the impacts with all considered Weber numbers (
 $ \textit{We} = 81, 104$
and
$ \textit{We} = 81, 104$
and
 $130$
), as presented later in figure 8. Therefore, before presenting the results for all viscosity cases, an evaluation is conducted to identify more appropriate values of
$130$
), as presented later in figure 8. Therefore, before presenting the results for all viscosity cases, an evaluation is conducted to identify more appropriate values of
 $\lambda$
and
$\lambda$
and
 $\chi$
that could align the theoretical
$\chi$
that could align the theoretical
 $R^*(\tau )$
by Gordillo et al. (Reference Gordillo, Riboux and Quintero2019) with the corresponding experimental data for the high-viscosity impact cases with
$R^*(\tau )$
by Gordillo et al. (Reference Gordillo, Riboux and Quintero2019) with the corresponding experimental data for the high-viscosity impact cases with
 $\phi _g = 70$
% (
$\phi _g = 70$
% (
 $ \textit{Oh} = 0.067$
) and
$ \textit{Oh} = 0.067$
) and
 $\phi _g = 80$
% (
$\phi _g = 80$
% (
 $ \textit{Oh} = 0.177$
).
$ \textit{Oh} = 0.177$
).

Figure 7. (a) Comparison of the experimental dimensionless spread radius (
 $R^*(\tau ) = R(\tau )/D_0$
) with the
$R^*(\tau ) = R(\tau )/D_0$
) with the
 $R^*(\tau )$
obtained by the model of Gordillo et al. (Reference Gordillo, Riboux and Quintero2019) for the glycerol volume fractions
$R^*(\tau )$
obtained by the model of Gordillo et al. (Reference Gordillo, Riboux and Quintero2019) for the glycerol volume fractions
 $\phi _g = 70$
% (
$\phi _g = 70$
% (
 $ \textit{Oh} = 0.067$
) and
$ \textit{Oh} = 0.067$
) and
 $\phi _g = 80$
% (
$\phi _g = 80$
% (
 $ \textit{Oh} = 0.177$
). The spread radius
$ \textit{Oh} = 0.177$
). The spread radius
 $R(\tau )$
is schematically defined in the inset image. The colour of a theoretical line is the same as the edge colour of the corresponding experimental symbols. (b–c) The dependency of the theoretical
$R(\tau )$
is schematically defined in the inset image. The colour of a theoretical line is the same as the edge colour of the corresponding experimental symbols. (b–c) The dependency of the theoretical
 $R^*(\tau )$
on (b)
$R^*(\tau )$
on (b)
 $\chi$
for a given
$\chi$
for a given
 $\lambda (=0.5)$
and (c)
$\lambda (=0.5)$
and (c)
 $\lambda$
for a given
$\lambda$
for a given
 $\chi (=0.30)$
, for droplet impacts with
$\chi (=0.30)$
, for droplet impacts with
 $ \textit{We} = 81$
and
$ \textit{We} = 81$
and
 $\phi _g = 80$
%.
$\phi _g = 80$
%.
Figure 7(b–c) shows a typical optimisation of
 $ \chi$
and
$ \chi$
and
 $ \lambda$
values to minimise the deviation of theoretical
$ \lambda$
values to minimise the deviation of theoretical
 $ R^*(\tau )$
from measurements for
$ R^*(\tau )$
from measurements for
 $\phi _g=80$
%. First, values of
$\phi _g=80$
%. First, values of
 $ \chi$
that can allow a solution of the theory of Gordillo et al. (Reference Gordillo, Riboux and Quintero2019) are identified as
$ \chi$
that can allow a solution of the theory of Gordillo et al. (Reference Gordillo, Riboux and Quintero2019) are identified as
 $ \chi \lt 0.6$
; e.g.
$ \chi \lt 0.6$
; e.g.
 $ \chi = 0.3$
for this impact case. Figure 7(b) shows that
$ \chi = 0.3$
for this impact case. Figure 7(b) shows that
 $ \chi \gt 0.30$
cannot solve the theory, i.e. no curve could be obtained for
$ \chi \gt 0.30$
cannot solve the theory, i.e. no curve could be obtained for
 $ \chi \gt 0.30$
, and
$ \chi \gt 0.30$
, and
 $ \chi \lt 0.30$
worsens the theoretical prediction for a given value of
$ \chi \lt 0.30$
worsens the theoretical prediction for a given value of
 $ \lambda$
(e.g.
$ \lambda$
(e.g.
 $ \lambda = 0.5$
in figure 7
b). Figure 7(c) shows the dependency of the theoretical
$ \lambda = 0.5$
in figure 7
b). Figure 7(c) shows the dependency of the theoretical
 $ R^*(\tau )$
on
$ R^*(\tau )$
on
 $ \lambda$
when
$ \lambda$
when
 $ \chi$
is fixed;
$ \chi$
is fixed;
 $ \lambda$
values less than 0.5 cannot solve the theory up to
$ \lambda$
values less than 0.5 cannot solve the theory up to
 $ \tau _{\textit{max}}$
(corresponding to
$ \tau _{\textit{max}}$
(corresponding to
 $ R_{\textit{max}}$
) and
$ R_{\textit{max}}$
) and
 $ \lambda$
values greater than 0.5 result in larger deviations from the experimental data for
$ \lambda$
values greater than 0.5 result in larger deviations from the experimental data for
 $ \chi = 0.30$
. Thus, the optimised values for this case are
$ \chi = 0.30$
. Thus, the optimised values for this case are
 $ \chi = 0.30$
and
$ \chi = 0.30$
and
 $ \lambda = 0.5$
, which minimise the deviation of the theoretical curve from the experimental data. However, differences between theory and experiments still remain. A similar approach is also applied to optimise these theoretical constants for the other high-viscosity cases. Table 2 lists the optimised
$ \lambda = 0.5$
, which minimise the deviation of the theoretical curve from the experimental data. However, differences between theory and experiments still remain. A similar approach is also applied to optimise these theoretical constants for the other high-viscosity cases. Table 2 lists the optimised
 $ \lambda$
and
$ \lambda$
and
 $ \chi$
values used to obtain the theoretical
$ \chi$
values used to obtain the theoretical
 $ R^*(\tau )$
for different viscosity cases, as presented in comparison with experimental data in figure 8(a–c). It is noted that our previous work experimentally demonstrated that the spreading of individual lamellae remains unaffected by the interaction of lamellae at the central contact region, as evidenced by the comparison of
$ R^*(\tau )$
for different viscosity cases, as presented in comparison with experimental data in figure 8(a–c). It is noted that our previous work experimentally demonstrated that the spreading of individual lamellae remains unaffected by the interaction of lamellae at the central contact region, as evidenced by the comparison of
 $R^{*}(\tau )$
for single-droplet and droplet-pair impacts for water droplets (Goswami & Hardalupas Reference Goswami and Hardalupas2023). A similar spreading behaviour is also observed for high-viscosity droplets, as shown in Appendix C, confirming that the discrepancy with theory in these cases arises solely due to increased viscosity, rather than enhanced inter-droplet interactions at higher viscosities.
$R^{*}(\tau )$
for single-droplet and droplet-pair impacts for water droplets (Goswami & Hardalupas Reference Goswami and Hardalupas2023). A similar spreading behaviour is also observed for high-viscosity droplets, as shown in Appendix C, confirming that the discrepancy with theory in these cases arises solely due to increased viscosity, rather than enhanced inter-droplet interactions at higher viscosities.
Table 2. Constants
 $\chi$
and
$\chi$
and
 $\lambda$
used to minimise deviations of
$\lambda$
used to minimise deviations of
 $R^*(\tau )$
estimated from the theory of Gordillo et al. (Reference Gordillo, Riboux and Quintero2019) for different droplet impacts with different Weber numbers
$R^*(\tau )$
estimated from the theory of Gordillo et al. (Reference Gordillo, Riboux and Quintero2019) for different droplet impacts with different Weber numbers
 $(W e)$
for different viscosities (i.e. glycerol volume fractions
$(W e)$
for different viscosities (i.e. glycerol volume fractions
 $\phi _g$
corresponding to
$\phi _g$
corresponding to
 $ \textit{Oh}=0.002$
to 0.177) in comparison with current measurements.
$ \textit{Oh}=0.002$
to 0.177) in comparison with current measurements.


Figure 8. (a–c) Effect of liquid viscosity (i.e. liquid glycerol volume fraction
 $\phi _g=0$
% to
$\phi _g=0$
% to
 $80$
% corresponding to
$80$
% corresponding to
 $ \textit{Oh}=0.002$
to
$ \textit{Oh}=0.002$
to
 $0.177$
) on the time-dependent dimensionless spread radius
$0.177$
) on the time-dependent dimensionless spread radius
 $R^*(\tau )$
for different impact Weber numbers (
$R^*(\tau )$
for different impact Weber numbers (
 $ \textit{We}=130,104$
and
$ \textit{We}=130,104$
and
 $81$
). For all cases, the dimensionless inter-droplet spacing
$81$
). For all cases, the dimensionless inter-droplet spacing
 $\Delta x^*$
is kept constant at
$\Delta x^*$
is kept constant at
 $\Delta x^* \approx 1.80$
. The scatter plots represent experimental
$\Delta x^* \approx 1.80$
. The scatter plots represent experimental
 $R^*(\tau )$
and the solid lines represent the
$R^*(\tau )$
and the solid lines represent the
 $R^*(\tau )$
estimated from the theory of Gordillo et al. (Reference Gordillo, Riboux and Quintero2019), with optimised constants
$R^*(\tau )$
estimated from the theory of Gordillo et al. (Reference Gordillo, Riboux and Quintero2019), with optimised constants
 $\chi$
and
$\chi$
and
 $\lambda$
for
$\lambda$
for
 $\phi _g=70$
% (
$\phi _g=70$
% (
 $ \textit{Oh}=0.067$
)and
$ \textit{Oh}=0.067$
)and
 $80$
% (
$80$
% (
 $ \textit{Oh}=0.127$
). The values of constants
$ \textit{Oh}=0.127$
). The values of constants
 $\chi$
and
$\chi$
and
 $\lambda$
used for different viscosities are listed in table 2. The colour of a theoretical line is the same as the edge colour of the corresponding experimental symbols. Error bars represent standard deviations from mean data and are only visible where error bars are larger than the symbol size. (d) Comparison of the experimental maximum spread radius
$\lambda$
used for different viscosities are listed in table 2. The colour of a theoretical line is the same as the edge colour of the corresponding experimental symbols. Error bars represent standard deviations from mean data and are only visible where error bars are larger than the symbol size. (d) Comparison of the experimental maximum spread radius
 $R_{{max}}^* (=R_{{max}}/D_0)$
with
$R_{{max}}^* (=R_{{max}}/D_0)$
with
 $R_{{max}}^*$
obtained from (1) the theoretical model by Gordillo et al. (Reference Gordillo, Riboux and Quintero2019) with constants listed in table 2 and (2) the scaling model by Laan et al. (Reference Laan, de Bruin, Bartolo, Josserand and Bonn2014). Different symbol colours represent liquids with different glycerol volume fractions:
$R_{{max}}^*$
obtained from (1) the theoretical model by Gordillo et al. (Reference Gordillo, Riboux and Quintero2019) with constants listed in table 2 and (2) the scaling model by Laan et al. (Reference Laan, de Bruin, Bartolo, Josserand and Bonn2014). Different symbol colours represent liquids with different glycerol volume fractions:
 $\phi _g=0$
% (
$\phi _g=0$
% (
 $ \textit{Oh}=0.002$
, cyan),
$ \textit{Oh}=0.002$
, cyan),
 $40$
% (
$40$
% (
 $ \textit{Oh}=0.010$
, grey),
$ \textit{Oh}=0.010$
, grey),
 $60$
% (
$60$
% (
 $ \textit{Oh}=0.031$
, black),
$ \textit{Oh}=0.031$
, black),
 $70$
% (
$70$
% (
 $ \textit{Oh}=0.067$
, red) and
$ \textit{Oh}=0.067$
, red) and
 $80$
% (
$80$
% (
 $ \textit{Oh}=0.177$
, blue).
$ \textit{Oh}=0.177$
, blue).
Figure 8(a–c) compares the experimental
 $ R^* (\tau )$
with its theoretical prediction by Gordillo et al. (Reference Gordillo, Riboux and Quintero2019) for the droplet-pair impacts across all liquid viscosities (i.e.
$ R^* (\tau )$
with its theoretical prediction by Gordillo et al. (Reference Gordillo, Riboux and Quintero2019) for the droplet-pair impacts across all liquid viscosities (i.e.
 $\phi _g=0$
% to
$\phi _g=0$
% to
 $\phi _g=80$
%) for impact Weber numbers
$\phi _g=80$
%) for impact Weber numbers
 $ \textit{We}=130,104$
and
$ \textit{We}=130,104$
and
 $ 81$
. For the low-viscosity droplet-impact cases, the agreement between the experimental data and theoretical prediction is excellent for all impact Weber numbers. However, for high-viscosity droplet impacts (i.e.
$ 81$
. For the low-viscosity droplet-impact cases, the agreement between the experimental data and theoretical prediction is excellent for all impact Weber numbers. However, for high-viscosity droplet impacts (i.e.
 $\phi _g=70$
% (
$\phi _g=70$
% (
 $ Oh=0.067$
) and
$ Oh=0.067$
) and
 $\phi _g=80$
% (
$\phi _g=80$
% (
 $ Oh=0.177$
)), the deviations between theoretical predictions and experimental data remain significant even with the optimised
$ Oh=0.177$
)), the deviations between theoretical predictions and experimental data remain significant even with the optimised
 $ \chi$
and
$ \chi$
and
 $ \lambda$
values (see table 2), as revealed in figure 8(a–c). Also, it is noteworthy that the set of optimised constant values for these two high-viscosity cases differ appreciably for a given impact Weber number (table 2). Thus, no single pair of
$ \lambda$
values (see table 2), as revealed in figure 8(a–c). Also, it is noteworthy that the set of optimised constant values for these two high-viscosity cases differ appreciably for a given impact Weber number (table 2). Thus, no single pair of
 $ \chi$
and
$ \chi$
and
 $ \lambda$
values could be identified to reliably fit experimental data for these high-viscosity cases. In summary, although the theory of Gordillo et al. (Reference Gordillo, Riboux and Quintero2019) reliably predicts the time-dependent spread radius
$ \lambda$
values could be identified to reliably fit experimental data for these high-viscosity cases. In summary, although the theory of Gordillo et al. (Reference Gordillo, Riboux and Quintero2019) reliably predicts the time-dependent spread radius
 $ R^* (\tau )$
for droplets with lower viscosities, it cannot reliably predict
$ R^* (\tau )$
for droplets with lower viscosities, it cannot reliably predict
 $ R^* (\tau )$
for droplets with higher viscosities, even when employing optimised
$ R^* (\tau )$
for droplets with higher viscosities, even when employing optimised
 $ \chi$
and
$ \chi$
and
 $ \lambda$
values, as revealed in figure 8(a–c).
$ \lambda$
values, as revealed in figure 8(a–c).
Figure 8 (a–c) also presents the liquid viscosity (Ohnesorge number) effect on the temporal evolution of the dimensionless spread radius
 $ R^*$
. For all impact
$ R^*$
. For all impact
 $ \textit{We}$
cases, it is evident that the liquid viscosity does not appreciably influence the initial droplet spreading stage (figure 8
a–c), primarily attributed to the dominance of inertial forces during this phase. However, beyond this initial spreading stage, viscous dissipation, which increases with increasing liquid viscosity, significantly influences the spreading behaviour, leading to an appreciable decrease in the maximum spread of the lamellae (i.e.
$ \textit{We}$
cases, it is evident that the liquid viscosity does not appreciably influence the initial droplet spreading stage (figure 8
a–c), primarily attributed to the dominance of inertial forces during this phase. However, beyond this initial spreading stage, viscous dissipation, which increases with increasing liquid viscosity, significantly influences the spreading behaviour, leading to an appreciable decrease in the maximum spread of the lamellae (i.e.
 $ R_{\textit{max}}$
). For instance, for the same impact Weber number
$ R_{\textit{max}}$
). For instance, for the same impact Weber number
 $ \textit{We}=130$
, while
$ \textit{We}=130$
, while
 $ R_{\textit{max}}$
is
$ R_{\textit{max}}$
is
 $ \approx 1.9D_0$
for
$ \approx 1.9D_0$
for
 $ \phi _g=0$
% (minimum
$ \phi _g=0$
% (minimum
 $ {Oh}$
),
$ {Oh}$
),
 $ R_{\textit{max}}$
is
$ R_{\textit{max}}$
is
 $ \approx D_0$
for
$ \approx D_0$
for
 $ \phi _g=80$
% (maximum
$ \phi _g=80$
% (maximum
 $ {Oh}$
). Similar reduction in
$ {Oh}$
). Similar reduction in
 $ R_{\textit{max}}$
with increasing liquid viscosity (
$ R_{\textit{max}}$
with increasing liquid viscosity (
 $ {Oh}$
) is observed for the other examined impact Weber number cases, as revealed in figure 8(a–c). Additionally, it is worth noting that, for a given liquid viscosity (
$ {Oh}$
) is observed for the other examined impact Weber number cases, as revealed in figure 8(a–c). Additionally, it is worth noting that, for a given liquid viscosity (
 $ {Oh}$
), the dimensionless maximum spread radius
$ {Oh}$
), the dimensionless maximum spread radius
 $ R_{\textit{max}}^*$
(
$ R_{\textit{max}}^*$
(
 $ =R_{\textit{max}}/D_0$
) exhibits strong dependency on the impact Weber number;
$ =R_{\textit{max}}/D_0$
) exhibits strong dependency on the impact Weber number;
 $ R_{\textit{max}}^*$
decreases appreciably with decreasing impact Weber number due to reduced impact inertia.
$ R_{\textit{max}}^*$
decreases appreciably with decreasing impact Weber number due to reduced impact inertia.
During droplet impacts, higher droplet liquid viscosity increases viscous dissipation in different regions of a spreading droplet (Wildeman et al. Reference Wildeman, Visser, Sun and Lohse2016): (i) within the viscous boundary layer near the impact substrate, (ii) in the flow from the descending bulk liquid into the radially expanding lamella and (iii) in the liquid flow from the lamella into the outer rim. Part of the initial kinetic energy of an impacting droplet contributes to the surface energy gain of the spreading droplet and the rest to the viscous dissipation. Recently, Sanjay & Lohse (Reference Sanjay and Lohse2025) demonstrated that the total viscous dissipation during droplet impact can be split into two temporal phases, reflecting the distinct underlying fluid dynamics: (i) dissipation during the initial impacting phase,
 $0 \le t \le t_i$
, with
$0 \le t \le t_i$
, with
 $t_i \sim D_0/V_0$
as the inertial time scale, and (ii) dissipation during the droplet spreading phase,
$t_i \sim D_0/V_0$
as the inertial time scale, and (ii) dissipation during the droplet spreading phase,
 $t_i \le t \le t_{\textit{max}}$
, where
$t_i \le t \le t_{\textit{max}}$
, where
 $t_{\textit{max}}$
corresponds to the maximum spread radius
$t_{\textit{max}}$
corresponds to the maximum spread radius
 $R_{\textit{max}}$
. Accordingly, the total energy dissipated per unit mass up to any instant
$R_{\textit{max}}$
. Accordingly, the total energy dissipated per unit mass up to any instant
 $t \gt t_i$
can be expressed as (Sanjay & Lohse Reference Sanjay and Lohse2025)
$t \gt t_i$
can be expressed as (Sanjay & Lohse Reference Sanjay and Lohse2025)
 \begin{align} E_d(t) = \int _{0}^{t} \epsilon (t)\, {\rm d}t = \int _{0}^{t_i} \epsilon _i(t)\, {\rm d}t + \int _{t_i}^{t} \epsilon _s(t)\, {\rm d}t , \end{align}
where
 $\epsilon (t)$
is the viscous dissipation rate, with subscripts
$\epsilon (t)$
is the viscous dissipation rate, with subscripts
 $i$
and
$i$
and
 $s$
denoting the impacting and spreading phases, respectively. These dissipation rates, integrated across the growing boundary layer thickness
$s$
denoting the impacting and spreading phases, respectively. These dissipation rates, integrated across the growing boundary layer thickness
 $\delta (t) \sim \sqrt {\mu t/\rho }$
(Josserand et al. Reference Josserand, Lemoyne, Troeger and Zaleski2005; Roisman et al. Reference Roisman, Horvat and Tropea2006; Xu et al. Reference Xu, Barcos and Nagel2007; Bird et al. Reference Bird, Tsai and Stone2009) within the liquid volume
$\delta (t) \sim \sqrt {\mu t/\rho }$
(Josserand et al. Reference Josserand, Lemoyne, Troeger and Zaleski2005; Roisman et al. Reference Roisman, Horvat and Tropea2006; Xu et al. Reference Xu, Barcos and Nagel2007; Bird et al. Reference Bird, Tsai and Stone2009) within the liquid volume
 $\varOmega (t) \sim R(t)^2 \delta (t)$
, scale with liquid viscosity
$\varOmega (t) \sim R(t)^2 \delta (t)$
, scale with liquid viscosity
 $\mu$
as (Sanjay & Lohse Reference Sanjay and Lohse2025)
$\mu$
as (Sanjay & Lohse Reference Sanjay and Lohse2025)
 \begin{align} \epsilon _i(t) \sim \frac {\mu }{\rho D_0^3}\, \frac {V_0^2}{\delta _i(t)^2}\, \varOmega _i(t) \sim \frac {V_0^3}{D_0^2}\, \sqrt {\frac {\mu t}{\rho }}, \\[-28pt] \nonumber \end{align}
 \begin{align} \epsilon _s(t) \sim \frac {\mu }{\rho D_0^3}\, \frac {V_L(t)^2}{\delta _s(t)^2}\, \varOmega _s(t) \sim \frac {V_L(t)^2 R(t)^2}{D_0^3}\, \sqrt {\frac {\mu }{\rho }}\, t^{-1/2}, \\[0pt] \nonumber \end{align}
with
 $V_L(t) = {\rm d}R(t)/{\rm d}t$
as the lamella-front velocity during spreading.
$V_L(t) = {\rm d}R(t)/{\rm d}t$
as the lamella-front velocity during spreading.
For the droplet impacts shown in figure 8, it is evident from figure 8(a–c) that, for a given impact
 $ \textit{We}$
, the spread radius
$ \textit{We}$
, the spread radius
 $R(t)$
(or
$R(t)$
(or
 $R^{*}(\tau )$
in dimensionless form) for all viscosities is nearly comparable during the early spreading stage (
$R^{*}(\tau )$
in dimensionless form) for all viscosities is nearly comparable during the early spreading stage (
 $\tau \lesssim 0.2$
), indicating nearly comparable lamella-front velocities as well. However, the viscosity
$\tau \lesssim 0.2$
), indicating nearly comparable lamella-front velocities as well. However, the viscosity
 $\mu$
varies by over
$\mu$
varies by over
 $90$
times, from
$90$
times, from
 $\mu = 1$
mPa s for water droplets (
$\mu = 1$
mPa s for water droplets (
 $\phi _g = 0$
%) to
$\phi _g = 0$
%) to
 $\mu = 91.46$
mPa s for glycerol–water droplets with
$\mu = 91.46$
mPa s for glycerol–water droplets with
 $\phi _g = 80$
%, while the liquid density
$\phi _g = 80$
%, while the liquid density
 $\rho$
remains nearly unchanged (detailed in table 1). From (3.5)–(3.6), the droplets with higher viscosities therefore dissipate more energy during this spreading stage, leaving less kinetic energy available for subsequent spreading on the impact substrate, and thus achieve lower
$\rho$
remains nearly unchanged (detailed in table 1). From (3.5)–(3.6), the droplets with higher viscosities therefore dissipate more energy during this spreading stage, leaving less kinetic energy available for subsequent spreading on the impact substrate, and thus achieve lower
 $R_{\textit{max}}^{*}$
, as revealed in figure 8(a–c). Consequently, for a given dimensionless inter-droplet spacing
$R_{\textit{max}}^{*}$
, as revealed in figure 8(a–c). Consequently, for a given dimensionless inter-droplet spacing
 $\Delta x^{*}$
, the maximum combined liquid spread – defined as
$\Delta x^{*}$
, the maximum combined liquid spread – defined as
 $2 R_{\textit{max}}^{*} + \Delta x^{*}$
(Goswami & Hardalupas Reference Goswami and Hardalupas2023) – also decreases with increasing liquid viscosity during droplet-pair impacts on solid surfaces.
$2 R_{\textit{max}}^{*} + \Delta x^{*}$
(Goswami & Hardalupas Reference Goswami and Hardalupas2023) – also decreases with increasing liquid viscosity during droplet-pair impacts on solid surfaces.
In the literature, depending on the relative dominance of capillary and viscous forces on the spreading of impacting droplets, two spreading asymptotic regimes are reported (Clanet et al. Reference Clanet, Béguin, Richard and Quéré2004; Laan et al. Reference Laan, de Bruin, Bartolo, Josserand and Bonn2014; Josserand & Thoroddsen Reference Josserand and Thoroddsen2016): (i) the capillary regime, where spreading is limited by capillary forces and governed by an inertia–capillary balance, and (ii) the viscous regime, where spreading is limited by viscous forces and governed by an inertia–viscous balance. For the capillary regime (or inviscid regime), the dimensionless maximum spread radius
 $R_{\textit{max}}^*$
scales with the Weber number as
$R_{\textit{max}}^*$
scales with the Weber number as
 $R_{\textit{max}}^* \sim \textit{We}^{1/2}$
(Bennett & Poulikakos Reference Bennett and Poulikakos1993; Eggers et al. Reference Eggers, Fontelos, Josserand and Zaleski2010), whereas for the viscous regime,
$R_{\textit{max}}^* \sim \textit{We}^{1/2}$
(Bennett & Poulikakos Reference Bennett and Poulikakos1993; Eggers et al. Reference Eggers, Fontelos, Josserand and Zaleski2010), whereas for the viscous regime,
 $R_{\textit{max}}^*$
scales with the Reynolds number as
$R_{\textit{max}}^*$
scales with the Reynolds number as
 $R_{\textit{max}}^* \sim Re^{1/5}$
(Clanet et al. Reference Clanet, Béguin, Richard and Quéré2004; Du et al. Reference Du, Chamakos, Papathanasiou and Min2021). By interpolating between these asymptotic scaling laws (i.e.
$R_{\textit{max}}^* \sim Re^{1/5}$
(Clanet et al. Reference Clanet, Béguin, Richard and Quéré2004; Du et al. Reference Du, Chamakos, Papathanasiou and Min2021). By interpolating between these asymptotic scaling laws (i.e.
 ${\sim} \textit{We}^{1/2}$
and
${\sim} \textit{We}^{1/2}$
and
 ${\sim} Re^{1/5}$
), Laan et al. (Reference Laan, de Bruin, Bartolo, Josserand and Bonn2014) introduced a cross-over and universal scaling for
${\sim} Re^{1/5}$
), Laan et al. (Reference Laan, de Bruin, Bartolo, Josserand and Bonn2014) introduced a cross-over and universal scaling for
 $R_{\textit{max}}^*$
as
$R_{\textit{max}}^*$
as
 \begin{align} R_{\textit{max}}^* \sim \textit{Re}^{\tfrac {1}{5}} f(P)=\frac {1}{2} \frac {\sqrt {P}}{\sqrt {P}+A} \textit{Re}^{1 / 5} , \end{align}
where
 $P (\equiv \textit{WeRe}^{-2/5})$
is a dimensionless impact parameter that varies between zero (capillary regime) and infinity (viscous regime), and
$P (\equiv \textit{WeRe}^{-2/5})$
is a dimensionless impact parameter that varies between zero (capillary regime) and infinity (viscous regime), and
 $A (= 1.24)$
is a fitting constant. Figure 8(d) compares the experimental
$A (= 1.24)$
is a fitting constant. Figure 8(d) compares the experimental
 $R_{{max}}^*$
with the predictions by (3.7) (i.e. Laan et al. Reference Laan, de Bruin, Bartolo, Josserand and Bonn2014) and the model of Gordillo et al. (Reference Gordillo, Riboux and Quintero2019), with optimised
$R_{{max}}^*$
with the predictions by (3.7) (i.e. Laan et al. Reference Laan, de Bruin, Bartolo, Josserand and Bonn2014) and the model of Gordillo et al. (Reference Gordillo, Riboux and Quintero2019), with optimised
 $\chi$
and
$\chi$
and
 $\lambda$
values applied for high-viscosity cases (from table 2). For low-viscosity cases, the prediction by Gordillo et al. (Reference Gordillo, Riboux and Quintero2019) is closer to the experimental cases compared with that by Laan et al. (Reference Laan, de Bruin, Bartolo, Josserand and Bonn2014). However, for high-viscosity cases, the scaling law of Laan et al. (Reference Laan, de Bruin, Bartolo, Josserand and Bonn2014) predicts
$\lambda$
values applied for high-viscosity cases (from table 2). For low-viscosity cases, the prediction by Gordillo et al. (Reference Gordillo, Riboux and Quintero2019) is closer to the experimental cases compared with that by Laan et al. (Reference Laan, de Bruin, Bartolo, Josserand and Bonn2014). However, for high-viscosity cases, the scaling law of Laan et al. (Reference Laan, de Bruin, Bartolo, Josserand and Bonn2014) predicts
 $R_{\textit{max}}^*$
more reasonably compared with the already optimised model of Gordillo et al. (Reference Gordillo, Riboux and Quintero2019).
$R_{\textit{max}}^*$
more reasonably compared with the already optimised model of Gordillo et al. (Reference Gordillo, Riboux and Quintero2019).

Figure 9. Effect of liquid viscosity (i.e. glycerol volume fraction
 $ \phi _g$
;
$ \phi _g$
;
 $ \textit{Oh}=0.002\text{ to }0.177$
) on the temporal evolution of dimensionless central sheet height
$ \textit{Oh}=0.002\text{ to }0.177$
) on the temporal evolution of dimensionless central sheet height
 $ H_S^*$
(
$ H_S^*$
(
 $ = {H_S}/{D_0}$
) for different impact Weber numbers (
$ = {H_S}/{D_0}$
) for different impact Weber numbers (
 $ \textit{We} = 130,104$
and
$ \textit{We} = 130,104$
and
 $ 81$
). No plot is presented for
$ 81$
). No plot is presented for
 $ \textit{We} = 81$
and
$ \textit{We} = 81$
and
 $\phi _g=80$
% (
$\phi _g=80$
% (
 $ \textit{Oh}=0.177$
) as no sheet is formed for this condition. The inter-droplet spacing is constant at
$ \textit{Oh}=0.177$
) as no sheet is formed for this condition. The inter-droplet spacing is constant at
 $ \Delta x^* \approx 1.80$
. Error bars represent standard deviations from mean data and are only visible where error bars are larger than the symbol size.
$ \Delta x^* \approx 1.80$
. Error bars represent standard deviations from mean data and are only visible where error bars are larger than the symbol size.
3.3. Central sheet dynamics
Figure 9 shows the temporal variation of the dimensionless central sheet height
 $H_S^* (= H_S / D_0; H_S$
is schematically shown in the inset image) for the droplet-pair impacts with different viscosities (
$H_S^* (= H_S / D_0; H_S$
is schematically shown in the inset image) for the droplet-pair impacts with different viscosities (
 $\phi _g = 0$
% to
$\phi _g = 0$
% to
 $80$
% corresponding to
$80$
% corresponding to
 $ \textit{Oh}=0.002$
to 0.177) for impact Weber numbers
$ \textit{Oh}=0.002$
to 0.177) for impact Weber numbers
 $ \textit{We} = 130, 104$
and
$ \textit{We} = 130, 104$
and
 $81$
and a fixed dimensionless inter-droplet spacing
$81$
and a fixed dimensionless inter-droplet spacing
 $\Delta x^* \approx 1.80$
(see figures 3–5 for related morphology). Note that the variation of
$\Delta x^* \approx 1.80$
(see figures 3–5 for related morphology). Note that the variation of
 $H_S^*$
for
$H_S^*$
for
 $\phi _g = 80$
% (
$\phi _g = 80$
% (
 $ \textit{Oh}=0.177$
) is not shown for
$ \textit{Oh}=0.177$
) is not shown for
 $ \textit{We} = 81$
, as no central sheet is formed for this impact case. For all the cases,
$ \textit{We} = 81$
, as no central sheet is formed for this impact case. For all the cases,
 $H_S^*$
is a strong function of the liquid viscosity, i.e. the maximum
$H_S^*$
is a strong function of the liquid viscosity, i.e. the maximum
 $H_S^*$
, denoted as
$H_S^*$
, denoted as
 $H_{S,max }^*$
, decreases appreciably with increasing
$H_{S,max }^*$
, decreases appreciably with increasing
 $\phi _g$
(viscosity or
$\phi _g$
(viscosity or
 $ \textit{Oh}$
) for a given impact
$ \textit{Oh}$
) for a given impact
 $ \textit{We}$
and
$ \textit{We}$
and
 $\Delta x^*$
. Also, for a given
$\Delta x^*$
. Also, for a given
 $\phi _g$
(viscosity or
$\phi _g$
(viscosity or
 $ \textit{Oh}$
),
$ \textit{Oh}$
),
 $H_S^*$
decreases appreciably with decreasing impact
$H_S^*$
decreases appreciably with decreasing impact
 $ \textit{We}$
as less kinetic energy is available for central sheet formation for a lower droplet impact
$ \textit{We}$
as less kinetic energy is available for central sheet formation for a lower droplet impact
 $ \textit{We}$
.
$ \textit{We}$
.
The formation and growth of the central sheet depend on the lamella–lamella impact Weber number
 $ \textit{We}_{L,\textit{imp}}$
(Goswami & Hardalupas Reference Goswami and Hardalupas2023, Reference Goswami and Hardalupas2024), which is the ratio of the lamella–lamella impact inertia and surface tension per unit arclength of the lamellae, i.e.
$ \textit{We}_{L,\textit{imp}}$
(Goswami & Hardalupas Reference Goswami and Hardalupas2023, Reference Goswami and Hardalupas2024), which is the ratio of the lamella–lamella impact inertia and surface tension per unit arclength of the lamellae, i.e.
 $ \textit{We}_{L,\textit{imp}} = 2 \rho V_L^2 T_L / \sigma$
, where
$ \textit{We}_{L,\textit{imp}} = 2 \rho V_L^2 T_L / \sigma$
, where
 $V_L (= {\rm d}R/{\rm d}t)$
and
$V_L (= {\rm d}R/{\rm d}t)$
and
 $T_L$
are the average velocity and average thickness of the lamella edges, respectively, at the moment of lamella collision, i.e. at
$T_L$
are the average velocity and average thickness of the lamella edges, respectively, at the moment of lamella collision, i.e. at
 $\tau = \tau _0$
(see figure 10
a for related schematic). As discussed in the previous section (§ 3.2), the droplet kinetic energy dissipates more with increased liquid viscosity due to viscous dissipation within the boundary layer region and in the liquid flow from bulk to lamella and from lamella to rim. This increased viscous dissipation during lamella spreading leads to decreased available kinetic energy (or
$\tau = \tau _0$
(see figure 10
a for related schematic). As discussed in the previous section (§ 3.2), the droplet kinetic energy dissipates more with increased liquid viscosity due to viscous dissipation within the boundary layer region and in the liquid flow from bulk to lamella and from lamella to rim. This increased viscous dissipation during lamella spreading leads to decreased available kinetic energy (or
 $V_L$
), thereby reducing
$V_L$
), thereby reducing
 $ \textit{We}_{L,\textit{imp}}$
at the instant of lamella collision, i.e. before the central sheet formation (
$ \textit{We}_{L,\textit{imp}}$
at the instant of lamella collision, i.e. before the central sheet formation (
 $\tau = \tau _0$
). Moreover, higher liquid viscosity induces increased shear stress in the formed ‘semilunar’ central sheet, resisting its vertical growth in the ambient quiescent air. Therefore, the decrease in the dimensionless maximum sheet height
$\tau = \tau _0$
). Moreover, higher liquid viscosity induces increased shear stress in the formed ‘semilunar’ central sheet, resisting its vertical growth in the ambient quiescent air. Therefore, the decrease in the dimensionless maximum sheet height
 $H_{S,max }^*$
with
$H_{S,max }^*$
with
 $\phi _g$
, observed in figure 9, is a cumulative effect of viscous dissipation both before the sheet formation (i.e. during lamella spreading) and during the subsequent vertical growth of the central sheet.
$\phi _g$
, observed in figure 9, is a cumulative effect of viscous dissipation both before the sheet formation (i.e. during lamella spreading) and during the subsequent vertical growth of the central sheet.

Figure 10. (a) Collision of two lamellae at
 $\tau =\tau _0$
, with definitions of lamella velocity
$\tau =\tau _0$
, with definitions of lamella velocity
 $ V_L$
, lamella edge thickness
$ V_L$
, lamella edge thickness
 $ T_L$
and collision force (inertia)
$ T_L$
and collision force (inertia)
 $ F_C$
per unit lamella arclength. (b) The dimensionless maximum sheet height
$ F_C$
per unit lamella arclength. (b) The dimensionless maximum sheet height
 $ H_{S,\textit{max}}^*$
 $ ( = {H_{S,\textit{max}}^*}/{D_0} )$
vs. lamella impact Weber number (
$ ( = {H_{S,\textit{max}}^*}/{D_0} )$
vs. lamella impact Weber number (
 $ \textit{We}_{L,imp} = {F_C}/{\sigma }$
) for droplet-impact cases with different viscosities (i.e. glycerol volume fraction
$ \textit{We}_{L,imp} = {F_C}/{\sigma }$
) for droplet-impact cases with different viscosities (i.e. glycerol volume fraction
 $ \phi _g$
from
$ \phi _g$
from
 $ 0$
% (
$ 0$
% (
 $ \textit{Oh}=0.002$
) to
$ \textit{Oh}=0.002$
) to
 $ 80$
% (
$ 80$
% (
 $ \textit{Oh}=0.177$
)). The dashed lines represent best-fit curves for individual viscosity cases. For all fitted curves, the R-squared value is greater than 0.95. (
$ \textit{Oh}=0.177$
)). The dashed lines represent best-fit curves for individual viscosity cases. For all fitted curves, the R-squared value is greater than 0.95. (
 $c$
) The best-fit power laws in a log–log plot, where the slopes of individual fit lines correspond to the individual exponents of the power laws. Error bars represent standard deviations from mean data and are only visible where error bars are larger than the symbol size.
$c$
) The best-fit power laws in a log–log plot, where the slopes of individual fit lines correspond to the individual exponents of the power laws. Error bars represent standard deviations from mean data and are only visible where error bars are larger than the symbol size.
As demonstrated in our previous work (Goswami & Hardalupas Reference Goswami and Hardalupas2023, Reference Goswami and Hardalupas2024), the dimensionless maximum sheet height
 $ H_{S,{max}}^*$
scales with the lamella impact number
$ H_{S,{max}}^*$
scales with the lamella impact number
 $ \textit{We}_{L,imp}$
. Therefore, to characterise the effect of viscosity on
$ \textit{We}_{L,imp}$
. Therefore, to characterise the effect of viscosity on
 $ H_{S,{max}}^*$
, it is crucial to maintain a nearly constant
$ H_{S,{max}}^*$
, it is crucial to maintain a nearly constant
 $ \textit{We}_{L,imp}$
for different viscosities. In this way, the effect of the viscous dissipation before the sheet formation (i.e. during lamella spreading) can be eliminated for different viscosity cases. For any given viscosity (i.e.
$ \textit{We}_{L,imp}$
for different viscosities. In this way, the effect of the viscous dissipation before the sheet formation (i.e. during lamella spreading) can be eliminated for different viscosity cases. For any given viscosity (i.e.
 $ \phi _g$
), achieving a desired
$ \phi _g$
), achieving a desired
 $ \textit{We}_{L,imp}$
primarily depends on regulating the lamella impact velocity, i.e.
$ \textit{We}_{L,imp}$
primarily depends on regulating the lamella impact velocity, i.e.
 $ V_L$
at
$ V_L$
at
 $ \tau =\tau _0$
. This can be accomplished by adjusting the droplet-impact Weber number
$ \tau =\tau _0$
. This can be accomplished by adjusting the droplet-impact Weber number
 $ \textit{We}$
(i.e. droplet release height) and/or inter-droplet spacing as required. Therefore, additional experiments were carried out, by changing the droplet release height (i.e.
$ \textit{We}$
(i.e. droplet release height) and/or inter-droplet spacing as required. Therefore, additional experiments were carried out, by changing the droplet release height (i.e.
 $ \textit{We}$
) and/or inter-droplet spacing to achieve central sheet formations with nearly constant
$ \textit{We}$
) and/or inter-droplet spacing to achieve central sheet formations with nearly constant
 $ \textit{We}_{L,imp}$
for different viscosities (i.e.
$ \textit{We}_{L,imp}$
for different viscosities (i.e.
 $\phi _g=0$
% (
$\phi _g=0$
% (
 $ \textit{Oh}=0.002$
) to 80 % (
$ \textit{Oh}=0.002$
) to 80 % (
 $ \textit{Oh}=0.177$
)). This approach ensures that the observed effects on the central sheet expansion are attributed to variations in viscosity while eliminating the effect of viscous dissipation before sheet formation.
$ \textit{Oh}=0.177$
)). This approach ensures that the observed effects on the central sheet expansion are attributed to variations in viscosity while eliminating the effect of viscous dissipation before sheet formation.
Figure 10(b) shows
 $ H_{S,{max}}^*$
as a function of
$ H_{S,{max}}^*$
as a function of
 $ \textit{We}_{L,\textit{imp}}$
plots obtained from a series of simultaneous droplet-impact experiments conducted for different droplet liquid viscosities (
$ \textit{We}_{L,\textit{imp}}$
plots obtained from a series of simultaneous droplet-impact experiments conducted for different droplet liquid viscosities (
 $ \phi _g=0$
% to 80 %). The impact conditions (i.e.
$ \phi _g=0$
% to 80 %). The impact conditions (i.e.
 $ \textit{We}$
and
$ \textit{We}$
and
 $ \Delta x^*$
) with corresponding
$ \Delta x^*$
) with corresponding
 $ \textit{We}_{L,\textit{imp}}$
for individual viscosity cases are listed in table 3. Figure 10(b) reveals that
$ \textit{We}_{L,\textit{imp}}$
for individual viscosity cases are listed in table 3. Figure 10(b) reveals that
 $ H_{S,{max}}^*$
is not a function of
$ H_{S,{max}}^*$
is not a function of
 $ \textit{We}_{L,\textit{imp}}$
only as the plots for individual viscosities do not collapse into a single curve. Instead, these individual plots are distinctly separated within the graph, where individual power laws can be considered to fit different viscosity cases with R-squared values greater than 0.95 (figure 10
b). Figure 10(c) shows these individual power laws in a log–log plot, where the slopes of individual fit lines correspond to the individual exponents of the power laws.
$ \textit{We}_{L,\textit{imp}}$
only as the plots for individual viscosities do not collapse into a single curve. Instead, these individual plots are distinctly separated within the graph, where individual power laws can be considered to fit different viscosity cases with R-squared values greater than 0.95 (figure 10
b). Figure 10(c) shows these individual power laws in a log–log plot, where the slopes of individual fit lines correspond to the individual exponents of the power laws.
Table 3. Impact conditions, i.e. impact Weber numbers (
 $ \textit{We}$
) and inter-droplet spacing (
$ \textit{We}$
) and inter-droplet spacing (
 $ \Delta x^*$
), and corresponding lamella impact Weber number (
$ \Delta x^*$
), and corresponding lamella impact Weber number (
 $ \textit{We}_{L,\textit{imp}}$
) and lamella Ohnesorge number (
$ \textit{We}_{L,\textit{imp}}$
) and lamella Ohnesorge number (
 $ Oh_L$
) for droplet impacts across different viscosities (i.e. glycerol volume fractions (
$ Oh_L$
) for droplet impacts across different viscosities (i.e. glycerol volume fractions (
 $ \phi _g$
) corresponding to
$ \phi _g$
) corresponding to
 $ \textit{Oh}=0.002$
to
$ \textit{Oh}=0.002$
to
 $0.177$
). The impact conditions corresponding to
$0.177$
). The impact conditions corresponding to
 $ \textit{We}_{L,\textit{imp}} = 14.3 \pm 0.6$
and
$ \textit{We}_{L,\textit{imp}} = 14.3 \pm 0.6$
and
 $ \textit{We}_{L,\textit{imp}} = 28.1 \pm 0.7$
are presented in bold font, and these impact processes are analysed in figure 11(a–c).
$ \textit{We}_{L,\textit{imp}} = 28.1 \pm 0.7$
are presented in bold font, and these impact processes are analysed in figure 11(a–c).

The exponent of
 $\textit{We}_{L,\textit{imp}}$
in the individual power laws does not vary appreciably (figure 10
b); the average exponent value is
$\textit{We}_{L,\textit{imp}}$
in the individual power laws does not vary appreciably (figure 10
b); the average exponent value is
 $ 0.48 \pm 0.04$
, which is in good quantitative agreement with the near square-root scaling (i.e.
$ 0.48 \pm 0.04$
, which is in good quantitative agreement with the near square-root scaling (i.e.
 $ H_{S,{max}}^* \propto \textit{We}_{L,\textit{imp}}^{1/2}$
) obtained for specific viscosity cases, such as water droplet impacts, as examined in our previous studies (Goswami & Hardalupas Reference Goswami and Hardalupas2023, Reference Goswami and Hardalupas2024). However, the prefactors in these individual power laws vary up to one order of magnitude as
$ H_{S,{max}}^* \propto \textit{We}_{L,\textit{imp}}^{1/2}$
) obtained for specific viscosity cases, such as water droplet impacts, as examined in our previous studies (Goswami & Hardalupas Reference Goswami and Hardalupas2023, Reference Goswami and Hardalupas2024). However, the prefactors in these individual power laws vary up to one order of magnitude as
 $ \phi _g$
changes from 0 % to 80 %, indicating that introducing an additional dimensionless number incorporating the liquid viscosity can lead to a more general scaling law that might collapse all the data into a single curve. Considering a dimensionless lamella Ohnesorge number (
$ \phi _g$
changes from 0 % to 80 %, indicating that introducing an additional dimensionless number incorporating the liquid viscosity can lead to a more general scaling law that might collapse all the data into a single curve. Considering a dimensionless lamella Ohnesorge number (
 $ {Oh}_L$
) as
$ {Oh}_L$
) as
 $ {Oh}_L = {\mu }/{\sqrt {\rho \sigma T_L}}$
, the dependence of
$ {Oh}_L = {\mu }/{\sqrt {\rho \sigma T_L}}$
, the dependence of
 $ H_{S,{max}}^*$
on liquid viscosity and a more general scaling law for
$ H_{S,{max}}^*$
on liquid viscosity and a more general scaling law for
 $ H_{S,{max}}^*$
is determined as follows.
$ H_{S,{max}}^*$
is determined as follows.

Figure 11. (a–b) Droplet-pair impacts with nearly constant lamella–lamella impact Weber numbers (
 $ \textit{We}_{L,\textit{imp}}$
) for different viscosities (i.e. glycerol volume fraction
$ \textit{We}_{L,\textit{imp}}$
) for different viscosities (i.e. glycerol volume fraction
 $ \phi _g$
from 0 % (
$ \phi _g$
from 0 % (
 $ \textit{Oh}=0.002$
) to 80 % (
$ \textit{Oh}=0.002$
) to 80 % (
 $ \textit{Oh}=0.177$
)). For (a),
$ \textit{Oh}=0.177$
)). For (a),
 $ \textit{We}_{L,\textit{imp}} = 14.3 \pm 0.6$
and for (b),
$ \textit{We}_{L,\textit{imp}} = 14.3 \pm 0.6$
and for (b),
 $ \textit{We}_{L,\textit{imp}} = 28.1 \pm 0.7$
. Here,
$ \textit{We}_{L,\textit{imp}} = 28.1 \pm 0.7$
. Here,
 $ \tau _0$
is the dimensionless time corresponding to the lamella impact and
$ \tau _0$
is the dimensionless time corresponding to the lamella impact and
 $ \tau _{{max}}$
corresponds to the maximum dimensionless sheet height
$ \tau _{{max}}$
corresponds to the maximum dimensionless sheet height
 $ H_{S,{max}}^*$
. Scale bars represent 3 mm. The impact conditions (i.e. impact
$ H_{S,{max}}^*$
. Scale bars represent 3 mm. The impact conditions (i.e. impact
 $ \textit{We}$
and dimensionless inter-droplet spacing
$ \textit{We}$
and dimensionless inter-droplet spacing
 $ \Delta x^*$
) for individual
$ \Delta x^*$
) for individual
 $ \phi _g$
cases are presented in bold font in table 3. Panel (c) shows
$ \phi _g$
cases are presented in bold font in table 3. Panel (c) shows
 $ H_{S,{max}}^*$
vs. the lamella Ohnesorge number
$ H_{S,{max}}^*$
vs. the lamella Ohnesorge number
 $ {Oh}_L = \mu /\sqrt {\rho \sigma T_L}$
for the impact cases shown in (a) and (b). Error bars represent standard deviation from mean data. The dashed lines (coloured with corresponding symbols’ colour) represent the best fits
$ {Oh}_L = \mu /\sqrt {\rho \sigma T_L}$
for the impact cases shown in (a) and (b). Error bars represent standard deviation from mean data. The dashed lines (coloured with corresponding symbols’ colour) represent the best fits
 $ H_{S,{max}}^* \approx 0.32 {Oh}_L^{-0.20}$
and
$ H_{S,{max}}^* \approx 0.32 {Oh}_L^{-0.20}$
and
 $ H_{S,{max}}^* \approx 0.42 {Oh}_L^{-0.21}$
for
$ H_{S,{max}}^* \approx 0.42 {Oh}_L^{-0.21}$
for
 $ \textit{We}_{L,\textit{imp}} \approx 14.3$
and
$ \textit{We}_{L,\textit{imp}} \approx 14.3$
and
 $ \textit{We}_{L,\textit{imp}} \approx 28.1$
, respectively, with R-squared value greater than 0.88. The inset image shows the dependence of
$ \textit{We}_{L,\textit{imp}} \approx 28.1$
, respectively, with R-squared value greater than 0.88. The inset image shows the dependence of
 $ {Oh}_L$
on the droplet liquid viscosity
$ {Oh}_L$
on the droplet liquid viscosity
 $ \mu$
. Panel (d) shows
$ \mu$
. Panel (d) shows
 $ H_{S,{max}}^*$
as a function of
$ H_{S,{max}}^*$
as a function of
 $ {Oh}_L^{-1/5} {We}^{1/2}$
across different liquid viscosities (
$ {Oh}_L^{-1/5} {We}^{1/2}$
across different liquid viscosities (
 $ \phi _g = 0$
% (
$ \phi _g = 0$
% (
 $ \textit{Oh}=0.002$
) to 80 % (
$ \textit{Oh}=0.002$
) to 80 % (
 $ \textit{Oh}=0.177$
)) for the droplet impacts listed in table 3. The dashed line represents the scaling law
$ \textit{Oh}=0.177$
)) for the droplet impacts listed in table 3. The dashed line represents the scaling law
 $ H_{S,{max}}^* \approx 0.088 {Oh}_L^{-1/5} \textit{We}_{L,\textit{imp}}^{1/2}$
.
$ H_{S,{max}}^* \approx 0.088 {Oh}_L^{-1/5} \textit{We}_{L,\textit{imp}}^{1/2}$
.
From the conducted experiments listed in table 3, two nearly constant lamella–lamella impact Weber numbers can be identified across different liquid viscosities (
 $ \phi _g$
from
$ \phi _g$
from
 $ 0$
% to
$ 0$
% to
 $ 80$
%, i.e.
$ 80$
%, i.e.
 $ \textit{Oh}$
from 0.002 to 0.177) as
$ \textit{Oh}$
from 0.002 to 0.177) as
 $\textit{We}_{L,\textit{imp}} = 14.3 \pm 0.6$
and
$\textit{We}_{L,\textit{imp}} = 14.3 \pm 0.6$
and
 $\textit{We}_{L,\textit{imp}} = 28.1 \pm 0.7$
. Figures 11(a) and 11(b) show the morphologies of lamella collision (at
$\textit{We}_{L,\textit{imp}} = 28.1 \pm 0.7$
. Figures 11(a) and 11(b) show the morphologies of lamella collision (at
 $ \tau = \tau _0$
) and the corresponding central sheets possessing their maximum heights (
$ \tau = \tau _0$
) and the corresponding central sheets possessing their maximum heights (
 $ H_{S,{max}}$
at
$ H_{S,{max}}$
at
 $ \tau = \tau _{{max}}$
) for these two lamella impact Weber number cases, i.e.
$ \tau = \tau _{{max}}$
) for these two lamella impact Weber number cases, i.e.
 $\textit{We}_{L,\textit{imp}} \approx 14.3$
and
$\textit{We}_{L,\textit{imp}} \approx 14.3$
and
 $\textit{We}_{L,\textit{imp}} \approx 28.1$
, respectively. The impact conditions (i.e. impact
$\textit{We}_{L,\textit{imp}} \approx 28.1$
, respectively. The impact conditions (i.e. impact
 $ \textit{We}$
and dimensionless inter-droplet spacing
$ \textit{We}$
and dimensionless inter-droplet spacing
 $ \Delta x^*$
) of these specific impact processes are presented in bold font in table 3, for clarity. In effect, figure 11(a–c) shows the sole viscosity effect on
$ \Delta x^*$
) of these specific impact processes are presented in bold font in table 3, for clarity. In effect, figure 11(a–c) shows the sole viscosity effect on
 $ H_{S,{max}}$
as the lamella collision inertia (or
$ H_{S,{max}}$
as the lamella collision inertia (or
 $\textit{We}_{L,\textit{imp}}$
) is nearly constant while varying the liquid viscosity or the lamella Ohnesorge number
$\textit{We}_{L,\textit{imp}}$
) is nearly constant while varying the liquid viscosity or the lamella Ohnesorge number
 $ {Oh}_L$
(listed in table 3). The inset image of figure 11(c) shows that
$ {Oh}_L$
(listed in table 3). The inset image of figure 11(c) shows that
 $ {Oh}_L$
is mainly a function of liquid viscosity
$ {Oh}_L$
is mainly a function of liquid viscosity
 $ \mu$
and an appropriate dimensionless number to represent the viscosity effect. The dimensionless maximum sheet height
$ \mu$
and an appropriate dimensionless number to represent the viscosity effect. The dimensionless maximum sheet height
 $ H_{S,{max}}^*$
decreases with increasing
$ H_{S,{max}}^*$
decreases with increasing
 $ {Oh}_L$
(viscosity), as revealed in figure 11(c). This decrease in
$ {Oh}_L$
(viscosity), as revealed in figure 11(c). This decrease in
 $ H_{S,{max}}^*$
is primarily attributed to the increased shear stress within the uprising liquid sheet, resisting its expansion. It is noteworthy that the viscosity effect on central sheet expansion includes the dissipation in the liquid flow from the lamellae to the sheet and from the inner portion of the sheet to its outer rim.
$ H_{S,{max}}^*$
is primarily attributed to the increased shear stress within the uprising liquid sheet, resisting its expansion. It is noteworthy that the viscosity effect on central sheet expansion includes the dissipation in the liquid flow from the lamellae to the sheet and from the inner portion of the sheet to its outer rim.
Figure 11(c) also reveals the dependence of
 $ H_{S,{max}}^*$
on
$ H_{S,{max}}^*$
on
 $ {Oh}_L$
by two power-law fits, with
$ {Oh}_L$
by two power-law fits, with
 $ H_{S,{max}}^* \approx 0.32 {Oh}_L^{-0.20}$
for
$ H_{S,{max}}^* \approx 0.32 {Oh}_L^{-0.20}$
for
 $\textit{We}_{L,\textit{imp}} \approx 14.3$
and
$\textit{We}_{L,\textit{imp}} \approx 14.3$
and
 $ H_{S,{max}}^* \approx 0.42 {Oh}_L^{-0.21}$
for
$ H_{S,{max}}^* \approx 0.42 {Oh}_L^{-0.21}$
for
 $\textit{We}_{L,\textit{imp}} \approx 28.1$
, demonstrating a nearly inverse fifth-root dependency, i.e.
$\textit{We}_{L,\textit{imp}} \approx 28.1$
, demonstrating a nearly inverse fifth-root dependency, i.e.
 $ H_{S,{max}}^* \propto {Oh}_L^{-1/5}$
. Therefore, combining the dependence of
$ H_{S,{max}}^* \propto {Oh}_L^{-1/5}$
. Therefore, combining the dependence of
 $ H_{S,{max}}^*$
on
$ H_{S,{max}}^*$
on
 $\textit{We}_{L,\textit{imp}}$
and
$\textit{We}_{L,\textit{imp}}$
and
 $ {Oh}_L$
, a unified scaling law can be expressed as
$ {Oh}_L$
, a unified scaling law can be expressed as
 \begin{align} H_{S, max }^* \sim O h_L^{-1 / 5} W e_{L, i m p}^{1 / 2} . \end{align}
Figure 11(d) shows that the scaling law (3.8) is in good agreement with the experimental data for different viscosity cases; the dashed line, representing (3.8) with a numerical coefficient
 ${\approx} 0.088$
, fits the data with an R-squared value of 0.92. It is noteworthy that an independent fitting of a power-law relation,
${\approx} 0.088$
, fits the data with an R-squared value of 0.92. It is noteworthy that an independent fitting of a power-law relation,
 $ H_{S,{max}}^* = a {Oh}_L^b {We}_{L,\textit{imp}}^c$
(where
$ H_{S,{max}}^* = a {Oh}_L^b {We}_{L,\textit{imp}}^c$
(where
 $ a, b$
and
$ a, b$
and
 $ c$
are constants) to the experimental data using the curve-fitting toolbox of MATLAB led to
$ c$
are constants) to the experimental data using the curve-fitting toolbox of MATLAB led to
 $ H_{S,{max}}^* \approx 0.09 {Oh}_L^{-0.19} {We}_{L,\textit{imp}}^{0.49}$
, which is nearly identical to (3.8) and thus further substantiates the developed scaling law. In summary, the scaling law
$ H_{S,{max}}^* \approx 0.09 {Oh}_L^{-0.19} {We}_{L,\textit{imp}}^{0.49}$
, which is nearly identical to (3.8) and thus further substantiates the developed scaling law. In summary, the scaling law
 $ H_{S,{max}}^* \sim {We}_{L,\textit{imp}}^{1/2}$
is inadequate to scale
$ H_{S,{max}}^* \sim {We}_{L,\textit{imp}}^{1/2}$
is inadequate to scale
 $ H_{S,{max}}^*$
for different viscosity cases, rather
$ H_{S,{max}}^*$
for different viscosity cases, rather
 $ H_{S,{max}}^* \sim {Oh}_L^{-1/5} {We}_{L,\textit{imp}}^{1/2}$
can reliably scale the maximum dimensionless sheet height for different liquid viscosities. It is noted that, as shown in Appendix D, the lamella edge thickness
$ H_{S,{max}}^* \sim {Oh}_L^{-1/5} {We}_{L,\textit{imp}}^{1/2}$
can reliably scale the maximum dimensionless sheet height for different liquid viscosities. It is noted that, as shown in Appendix D, the lamella edge thickness
 $T_L$
at the onset of lamella–lamella interaction (i.e. at
$T_L$
at the onset of lamella–lamella interaction (i.e. at
 $\tau = \tau _0$
), which appears in both
$\tau = \tau _0$
), which appears in both
 $ \textit{We}_{L,imp}$
and
$ \textit{We}_{L,imp}$
and
 $ \textit{Oh}_L$
, increases with viscosity and contributes to the scaling law as
$ \textit{Oh}_L$
, increases with viscosity and contributes to the scaling law as
 $H_{S,\textit{max}}^{*} \sim T_L^{0.6}$
, and its measurement uncertainty (
$H_{S,\textit{max}}^{*} \sim T_L^{0.6}$
, and its measurement uncertainty (
 $6$
%–
$6$
%–
 $13$
%) propagates to only
$13$
%) propagates to only
 $3.6$
%–
$3.6$
%–
 $7.8$
% in
$7.8$
% in
 $H_{S,\textit{max}}^{*}$
.
$H_{S,\textit{max}}^{*}$
.
3.4. Non-simultaneous impacts
In the previous sections, the effect of viscosity on droplet-pair impacts has been characterised by investigating simultaneous droplet impacts. In addition, our recent study (Goswami & Hardalupas Reference Goswami and Hardalupas2024) comprehensively investigated non-simultaneous water droplet impacts, offering direct comparisons with their simultaneous counterparts. Based on the insights obtained from these earlier investigations, this section briefly explores the viscosity effect on the lamella spreading and central sheet evolution during non-simultaneous droplet impacts both qualitatively and quantitatively.
Figure 12 shows the temporal evolution of non-simultaneous droplet impacts, where a fixed time lag between impacts, i.e.
 $\Delta \tau ={\Delta t V_0}/{D_0}\approx 0.22$
, was maintained for different viscosities (
$\Delta \tau ={\Delta t V_0}/{D_0}\approx 0.22$
, was maintained for different viscosities (
 $\phi _g$
from
$\phi _g$
from
 $0$
% to
$0$
% to
 $80$
%;
$80$
%;
 $ \textit{Oh}=0.002$
to 0.177). For all cases, the impact Weber number (
$ \textit{Oh}=0.002$
to 0.177). For all cases, the impact Weber number (
 $ \textit{We}$
) and the dimensionless inter-droplet spacing (
$ \textit{We}$
) and the dimensionless inter-droplet spacing (
 $\Delta x^*$
) are constant at
$\Delta x^*$
) are constant at
 $ \textit{We}=131\pm 2$
and
$ \textit{We}=131\pm 2$
and
 $\Delta x^* = 1.79\pm 0.04$
, respectively. Due to the time lag
$\Delta x^* = 1.79\pm 0.04$
, respectively. Due to the time lag
 $\Delta \tau$
between droplet impacts, the evolved central sheets for these cases become inclined, as observed in non-simultaneous water droplet impacts detailed in (Goswami & Hardalupas Reference Goswami and Hardalupas2024). This sheet inclination becomes less pronounced with increasing viscosity (i.e.
$\Delta \tau$
between droplet impacts, the evolved central sheets for these cases become inclined, as observed in non-simultaneous water droplet impacts detailed in (Goswami & Hardalupas Reference Goswami and Hardalupas2024). This sheet inclination becomes less pronounced with increasing viscosity (i.e.
 $\phi _g$
). Also, as expected, the length (or height) of the central sheet appears to decrease with increasing
$\phi _g$
). Also, as expected, the length (or height) of the central sheet appears to decrease with increasing
 $\phi _g$
. Note that the variation of these central sheet characteristics is a combined effect of viscous dissipation before central sheet formation and during the subsequent central sheet expansion. Although simultaneous droplet impacts with the same lamella–lamella impact Weber number (
$\phi _g$
. Note that the variation of these central sheet characteristics is a combined effect of viscous dissipation before central sheet formation and during the subsequent central sheet expansion. Although simultaneous droplet impacts with the same lamella–lamella impact Weber number (
 $ \textit{We}_{L,imp}$
) for different viscosity cases could be obtained through experiments, as discussed in the previous section, it is very hard to achieve experimentally the same
$ \textit{We}_{L,imp}$
) for different viscosity cases could be obtained through experiments, as discussed in the previous section, it is very hard to achieve experimentally the same
 $ \textit{We}_{L,imp}$
for non-simultaneous impacts for different viscosity cases. Nevertheless, the viscosity effect on the dimensionless maximum sheet length
$ \textit{We}_{L,imp}$
for non-simultaneous impacts for different viscosity cases. Nevertheless, the viscosity effect on the dimensionless maximum sheet length
 $L_{S,\textit{max}}^*$
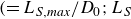 $(={L_{S,\textit{max}}}/{D_0}; L_S$
is defined in the inset of figure 13) for non-simultaneous impacts can still be assessed by quantitatively analysing the sheets observed in figure 12.
$(={L_{S,\textit{max}}}/{D_0}; L_S$
is defined in the inset of figure 13) for non-simultaneous impacts can still be assessed by quantitatively analysing the sheets observed in figure 12.

Figure 12. Impact morphologies of non-simultaneous droplet impacts with a fixed dimensionless time delay between impacts
 $\Delta \tau \approx 0.22$
for different viscosities (i.e. glycerol volume fraction
$\Delta \tau \approx 0.22$
for different viscosities (i.e. glycerol volume fraction
 $\phi _g$
from
$\phi _g$
from
 $0$
% (
$0$
% (
 $ \textit{Oh}=0.002$
) to
$ \textit{Oh}=0.002$
) to
 $80$
% (
$80$
% (
 $ \textit{Oh}=0.177$
)). The scale bar is
$ \textit{Oh}=0.177$
)). The scale bar is
 $2 \;\text{mm}$
in length. The impact Weber number and the dimensionless inter-droplet spacing are fixed at
$2 \;\text{mm}$
in length. The impact Weber number and the dimensionless inter-droplet spacing are fixed at
 $ \textit{We}=131\pm 2$
and
$ \textit{We}=131\pm 2$
and
 $\Delta x^* = 1.79\pm 0.04$
, respectively.
$\Delta x^* = 1.79\pm 0.04$
, respectively.

Figure 13. The dimensionless maximum sheet length
 $L_{S,{max}}^{*}$
as a function of
$L_{S,{max}}^{*}$
as a function of
 $ \textit{Oh}_L^{-1/5} We^{1/2}$
for different liquid viscosities (
$ \textit{Oh}_L^{-1/5} We^{1/2}$
for different liquid viscosities (
 $\phi _g=0$
% to
$\phi _g=0$
% to
 $80$
%;
$80$
%;
 $ \textit{Oh}=0.002 \text{ to } 0.177$
) for the non-simultaneous impacts presented in figure 12. The sheet length
$ \textit{Oh}=0.002 \text{ to } 0.177$
) for the non-simultaneous impacts presented in figure 12. The sheet length
 $L_S$
is schematically defined in the inset image. The dashed line represents the scaling law
$L_S$
is schematically defined in the inset image. The dashed line represents the scaling law
 $L_{S,{max}}^{*}\approx 0.088 Oh_L^{-1/5} We_{L,\textit{imp}}^{1/2}$
.
$L_{S,{max}}^{*}\approx 0.088 Oh_L^{-1/5} We_{L,\textit{imp}}^{1/2}$
.
The experimental investigations of Goswami & Hardalupas (Reference Goswami and Hardalupas2024) revealed that the dimensionless maximum sheet length,
 $L_{S,{max}}^*$
, exhibits a near square-root dependence on the lamella–lamella impact Weber number for non-simultaneous water droplet impacts, like their simultaneous counterparts. In other words,
$L_{S,{max}}^*$
, exhibits a near square-root dependence on the lamella–lamella impact Weber number for non-simultaneous water droplet impacts, like their simultaneous counterparts. In other words,
 $L_{S,{max}}^*$
approximately scales as
$L_{S,{max}}^*$
approximately scales as
 $L_{S,{max}}^* \sim We_{L,\textit{imp}}^{1/2}$
, where
$L_{S,{max}}^* \sim We_{L,\textit{imp}}^{1/2}$
, where
 $ \textit{We}_{L,\textit{imp}} = {(\rho V_{L1}^2 T_{L1} + \rho V_{L2}^2 T_{L2})}/{\sigma }$
where
$ \textit{We}_{L,\textit{imp}} = {(\rho V_{L1}^2 T_{L1} + \rho V_{L2}^2 T_{L2})}/{\sigma }$
where
 $V_{L1}$
and
$V_{L1}$
and
 $V_{L2}$
are the velocities of lamella edges and
$V_{L2}$
are the velocities of lamella edges and
 $T_{L1}$
and
$T_{L1}$
and
 $T_{L2}$
are the respective thicknesses of the lamella edges (see Goswami & Hardalupas Reference Goswami and Hardalupas2024 for more details). This summation form of
$T_{L2}$
are the respective thicknesses of the lamella edges (see Goswami & Hardalupas Reference Goswami and Hardalupas2024 for more details). This summation form of
 $ \textit{We}_{L,\textit{imp}}$
captures the total inertial input from both lamellae at the onset of their interaction, consistent with its definition as the ratio of driving inertia to resisting surface tension in central sheet formation. In addition, similar to the simultaneous impacts, the viscosity effect can be characterised by the lamella Ohnesorge number
$ \textit{We}_{L,\textit{imp}}$
captures the total inertial input from both lamellae at the onset of their interaction, consistent with its definition as the ratio of driving inertia to resisting surface tension in central sheet formation. In addition, similar to the simultaneous impacts, the viscosity effect can be characterised by the lamella Ohnesorge number
 $ \textit{Oh}_L$
as
$ \textit{Oh}_L$
as
 $L_{S,{max}}^* \propto \textit{Oh}_L^{-1/5}$
, where
$L_{S,{max}}^* \propto \textit{Oh}_L^{-1/5}$
, where
 $ \textit{Oh}_L = (\textit{Oh}_{L1} + \textit{Oh}_{L2})/2$
with
$ \textit{Oh}_L = (\textit{Oh}_{L1} + \textit{Oh}_{L2})/2$
with
 $ \textit{Oh}_{L1} = \mu / \sqrt {\rho \sigma T_{L1}}$
and
$ \textit{Oh}_{L1} = \mu / \sqrt {\rho \sigma T_{L1}}$
and
 $ \textit{Oh}_{L2} = \mu / \sqrt {\rho \sigma T_{L2}}$
as the Ohnesorge numbers of the respective lamellae. Incorporating the numerical coefficient derived for simultaneous impacts, the scaling law for the non-simultaneous impacts is approximated as
$ \textit{Oh}_{L2} = \mu / \sqrt {\rho \sigma T_{L2}}$
as the Ohnesorge numbers of the respective lamellae. Incorporating the numerical coefficient derived for simultaneous impacts, the scaling law for the non-simultaneous impacts is approximated as
 $L_{S,{max}}^* \approx 0.088 Oh_L^{-1/5} We_{L,\textit{imp}}^{1/2}$
. Figure 13 compares this scaling law with the experimental
$L_{S,{max}}^* \approx 0.088 Oh_L^{-1/5} We_{L,\textit{imp}}^{1/2}$
. Figure 13 compares this scaling law with the experimental
 $L_{S,{max}}^*$
for the central sheets of figure 12. The dashed line in figure 13 represents the scaling law, and its excellent agreement with the experimental data suggests the applicability of this scaling for both simultaneous and non-simultaneous droplet impacts for different viscosities. In sum, the scaling
$L_{S,{max}}^*$
for the central sheets of figure 12. The dashed line in figure 13 represents the scaling law, and its excellent agreement with the experimental data suggests the applicability of this scaling for both simultaneous and non-simultaneous droplet impacts for different viscosities. In sum, the scaling
 $L_{S,{max}}^* \sim Oh_L^{-1/5} We_{L,\textit{imp}}^{1/2}$
emerges as a general scaling law applicable to both simultaneous and non-simultaneous impacts involving droplets of identical or varying sizes, impacting with equal or differing velocities, across a range of liquid viscosities.
$L_{S,{max}}^* \sim Oh_L^{-1/5} We_{L,\textit{imp}}^{1/2}$
emerges as a general scaling law applicable to both simultaneous and non-simultaneous impacts involving droplets of identical or varying sizes, impacting with equal or differing velocities, across a range of liquid viscosities.
The spreading dynamics of the unaffected lamella portions on the impact substrate, as depicted in figure 12, exhibits a qualitative resemblance to those observed for non-simultaneous impacts of (Goswami & Hardalupas Reference Goswami and Hardalupas2024). Figure 14 shows the temporal evolution of dimensionless spread radii
 $R_1^* = {R_1}/{D_0}$
and
$R_1^* = {R_1}/{D_0}$
and
 $R_2^* = {R_2}/{D_0}$
(where
$R_2^* = {R_2}/{D_0}$
(where
 $R_1$
and
$R_1$
and
 $R_2$
are defined in figure 14
a) for the impact cases presented in figure 12. For the different viscosity cases (
$R_2$
are defined in figure 14
a) for the impact cases presented in figure 12. For the different viscosity cases (
 $\phi _g = 0$
% to
$\phi _g = 0$
% to
 $80$
%),
$80$
%),
 $R_1^*$
and
$R_1^*$
and
 $R_2^*$
initially differ appreciably due to the time lag
$R_2^*$
initially differ appreciably due to the time lag
 $\Delta \tau$
, but subsequently, they become equal as both lamellae reach their maximum spreads (figure 14). Therefore, any spreading theory capable of predicting
$\Delta \tau$
, but subsequently, they become equal as both lamellae reach their maximum spreads (figure 14). Therefore, any spreading theory capable of predicting
 $R^*(\tau )$
including the high-viscosity cases, would enable prediction of the temporal evolution of
$R^*(\tau )$
including the high-viscosity cases, would enable prediction of the temporal evolution of
 $R_1^*$
,
$R_1^*$
,
 $R_2^*$
and the combined liquid spread as
$R_2^*$
and the combined liquid spread as
 $R^*(\tau )$
,
$R^*(\tau )$
,
 $R^*(\tau - \Delta \tau )$
and
$R^*(\tau - \Delta \tau )$
and
 $R^*(\tau ) + \Delta x^* + R^*(\tau - \Delta \tau )$
, respectively, as discussed in (Goswami & Hardalupas Reference Goswami and Hardalupas2024), for all the viscosity cases.
$R^*(\tau ) + \Delta x^* + R^*(\tau - \Delta \tau )$
, respectively, as discussed in (Goswami & Hardalupas Reference Goswami and Hardalupas2024), for all the viscosity cases.

Figure 14. (a) Definition of spread radii of first and second droplets, i.e.
 $R_1$
and
$R_1$
and
 $R_2$
. (b–f) Temporal variation of the dimensionless spread radii (
$R_2$
. (b–f) Temporal variation of the dimensionless spread radii (
 $R_1^*$
and
$R_1^*$
and
 $R_2^*$
) of individual droplets for different viscosities (glycerol volume fraction
$R_2^*$
) of individual droplets for different viscosities (glycerol volume fraction
 $\phi _g$
from
$\phi _g$
from
 $0$
% to
$0$
% to
 $80$
%, corresponding to
$80$
%, corresponding to
 $ \textit{Oh}=0.002$
to 0.177). Error bars represent standard deviations from mean data and are only visible where error bars are larger than the symbol size.
$ \textit{Oh}=0.002$
to 0.177). Error bars represent standard deviations from mean data and are only visible where error bars are larger than the symbol size.
4. Conclusions
This study investigated the effect of droplet liquid viscosity on simultaneous and non-simultaneous droplet-pair impacts on solid substrates. The dimensionless Ohnesorge number, which characterises the effect of liquid viscosity, was varied from
 ${\sim} 0.002$
to
${\sim} 0.002$
to
 ${\sim} 0.177$
, while inter-droplet spacing (relative to the droplet diameter) ranged from 1.43 to 1.85, under impact Weber numbers between 81 and 131. Simultaneous impacts were initially examined under fixed impact Weber number and dimensionless inter-droplet spacing to characterise the spreading dynamics and the evolution of the central sheet formed by droplets’ interaction. Based on insights from the initial findings, additional experiments were conducted to isolate the effect of viscosity on the extension of the central sheet across different viscosities and to derive an appropriate scaling law for the maximum extension of the sheet. For the non-simultaneous droplet impacts, the applicability of the derived scaling law for the maximum sheet extension and the spreading dynamics of the non-simultaneous droplets were explored systematically. The main findings of this study can be listed as follows.
${\sim} 0.177$
, while inter-droplet spacing (relative to the droplet diameter) ranged from 1.43 to 1.85, under impact Weber numbers between 81 and 131. Simultaneous impacts were initially examined under fixed impact Weber number and dimensionless inter-droplet spacing to characterise the spreading dynamics and the evolution of the central sheet formed by droplets’ interaction. Based on insights from the initial findings, additional experiments were conducted to isolate the effect of viscosity on the extension of the central sheet across different viscosities and to derive an appropriate scaling law for the maximum extension of the sheet. For the non-simultaneous droplet impacts, the applicability of the derived scaling law for the maximum sheet extension and the spreading dynamics of the non-simultaneous droplets were explored systematically. The main findings of this study can be listed as follows.
-
(i) The impact morphology of droplet-pair interactions exhibits distinct characteristics depending on droplet liquid viscosity. For a given impact Weber number and dimensionless inter-droplet spacing, increasing the droplet viscosity leads to a transition in the central sheet morphology from well-defined ‘semilunar’ central sheets to relatively ephemeral liquid bumps, and ultimately to gentle lamella coalescence. Also, the increasing droplet viscosity forms a thicker central sheet and suppresses the formation of propagating capillary waves and subsequent sheet rim corrugations.
-
(ii) The liquid spreading of the high-viscosity droplet impacts cannot be represented reliably by existing theoretical models and the time-dependent lamella spread radius cannot be predicted. Liquid viscosity (Ohnesorge number) affects the later stages of droplet spreading due to increased viscous dissipation, significantly reducing the maximum spread of droplets and, thus, the combined liquid spread of the droplet pair. While the Gordillo et al. (Reference Gordillo, Riboux and Quintero2019) model performs well for liquid viscosities up to 16.06 mPa s (
 $ \textit{Oh}=0.031$
), a scaling law introduced by Laan et al. (Reference Laan, de Bruin, Bartolo, Josserand and Bonn2014) offers a more reasonable prediction for the maximum spread in high-viscosity cases.
$ \textit{Oh}=0.031$
), a scaling law introduced by Laan et al. (Reference Laan, de Bruin, Bartolo, Josserand and Bonn2014) offers a more reasonable prediction for the maximum spread in high-viscosity cases. -
(iii) For a given impact Weber number and inter-droplet spacing, the liquid viscosity strongly influences the dimensionless maximum extension of the central sheet, with higher viscosity causing a significant reduction in sheet extension. This reduction is primarily attributed to viscous dissipation occurring both during the lamella spreading phase, before the central sheet forms and throughout the subsequent expansion of the sheet in ambient quiescent air.
-
(iv) An empirical scaling law for the maximum dimensionless sheet extension is obtained as
$L_{S,{max}}^* \sim {Oh}_L^{-1/5} {We}_{L,\textit{imp}}^{1/2}$
. This scaling applies to both simultaneous and non-simultaneous droplet-pair impacts across varying viscosities, highlighting the interplay between liquid viscosity (characterised by lamella Ohnesorge number
$ \textit{Oh}_L$
) and impact inertia (characterised by lamella–lamella impact Weber number
${We}_{L,\textit{imp}}$
), regardless of identical or non-identical droplet sizes and impact velocities. -
(v) The temporal evolution of dimensionless spread radii for non-simultaneous impacts across different viscosities suggests that spreading theories, which can predict spread radii for both low- and high-viscosity liquids, may have the ability to predict the combined liquid spread for such impacts.

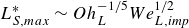


Overall, this study characterised the liquid viscosity effect on both simultaneous and non-simultaneous droplet impacts and offered a general scaling law for the central sheet expansion applicable to such impacts involving different droplet sizes and velocities. In this way, this study provides physical insights into complex multi-droplet-impact phenomena and a foundation for designing and optimising numerous practical applications involving such droplet impacts.
Future research directions could include numerical simulations to complement the experimental findings and provide deeper insight into the internal flow dynamics during droplet-pair impacts. Additionally, investigations on textured or non-flat surfaces could reveal further complexities in lamella spreading and central sheet evolution, offering broader applicability of the findings to real-world scenarios.
Acknowledgements
The authors gratefully acknowledge the financial support provided by the Commonwealth Scholarship Commission in the UK through the PhD Scholarship (BDCS-2019-45).
Declaration of interests
The authors report no conflicts of interest.
Data availability statement
The data that support the findings of this study are available from the corresponding author upon reasonable request.
Appendix A. Uncertainty analysis
In this study, measurement uncertainties associated with the automated image analysis routines were evaluated as a combination of systematic uncertainty (due to pixel resolution and thresholding) and random uncertainty. For any fundamental quantity
 $X$
, the combined uncertainty was determined as (Wheeler et al. Reference Wheeler, Ganji, Krishnan and Thurow2010)
$X$
, the combined uncertainty was determined as (Wheeler et al. Reference Wheeler, Ganji, Krishnan and Thurow2010)
 \begin{align} e_X = \sqrt {(S_X)^2 + (P_X)^2} , \end{align}
where
 $S_X$
is the systematic uncertainty and
$S_X$
is the systematic uncertainty and
 $P_X$
is the random uncertainty, and
$P_X$
is the random uncertainty, and
 $S_X$
and
$S_X$
and
 $P_X$
were calculated as
$P_X$
were calculated as
 \begin{align} S_X = \left ( \sum _{i=1}^{n} e_{\textit{syst},i}^2 \right )^{1/2} , \\[-28pt] \nonumber \end{align}
 \begin{align} P_X = \left ( \sum _{i=1}^{n} e_{\textit{rand},i}^2 \right )^{1/2} , \\[0pt] \nonumber \end{align}
with
 $e_{\textit{syst},i}$
and
$e_{\textit{syst},i}$
and
 $e_{\textit{rand},i}$
as the systematic and random uncertainties from the
$e_{\textit{rand},i}$
as the systematic and random uncertainties from the
 $i$
th source.
$i$
th source.
For example, the combined uncertainty in the measurement of the initial droplet diameter (
 $D_0$
) was evaluated as follows. For all droplet-impact conditions of this study,
$D_0$
) was evaluated as follows. For all droplet-impact conditions of this study,
 $D_0$
was obtained from an automated image processing routine applied to
$D_0$
was obtained from an automated image processing routine applied to
 $20$
consecutive images before impact. The diameter was determined as the area-equivalent value,
$20$
consecutive images before impact. The diameter was determined as the area-equivalent value,
 $D_0 = 2 (A_p/\pi )^{1/2}$
, with
$D_0 = 2 (A_p/\pi )^{1/2}$
, with
 $A_p$
as the projected droplet area in each image. The 8-bit grey-scale images were binarised using a threshold value (within
$A_p$
as the projected droplet area in each image. The 8-bit grey-scale images were binarised using a threshold value (within
 $0$
–
$0$
–
 $255$
) computed via Otsu’s method (Otsu Reference Otsu1979) applied to the droplet-impact images. Figure 15 shows the sensitivity of
$255$
) computed via Otsu’s method (Otsu Reference Otsu1979) applied to the droplet-impact images. Figure 15 shows the sensitivity of
 $D_0$
measurement to variations in image thresholding within
$D_0$
measurement to variations in image thresholding within
 $\pm 10$
% of the Otsu threshold value for a typical image (the top-left inset of figure 15). The Otsu threshold value for this case is
$\pm 10$
% of the Otsu threshold value for a typical image (the top-left inset of figure 15). The Otsu threshold value for this case is
 $131$
, leading to
$131$
, leading to
 $D_0 \approx 3.10\ \mathrm{mm}$
. The relative difference in droplet diameter,
$D_0 \approx 3.10\ \mathrm{mm}$
. The relative difference in droplet diameter,
 $\Delta D_0 / D_0$
, where
$\Delta D_0 / D_0$
, where
 $\Delta D_0 = D_0 - D_T$
and
$\Delta D_0 = D_0 - D_T$
and
 $D_T$
is the diameter at any threshold within
$D_T$
is the diameter at any threshold within
 $\pm 10$
% of the Otsu value, remained within
$\pm 10$
% of the Otsu value, remained within
 $\pm 0.25$
%, indicating that the maximum threshold-induced uncertainty,
$\pm 0.25$
%, indicating that the maximum threshold-induced uncertainty,
 $e_t$
, in
$e_t$
, in
 $D_0$
measurement is within
$D_0$
measurement is within
 $\pm 0.25$
% of the measured value. The uncertainty associated with pixel resolution was estimated as
$\pm 0.25$
% of the measured value. The uncertainty associated with pixel resolution was estimated as
 $e_P = \pm 1$
pixel (
$e_P = \pm 1$
pixel (
 ${\approx} \pm 0.03\ \mathrm{mm}$
). However, the area-based diameter calculation was found to be appreciably less sensitive to pixel resolution effects compared with one-dimensional measurements, consistent with the findings of García-Tabarés et al. (Reference García-Tabarés, Abramian, Calero, Toral, Ijspeert and Peréz2002). Finally, the random uncertainty (
${\approx} \pm 0.03\ \mathrm{mm}$
). However, the area-based diameter calculation was found to be appreciably less sensitive to pixel resolution effects compared with one-dimensional measurements, consistent with the findings of García-Tabarés et al. (Reference García-Tabarés, Abramian, Calero, Toral, Ijspeert and Peréz2002). Finally, the random uncertainty (
 $e_{\textit{rand}}$
), obtained from the standard deviation of
$e_{\textit{rand}}$
), obtained from the standard deviation of
 $D_0$
across the image batch, was within
$D_0$
across the image batch, was within
 $\pm 0.01\ \mathrm{mm}$
, i.e. within
$\pm 0.01\ \mathrm{mm}$
, i.e. within
 ${\approx} 0.3$
% of the measured value. Therefore, considering
${\approx} 0.3$
% of the measured value. Therefore, considering
 $e_t$
,
$e_t$
,
 $e_p$
and
$e_p$
and
 $e_{\textit{rand}}$
, the combined measurement uncertainty of
$e_{\textit{rand}}$
, the combined measurement uncertainty of
 $D_0$
, evaluated using (A1)–(A3), was within
$D_0$
, evaluated using (A1)–(A3), was within
 $1$
%.
$1$
%.

Figure 15. Sensitivity of droplet diameter
 $D_0$
measurement to variations of
$D_0$
measurement to variations of
 $\pm 10$
% of the Otsu threshold value. The top-right inset shows a typical image for analysis. The bottom-left inset shows the droplet relative difference in diameter,
$\pm 10$
% of the Otsu threshold value. The top-right inset shows a typical image for analysis. The bottom-left inset shows the droplet relative difference in diameter,
 $\Delta D_0/D_0$
, as a function of threshold level, where
$\Delta D_0/D_0$
, as a function of threshold level, where
 $\Delta D_0 = D_0 - D_T$
, with
$\Delta D_0 = D_0 - D_T$
, with
 $D_0$
as the droplet diameter at the Otsu threshold and
$D_0$
as the droplet diameter at the Otsu threshold and
 $D_T$
as the diameter at any other threshold value.
$D_T$
as the diameter at any other threshold value.
For a parameter
 $q$
that is a function of several fundamental parameters
$q$
that is a function of several fundamental parameters
 $X_1, X_2, X_3,\ldots$
, each with respective uncertainties
$X_1, X_2, X_3,\ldots$
, each with respective uncertainties
 $e_{X_1}, e_{X_2}, e_{X_3},\ldots$
, the propagated uncertainty in
$e_{X_1}, e_{X_2}, e_{X_3},\ldots$
, the propagated uncertainty in
 $p$
was evaluated as (Wheeler et al. Reference Wheeler, Ganji, Krishnan and Thurow2010)
$p$
was evaluated as (Wheeler et al. Reference Wheeler, Ganji, Krishnan and Thurow2010)
 \begin{align} e_q = \sqrt { \left ( \frac {\partial q}{\partial X_1}\,e_{X_1} \right )^2 +\left ( \frac {\partial q}{\partial X_2}\,e{X_2} \right )^2 +\left ( \frac {\partial q}{\partial X_3}\,e{X_3} \right )^2 +{\cdots} } . \end{align}
Following these approaches, uncertainties were evaluated for all measured parameters. The uncertainties in droplet diameter
 $D_0$
, inter-droplet spacing
$D_0$
, inter-droplet spacing
 $\Delta x$
and sheet length
$\Delta x$
and sheet length
 $L_S$
were approximately
$L_S$
were approximately
 $1$
%. For the time-resolved parameters, namely the spread radius
$1$
%. For the time-resolved parameters, namely the spread radius
 $R(t)$
and sheet height
$R(t)$
and sheet height
 $H_S(t)$
, the uncertainty was within
$H_S(t)$
, the uncertainty was within
 $1.5$
% for values exceeding
$1.5$
% for values exceeding
 $0.5 D_0$
. However, the relative uncertainties were larger at early times due to small absolute values of parameter and fixed pixel resolution uncertainty; for instance, reaching up to
$0.5 D_0$
. However, the relative uncertainties were larger at early times due to small absolute values of parameter and fixed pixel resolution uncertainty; for instance, reaching up to
 $5$
% for
$5$
% for
 $R \approx 0.2 D_0$
. The impact velocity (
$R \approx 0.2 D_0$
. The impact velocity (
 $V_0$
) ranged from 1.13 to
$V_0$
) ranged from 1.13 to
 $1.78\ \mathrm{m\,s^{-1}}$
across the experiments, with a maximum measurement uncertainty of approximately
$1.78\ \mathrm{m\,s^{-1}}$
across the experiments, with a maximum measurement uncertainty of approximately
 $1$
%. Based on the uncertainties of
$1$
%. Based on the uncertainties of
 $D_0$
and
$D_0$
and
 $V_0$
, the propagated uncertainty in the impact
$V_0$
, the propagated uncertainty in the impact
 $ \textit{We}$
was estimated to be
$ \textit{We}$
was estimated to be
 $2.2$
%. The uncertainty in the lamella velocity
$2.2$
%. The uncertainty in the lamella velocity
 $V_L$
, typically of the same order as
$V_L$
, typically of the same order as
 $V_0$
, was also approximately
$V_0$
, was also approximately
 $1$
%. The lamella thickness
$1$
%. The lamella thickness
 $T_L$
near the spread radius was measured manually using ImageJ software, with 12 times magnification of images and an uncertainty of
$T_L$
near the spread radius was measured manually using ImageJ software, with 12 times magnification of images and an uncertainty of
 $\pm 1$
pixel. The parameter
$\pm 1$
pixel. The parameter
 $T_L$
was measured only at the onset of lamella–lamella interaction (
$T_L$
was measured only at the onset of lamella–lamella interaction (
 $\tau = \tau _0$
). Across all experimental cases,
$\tau = \tau _0$
). Across all experimental cases,
 $T_L$
ranged from 0.23 to
$T_L$
ranged from 0.23 to
 $0.49\ \mathrm{mm}$
, leading to a maximum measurement uncertainty of approximately
$0.49\ \mathrm{mm}$
, leading to a maximum measurement uncertainty of approximately
 $13$
% (see Appendix D for its influence on the scaling law).
$13$
% (see Appendix D for its influence on the scaling law).
Appendix B. Measurement of central sheet length through image analysis
The length of the inclined central sheet,
 $L_S$
, formed during non-simultaneous droplet impacts, was measured using an image analysis routine applied to a predefined batch of images. In this study,
$L_S$
, formed during non-simultaneous droplet impacts, was measured using an image analysis routine applied to a predefined batch of images. In this study,
 $L_S$
was measured to obtain its maximum value,
$L_S$
was measured to obtain its maximum value,
 $L_{S,\textit{max}}$
, which was used in the scaling law
$L_{S,\textit{max}}$
, which was used in the scaling law
 $L_{S,\textit{max}}^{*} \sim h_L^{-1/5} We_{L,\textit{imp}}^{1/2}$
(figure 13), where
$L_{S,\textit{max}}^{*} \sim h_L^{-1/5} We_{L,\textit{imp}}^{1/2}$
(figure 13), where
 $L_{S,\textit{max}}^{*} = L_{S,\textit{max}}/D_0$
. The corresponding image batches were selected accordingly for analysis. Figure 16 shows an example of the image analysis applied to frames
$L_{S,\textit{max}}^{*} = L_{S,\textit{max}}/D_0$
. The corresponding image batches were selected accordingly for analysis. Figure 16 shows an example of the image analysis applied to frames
 $84$
–
$84$
–
 $91$
from a droplet-impact movie. A predefined separator line (the horizontal cyan line in figure 16) was used to isolate the central sheet from the underlying surface liquid (figure 16) in each frame of the batch. The isolated central sheet region is then binarised and processed to identify its peak point (i.e. the mid-point of multiple adjacent pixels at the sheet apex) and the root point (i.e. the midpoint of the base of the isolated sheet). A straight line (the yellow line in figure 16) was then drawn between these two points and extended down to the predefined impact substrate line (the red dashed line in figure 16). The length of this yellow line is the measured
$91$
from a droplet-impact movie. A predefined separator line (the horizontal cyan line in figure 16) was used to isolate the central sheet from the underlying surface liquid (figure 16) in each frame of the batch. The isolated central sheet region is then binarised and processed to identify its peak point (i.e. the mid-point of multiple adjacent pixels at the sheet apex) and the root point (i.e. the midpoint of the base of the isolated sheet). A straight line (the yellow line in figure 16) was then drawn between these two points and extended down to the predefined impact substrate line (the red dashed line in figure 16). The length of this yellow line is the measured
 $L_S$
in each frame of the batch. Figure 16 shows the identified points and lines plotted on the cropped frames of the batch.
$L_S$
in each frame of the batch. Figure 16 shows the identified points and lines plotted on the cropped frames of the batch.

Figure 16. Image analysis of a predefined batch of frames to determine the length of inclined central sheet,
 $L_S$
, for non-simultaneous droplet impacts. In the top-left frame, the cyan line marks the separator used to isolate the central sheet from the surface liquid. The magenta and red points in each image represent the peak and root of the central sheet, respectively. The yellow line, drawn between the peak and root points and extended down to the impact substrate line (the red dashed line), represent the measured
$L_S$
, for non-simultaneous droplet impacts. In the top-left frame, the cyan line marks the separator used to isolate the central sheet from the surface liquid. The magenta and red points in each image represent the peak and root of the central sheet, respectively. The yellow line, drawn between the peak and root points and extended down to the impact substrate line (the red dashed line), represent the measured
 $L_S$
in each frame.
$L_S$
in each frame.
Appendix C. Spreading of high-viscosity droplets during single-droplet and droplet-pair impacts
Figure 17 shows a comparison of droplet spreading during single-droplet and droplet-pair impacts (
 $\Delta x^{*} \approx 1.80$
for the droplet-pair, corresponding to the case in figure 3) for high-viscosity droplets with
$\Delta x^{*} \approx 1.80$
for the droplet-pair, corresponding to the case in figure 3) for high-viscosity droplets with
 $\phi _g = 70$
% (
$\phi _g = 70$
% (
 $ \textit{Oh} = 0.067$
) with an impact Weber number of
$ \textit{Oh} = 0.067$
) with an impact Weber number of
 $ \textit{We} \approx 130$
. The definition of the time-dependent spread radius,
$ \textit{We} \approx 130$
. The definition of the time-dependent spread radius,
 $R(\tau )$
, for both impact cases is shown in figure 17(a), while figure 17(b) shows a direct comparison of the non-dimensional spread radius
$R(\tau )$
, for both impact cases is shown in figure 17(a), while figure 17(b) shows a direct comparison of the non-dimensional spread radius
 $R^{*}(\tau ) = R(\tau )/D_0$
for the two impact scenarios. The time-resolved evolution of
$R^{*}(\tau ) = R(\tau )/D_0$
for the two impact scenarios. The time-resolved evolution of
 $R^{*}(\tau )$
for the droplet-pair case closely coincides with that of the single-droplet case, with a maximum relative difference of only
$R^{*}(\tau )$
for the droplet-pair case closely coincides with that of the single-droplet case, with a maximum relative difference of only
 $2$
%. This negligible difference in
$2$
%. This negligible difference in
 $R^{*}(\tau )$
confirms that the spreading of the non-interacting lamella portions remains unaffected by the formation and growth of the central uprising sheet for high-viscosity glycerol–water droplet impacts, consistent with similar behaviour reported previously for water droplets (Roisman et al. Reference Roisman, Prunet-Foch, Tropea and Vignes-Adler2002; Goswami & Hardalupas Reference Goswami and Hardalupas2023, Reference Goswami and Hardalupas2024).
$R^{*}(\tau )$
confirms that the spreading of the non-interacting lamella portions remains unaffected by the formation and growth of the central uprising sheet for high-viscosity glycerol–water droplet impacts, consistent with similar behaviour reported previously for water droplets (Roisman et al. Reference Roisman, Prunet-Foch, Tropea and Vignes-Adler2002; Goswami & Hardalupas Reference Goswami and Hardalupas2023, Reference Goswami and Hardalupas2024).

Figure 17. High-viscosity single-droplet and droplet-pair (with
 $\Delta x^{*} \approx 1.80$
) impacts,
$\Delta x^{*} \approx 1.80$
) impacts,
 $\phi _g = 70$
% (
$\phi _g = 70$
% (
 $ \textit{Oh} = 0.067$
) and
$ \textit{Oh} = 0.067$
) and
 $ \textit{We} \approx 130$
. (a) Temporal morphological evolution with the definition of spread radius,
$ \textit{We} \approx 130$
. (a) Temporal morphological evolution with the definition of spread radius,
 $R(\tau )$
, for both cases. (b) Comparison of the non-dimensional spread radius
$R(\tau )$
, for both cases. (b) Comparison of the non-dimensional spread radius
 $R^{*}(\tau ) = R(\tau )/D_0$
between the two cases.
$R^{*}(\tau ) = R(\tau )/D_0$
between the two cases.
Appendix D. Dependence of dimensionless central sheet height on lamella edge thickness at the instant of lamella–lamella impact
Equation (3.8) proposed the scaling law for the dimensionless maximum sheet height
 $H_{S,\textit{max}}^{*}$
as
$H_{S,\textit{max}}^{*}$
as
 \begin{align} H_{S,\textit{max}}^{*} \sim Oh_L^{-1/5} We_{L,\textit{imp}}^{1/2}, \end{align}
with
 $ \textit{We}_{L,imp} = 2 \rho V_L^{2} T_L / \sigma$
and
$ \textit{We}_{L,imp} = 2 \rho V_L^{2} T_L / \sigma$
and
 $ \textit{Oh}_L = \mu / \sqrt {\rho \sigma T_L}$
. Substituting these relations for
$ \textit{Oh}_L = \mu / \sqrt {\rho \sigma T_L}$
. Substituting these relations for
 $ \textit{We}_{L,imp}$
and
$ \textit{We}_{L,imp}$
and
 $ \textit{Oh}_L$
yields
$ \textit{Oh}_L$
yields
 \begin{align} H_{S,\textit{max}}^{*} \sim \left ( \frac {\mu }{\sqrt {\rho \sigma T_L}} \right )^{-1/5} \left ( \frac {2 \rho V_L^{2} T_L}{\sigma } \right )^{1/2}, \\[-28pt] \nonumber \end{align}
 \begin{align} H_{S,\textit{max}}^{*} \sim T_L^{0.6} V_L \mu ^{-0.2} \rho ^{0.6} \sigma ^{-0.4} . \\[0pt] \nonumber \end{align}
Thus, the scaling law predicts a power-law dependence of
 $H_{S,\textit{max}}^{*}$
on the lamella edge thickness
$H_{S,\textit{max}}^{*}$
on the lamella edge thickness
 $T_L$
at the first instant of lamella interaction (dimensionless time
$T_L$
at the first instant of lamella interaction (dimensionless time
 $\tau = \tau _0$
), with exponent
$\tau = \tau _0$
), with exponent
 $0.6$
. The uncertainty in
$0.6$
. The uncertainty in
 $T_L$
is approximately
$T_L$
is approximately
 $0.03\ \mathrm{mm}$
, as detailed in Appendix A.
$0.03\ \mathrm{mm}$
, as detailed in Appendix A.

Figure 18. Variation of measured lamella edge thickness (
 $T_L$
) with droplet viscosity (
$T_L$
) with droplet viscosity (
 $\mu$
), for different impact Weber numbers (
$\mu$
), for different impact Weber numbers (
 $ \textit{We}$
). Error bars represent standard deviations from mean data.
$ \textit{We}$
). Error bars represent standard deviations from mean data.
Figure 18 shows the measured values of
 $T_L$
at
$T_L$
at
 $\tau = \tau _0$
for impact Weber numbers
$\tau = \tau _0$
for impact Weber numbers
 $ \textit{We} = 81$
,
$ \textit{We} = 81$
,
 $104$
and
$104$
and
 $130$
at fixed dimensionless inter-droplet spacing
$130$
at fixed dimensionless inter-droplet spacing
 $\Delta x^{*} = 1.80$
, across all viscosity cases (
$\Delta x^{*} = 1.80$
, across all viscosity cases (
 $\phi _g = 0$
–
$\phi _g = 0$
–
 $80$
%, see figures 3, 4 and 5 for related morphologies). The lamella edge thickness
$80$
%, see figures 3, 4 and 5 for related morphologies). The lamella edge thickness
 $T_L$
increases with viscosity, from
$T_L$
increases with viscosity, from
 ${\approx} 0.23\ \mathrm{mm}$
for the least viscous water droplets (
${\approx} 0.23\ \mathrm{mm}$
for the least viscous water droplets (
 $\phi _g = 0$
%,
$\phi _g = 0$
%,
 $\mu = 1.01$
mPa s and
$\mu = 1.01$
mPa s and
 $ \textit{We} = 130$
) to
$ \textit{We} = 130$
) to
 ${\approx} 0.49\ \mathrm{mm}$
for the most viscous glycerol–water droplets (
${\approx} 0.49\ \mathrm{mm}$
for the most viscous glycerol–water droplets (
 $\phi _g = 80$
%,
$\phi _g = 80$
%,
 $\mu = 91.46$
mPa s and
$\mu = 91.46$
mPa s and
 $ \textit{We} = 81$
). It is noted that the measured
$ \textit{We} = 81$
). It is noted that the measured
 $T_L$
values at
$T_L$
values at
 $\tau = \tau _0$
for all other experimental cases, mentioned in table 3, also fall within this range. Therefore, the relative measurement uncertainty of
$\tau = \tau _0$
for all other experimental cases, mentioned in table 3, also fall within this range. Therefore, the relative measurement uncertainty of
 $T_L$
, i.e.
$T_L$
, i.e.
 $e_{T_L}/ T_L$
, decreases from
$e_{T_L}/ T_L$
, decreases from
 ${\approx} 13$
% at low viscosity to
${\approx} 13$
% at low viscosity to
 ${\approx} 6$
% for high-viscosity experimental cases. Accordingly, as
${\approx} 6$
% for high-viscosity experimental cases. Accordingly, as
 $H_{S,\textit{max}}^{*} \sim T_L^{0.6}$
, the propagated relative uncertainty in
$H_{S,\textit{max}}^{*} \sim T_L^{0.6}$
, the propagated relative uncertainty in
 $H_{S,\textit{max}}^{*}$
is
$H_{S,\textit{max}}^{*}$
is
 $e_{H_{S,\textit{max}}^{*}}/H_{S,\textit{max}}^{*} = 0.6 \times e_{T_L} / T_L$
, corresponding to
$e_{H_{S,\textit{max}}^{*}}/H_{S,\textit{max}}^{*} = 0.6 \times e_{T_L} / T_L$
, corresponding to
 $7.8$
% for water droplets and
$7.8$
% for water droplets and
 $3.6$
% for the most viscous droplets. These values demonstrate that the measurement uncertainty of
$3.6$
% for the most viscous droplets. These values demonstrate that the measurement uncertainty of
 $T_L$
has only a modest effect on the scaling law.
$T_L$
has only a modest effect on the scaling law.


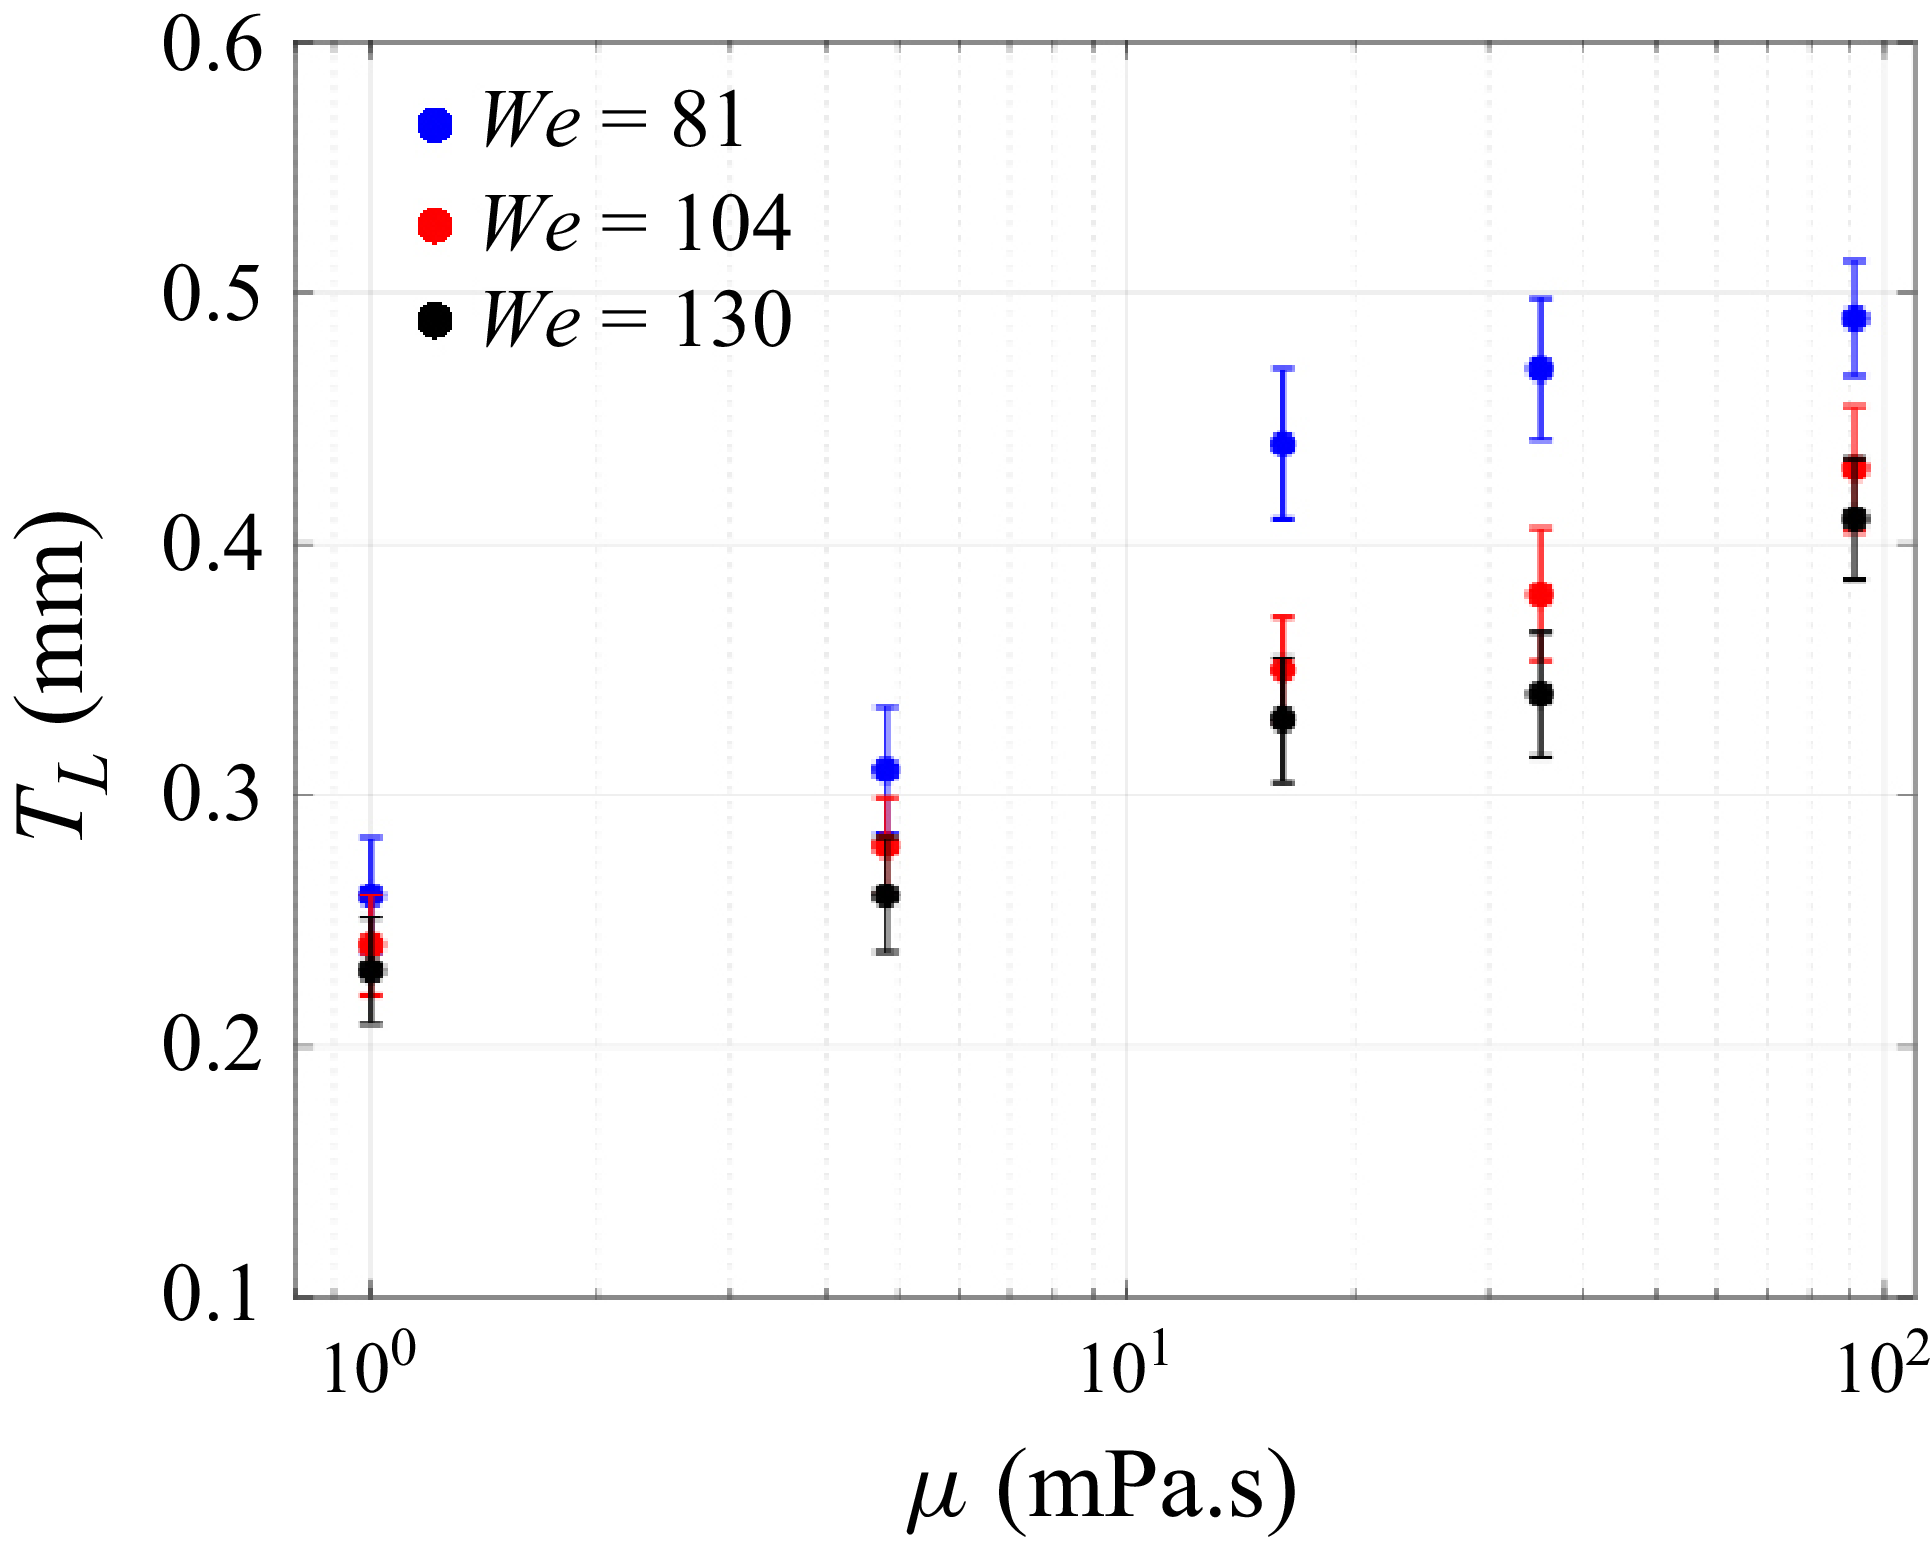


 Open access