In the context of the rising cost of raw feed materials, optimizing strategies to minimise feed expenses has become an urgent priority. Among the macronutrients in aquafeeds, protein is recognised as the most crucial and costly component. High protein levels not only increase production costs but also contribute to environmental pollution through nitrogenous waste(Reference Li, Jiang and Liu1). Lipids, being energy-dense macronutrients, are efficiently metabolised by most fish species. As a result, high-fat diets (HFD) have gained popularity in modern aquaculture due to their lower cost, reduced nitrogenous emissions and protein-sparing effects(Reference Li, Jiang and Liu1–Reference Kong, Huang and Yang3). However, long-term use of HFD often leads to liver steatosis and triggers various physiological stresses, including oxidative stress, inflammatory responses, apoptosis and metabolic dysfunction(Reference Du, Clouet and Zheng4,Reference Ning, He and Lu5) . These conditions can compromise immune function(Reference Zhou, Rahimnejad and Lu6), reduce resistance to pathogens, increase mortality rates and impair growth performance(Reference Qian, Wang and Ren7). Liver dysfunction, in particular, can disrupt lipid metabolism, posing serious risks to fish health(Reference Matsuzaka and Shimano8). Consequently, functional additives are often employed in practical aquaculture to mitigate the detrimental effects associated with prolonged consumption of HFD.
Mitochondria play a pivotal role in cellular energy metabolism, and alterations in their structure and functionality are closely linked to the onset of metabolic disorders such as obesity and type 2 diabetes(Reference Fujimaki and Kuwabara9,Reference Wada and Nakatsuka10) . The liver, being one of the most mitochondria-rich organs, relies heavily on mitochondrial homeostasis to regulate lipid metabolism(Reference Degli Esposti, Hamelin and Bosselut11). Under conditions of overnutrition, particularly excessive fat intake, mitochondria become highly susceptible to metabolic stress(Reference James, Collins and Logan12), which can lead to abnormal lipid accumulation(Reference Neuschwander-Tetri13). Research in fish models has demonstrated that fatty liver disease is often associated with mitochondrial dysfunction(Reference Lu, Xu and Liu14–Reference Lu, Wang and Zhang16). Therefore, safeguarding mitochondrial integrity may represent a viable strategy for mitigating the development of nutrition-induced hepatic steatosis in fish.
Coenzyme Q10 (COQ10) is a lipid-soluble quinone compound found ubiquitously in most eukaryotic cells. It plays a critical role in scavenging free radicals and facilitating energy metabolism(Reference Perez-Sanchez, Ruiz-Limon and Aguirre17–Reference Fatima, Al-Mohaimeed and Al-Shaikh20). In mammals, COQ10 has been shown to alleviate non-alcoholic fatty liver disease and atherosclerosis by enhancing mitochondrial function(Reference Chen, Chen and Xue21–Reference Xie, Wang and Jin24). Similarly, research on European eels (Anguilla anguilla), Pacific white shrimp (Litopenaeus vannamei), rainbow trout (Oncorhynchus mykiss) and European seabass (Dicentrarchus labrax) revealed that COQ10 can significantly promote growth, regulate lipid metabolism and improve both antioxidant capacity and immune function(Reference Huang, Ge and Lou25–Reference El Basuini, Shahin and Eldenary28). These findings underscore the vast potential of COQ10 for applications in aquaculture.
Spotted seabass, the second most cultured marine fish in China(Reference Cai, Wang and Song29), is often subjected to HFD during breeding to promote rapid growth and yield. However, this long-term feeding approach can easily lead to lipid metabolism disorders, resulting in fatty liver, which severely compromises the health and quality of the fish and causes substantial economic losses for the aquaculture industry. Accordingly, developing strategies to mitigate nutritional fatty liver in spotted seabass is of significant economic importance. While COQ10 shows potential in modulating hepatic fat deposition in fish, its precise mechanisms of action remain unclear. Therefore, this study was designed to evaluate the effects of supplementing different doses of COQ10 in a HFD on growth, lipid metabolism and mitochondrial function in spotted seabass.
Materials and methods
Feed preparation
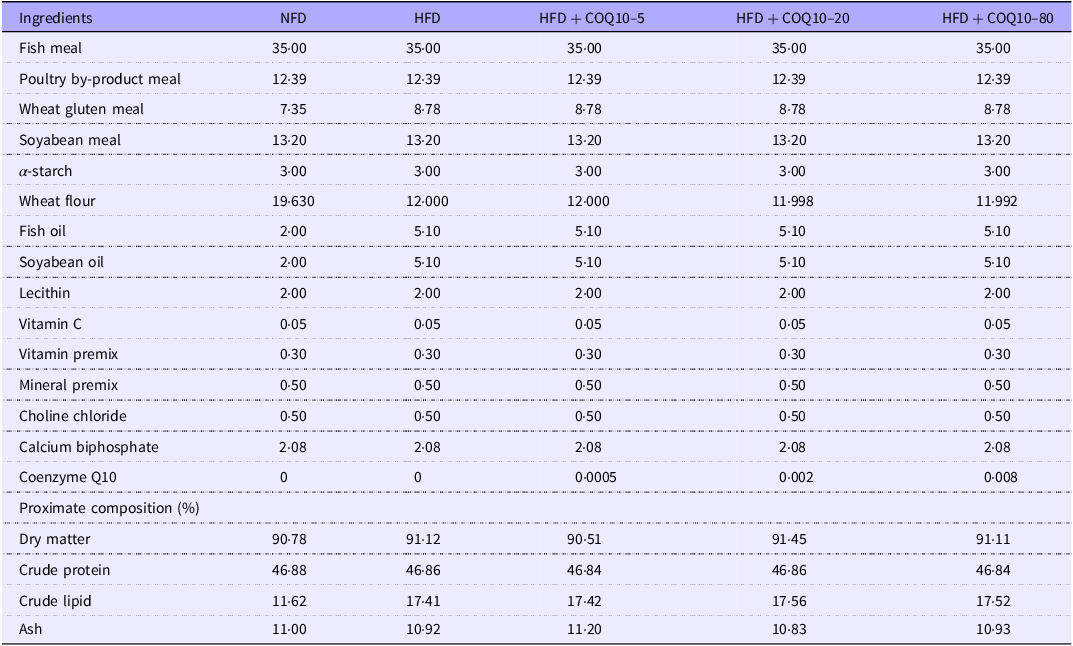
Fish meal, poultry by-product meal, soyabean meal and wheat gluten meal were used as the main protein sources, and fish oil, soyabean oil and lecithin were used as the main lipid sources. A diet containing 45 % protein, and 11 % fat was prepared and used as the normal fat diet (NFD), and a HFD was prepared with 17 % fat. Three additional diets were produced by supplementing the HFD with 5, 20 or 80 mg/kg of COQ10 (HFD + COQ10–5, HFD + COQ10–20 and HFD + COQ10–80 diets, respectively). The raw materials were thoroughly mixed using a sequential expansion mixing technique. COQ10 was precisely weighed in a dark environment and immediately mixed with fish oil, soyabean oil and lecithin through a gradient mixing process. The prepared mixture was subsequently incorporated into the pre-homogenised dry feed ingredients(Reference El Basuini, Teiba and Zaki30). After 15 min of mixing, 30 % water was added to the mixture. The dough was pelleted using a twin-screw extruder with a 2-mm diameter. To avoid degradation of COQ10, the pellets were dried in a dark, dry environment(Reference Yang and Song31) and then stored at −20°C until used. The formulation and proximate composition of the experimental diets are presented in Table 1, and their fatty acid composition is shown in Table 2.
Formulation and chemical composition of the experimental diets (% dry matter)

Vitamin premix (g or mg per kg diet): zoelite, 4·582 g; thiamine, 10 mg; riboflavin, 8 mg; pyridoxine HCl, 10 mg; vitamin B12, 0·2 mg, vitamin K3, 10 mg; inositol, 100 mg; pantothenic acid, 20 mg; niacin acid, 50 mg; folic acid, 2 mg; biotin, 2 mg; retinol acetate, 400 mg; cholecalciferol, 5 mg; alpha-Tocopherol, 100 mg; ethoxyquin, 150 mg; wheat middling, 1·1328 g.
Mineral premix (mg kg–1diet): NaF, 2 mg; KI, 0·8 mg; CoCl2·6H2O (1 %), 50 mg; CuSO4·5H2O, 10 mg; FeSO4·H2O, 80 mg; ZnSO4·H2O, 50 mg; MnSO4·H2O, 25 mg; MgSO4·7H2O, 200 mg.
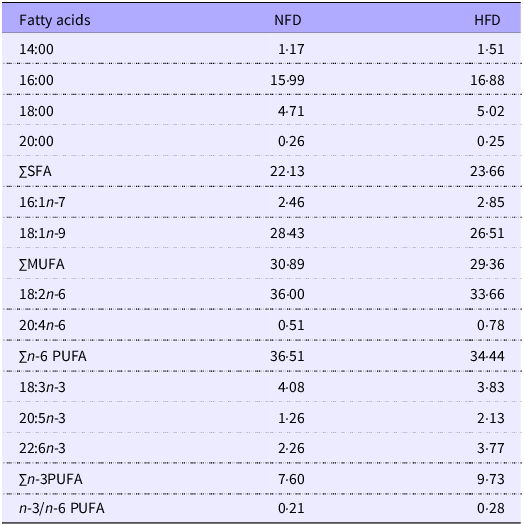
Fatty acid composition of feed (percentage of total fatty acids)

NFD, normal fat diet; HFD, high-fat diet.
Fish and experimental design
During the feeding period, all the procedures were conducted in accordance with the Committee on the Ethics of Animal Experiments of Jimei University, China (protocol code 2011-58, approved on 20 December 2011). The feeding trial was carried out at the experimental facility of the School of Fisheries of Jimei University (Xiamen, China). Spotted seabass juveniles were purchased from a commercial hatchery in Zhangzhou (Fujian province, China). The feeding trial was conducted in a recirculating aquaculture system. Prior to the start of the trial, the fish were temporarily housed in a 1000-L tank and fed a commercial diet for 2 weeks. Then, 300 healthy and uniform fish (12·00 ± 0·1 g) were randomly assigned to 15 tanks (200-L capacity each) connected to the recirculating aquaculture system, with twenty fish per tank. According to the principle of experimental randomness, the fifteen tanks were randomly divided into five groups, with three replicates per group(Reference Cai, Wang and Song29). During the experiment, water temperature was maintained at 27·0 ± 0·5°C, dissolved oxygen at 6·0 ± 1·0 mg/l and pH at 7·4 ± 0·2. Following stocking and acclimatisation, experimental diets were fed to spotted seabass twice daily (08.00 and 16.00 h) for 8 weeks, with each feeding lasting approximately 1 h until the fish reached apparent satiation.
Sampling
At the conclusion of the feeding trial, all fish were subjected to a 24-h fasting before being individually weighed. Subsequently, ten fish per tank were randomly selected and anesthetised with 100 mg/l of MS-222. Blood samples were drawn from the caudal vein using non-heparinised syringes and centrifuged at 3500 rpm for 10 min to separate the serum, which was then aliquoted and stored at −80°C for later analyses. Following blood collection, the same ten fish were promptly dissected to obtain their visceral mass, which was weighed. The liver and abdominal fat were individually excised, weighed and recorded. Liver tissues from these ten fish were flash-frozen in liquid nitrogen and transferred to a −80°C freezer for molecular analyses. Additionally, liver samples from two additional fish per tank were sectioned into 5 mm3 fragments and fixed in 4 % paraformaldehyde for histological examination.
Proximate and fatty acid composition analyses
The proximate composition of whole-body, muscle and diet samples was analysed following standardised protocols established by the American Association of Official Analytical Chemists(Reference Lu, Cai and Wang32). Moisture content was determined by oven-drying at 105°C to a constant weight, crude fat content by the Soxhlet extraction method using ether as extraction solvent and ash content by the combustion method, where samples were incinerated in a muffle furnace at 550°C for 8 h. Crude protein content was determined using an 828 Series Hydrocarbon/Nitrogen analyser (LECO, St. Joseph, Michigan, USA).
Fatty acids in the diets and whole-body samples were extracted using the hydrolysis method outlined in GB5009·168-2016, the ‘National Food Safety Standard for the Determination of Fatty Acids in Food’. Briefly, the freeze-dried samples (1 g) were placed into a 10-ml volumetric flask, followed by the sequential addition of 2·5 ml each of petroleum ether and benzene. After thorough mixing and standing for 2 h, 0·5 ml of 2 mol/l potassium hydroxide methanol solution was added, and the sample was allowed to stand for an additional 30 min. A saturated sodium chloride solution was added until it reached 1 cm from the top of the flask, and the sample was left to stand until the supernatant became clear. The supernatant was then filtered through a 0·22-µm organic membrane and analysed using a Shimadzu gas chromatograph (GC2010). Fatty acids were quantified, and the relative percentage content of each fatty acid was calculated using the area normalisation method.
Serum and liver biochemical parameters
Serum aspartate aminotransferase (A010-2-1, AST) and alanine aminotransferase (C009-2-1, ALT) activities were quantified using commercial assay kits (Nanjing Jiancheng Bioengineering Institute, Nanjing, China). Additionally, the concentrations of TAG (A110-1-1) and total cholesterol (A111-1-1, T-CHO) in both serum and liver samples as well as liver-free fatty acids (A042-2-1, NEFA) were determined using corresponding commercial kits from the same manufacturer. For the evaluation of oxidative stress markers, liver superoxide dismutase (A001-3-2, SOD), catalase (A007-1-1, CAT) and glutathione peroxidase (A005-1-2, GPX) activities were measured, along with the malondialdehyde (A003-1-2, MDA) concentration, utilizing validated kits (Nanjing Jiancheng Bioengineering Institute, Nanjing, China).
Liver citrate synthase (A108-1-2, CS), malate dehydrogenase (A021-2-1, MDH) and coenzyme I (A114-1-1, NADH/NAD+) levels were measured using commercially available kits from Nanjing Jiancheng Bioengineering Institute (Nanjing, China). Additionally, liver succinate dehydrogenase (BC0955, SDH) activity was assessed using a kit from Beijing Soleibao Technology Co., Ltd. (Beijing, China), while hepatic ATP content (S0027, ATP) was quantified with a Beyotime kit (Beyotime Biotechnology, Shanghai, China). These biomarkers were employed to comprehensively evaluate alterations in hepatic mitochondrial function.
Liver histology
Liver tissues fixed in 4 % paraformaldehyde for over 24 h were removed and subsequently dehydrated in a 20 % (w/v) sucrose solution. The samples were then embedded in an optimal cutting temperature compound (G6059, Servicebio) for cryosectioning. Cryosections were prepared using a cryostat (CRYOSTAR NX50, Thermo Scientific) maintained at −20°C. Lipid droplets were visualised using Oil Red O staining solution (G1015, Servicebio), while nuclei were counterstained with haematoxylin solution (G1004, Servicebio). Stained sections were examined under a Leica DM5500 B optical microscope.
Gene expression
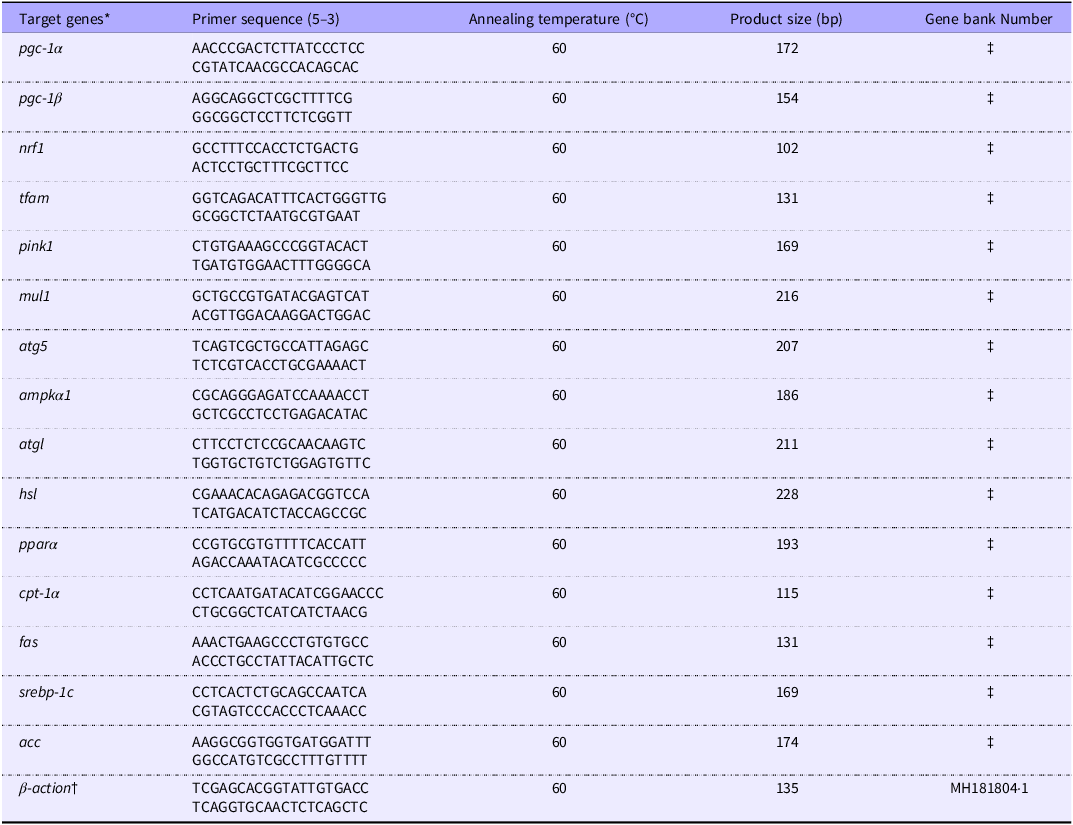
Total RNA was extracted using a commercial RNA isolation kit (RC101-01, Vazyme Biotech Co., Ltd., Nanjing, China) following the manufacturer’s instructions. To eliminate any residual genomic DNA, RNA samples were treated with DNase. The purity and integrity of the RNA were assessed as described in our previous study(Reference Dong, Xia and Lin33). Complementary DNA was synthesised from 0·5 µg of RNA using a complementary DNA synthesis kit (R211-01, Vazyme Biotech Co., Ltd., Nanjing, China), adhering to the manufacturer’s guidelines. The resulting complementary DNA was utilised for the quantification of mRNA expression levels via quantitative real-time PCR, following the protocols established in our earlier work(Reference Dong, Xia and Lin33). Gene expression levels were normalised and analysed using the 2−ΔΔCt method. The specific primers used for quantitative real-time PCR are listed in Table 3.
Sequences of primers used for RT-PCR

Pgc1α/β: Peroxisome proliferators activated receptor γ coactivator-1 α/β; nrf1: Nuclear respiratory factor 1; tfam: Mitochondrial transcription factor A; pink1: PTEN-induced putative kinase 1; mul1:mitochondrial E3 ubiquitin ligase 1b; atg5: autophagy protein 5; ampkα1:AMP-activated protein kinase; atgl: triglyceride lipase; hsl: Hormone sensitive lipase; pparα: peroxisome proliferator-activated receptors;cpt-1α: Carnitine palmitoyltransferase-1; fas: fatty acid aynthase; srebp-1c: sterol regulatory element binding protein-1c; acc: acetyl coA carboxylase.
* The sequences of target genes were obtained from transcriptomic data in our previous study(Reference El Basuini, Shahin and Eldenary28).
† Reference gene.
‡ According to the transcriptome data in our previous study.
Statistical analysis
Data were subjected to statistical analysis using ANOVA in the SPSS 20 software package. Prior to conducting statistical comparisons, the Kolmogorov–Smirnov test was employed to assess the normality of the data distribution, and Levene’s test was used to verify the homogeneity of variance across groups. Post hoc multiple comparisons between treatment groups were performed using Duncan’s multiple range test. Statistical significance was determined at a threshold of P < 0·05. Results are expressed as mean values ± standard error (se).
Results
Growth and whole-body composition
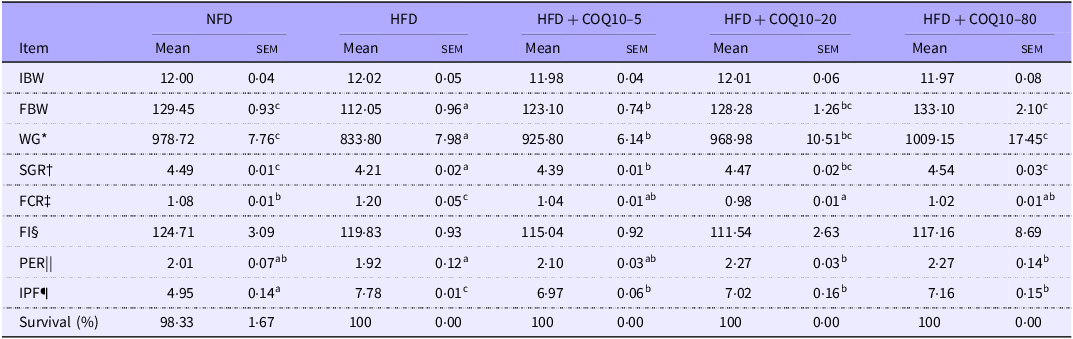
The group fed HFD exhibited significantly lower weight gain, final body weight and specific growth rate than those fed the NFD (Table 4) (P = 0·001). The addition of COQ10 to the HFD significantly improved weight gain, final body weight and specific growth rate, with the highest values obtained for the HFD + COQ10–80 group (P = 0·001). Additionally, the HFD + COQ10–20 and HFD + COQ10–80 groups demonstrated higher protein efficiency ratios than the HFD group (P = 0·03). In contrast to the NFD group, the feed conversion ratio was markedly elevated in the HFD group; however, supplementation with COQ10 resulted in a significant reduction in feed conversion ratio, with the HFD + COQ10–20 group exhibiting the lowest feed conversion ratio of all treatments (P = 0·01). Furthermore, the intraperitoneal fat ratio in the HFD group was nearly double that of the NFD group, while COQ10 supplementation significantly decreased intraperitoneal fat ratio values (P = 0·001).
Growth, feed utilisation and survival of spotted seabass fed the experimental diets for 8 weeks (Mean values with their standard error of the means)

Values are presented as mean ± sem. The values with different superscript letters in the same row are significantly different (P < 0·05). HFD, high-fat diet; FBW, final body weight; COQ10, coenzyme Q10; NFD, normal fat diet; WG, weight gain; SGR, specific growth rate; FCR, feed conversion ratio; PER, protein efficiency ratio; IPF, intraperitoneal fat ratio.
* Weight gain (%) = [(Final body weight – initial body weight)/initial body weight] × 100.
† Specific growth rate (%/d) = [(Ln final body weight – Ln initial body weight)/days] × 100.
‡ Feed conversion ratio = dry feed fed/wet weight gain.
§ Feed intake (g/fish) = feed consumed/number of experimental fish.
|| Protein efficiency ratio = wet weight gain/total protein given.
¶ Intraperitoneal fat ratio (%) = final intraperitoneal fat/body weight.
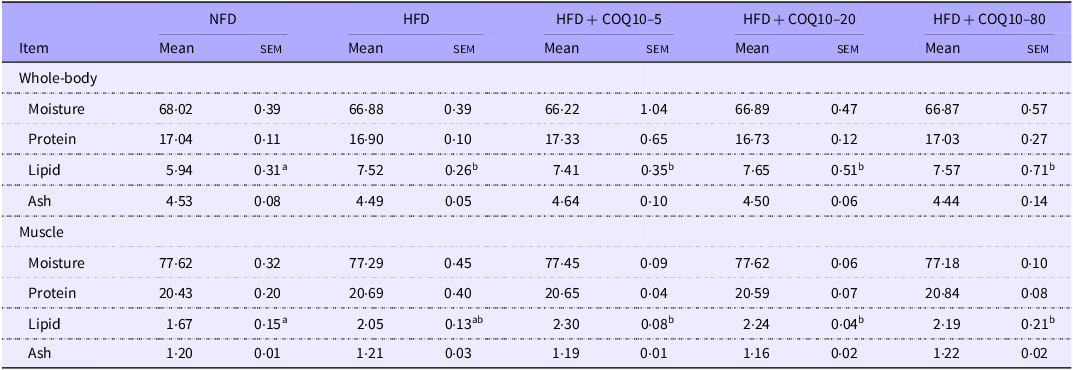
Fish whole-body fat content showed a marked increase in the HFD group relative to the NFD group (P = 0·033); however, supplementation with COQ10 did not result in any significant alterations (Table 5) (P = 0·372). Muscle lipid content, on the other hand, was significantly increased in the COQ10-supplemented groups compared with the NFD group (Table 5) (P = 0·02). Despite these changes in lipid deposition, no significant variations were observed in the protein, moisture or ash contents of either whole-body or muscle tissue across the experimental groups (P = 0·38).
Whole-body and muscle composition of spotted seabass fed the experimental diets for 8 weeks (% wet weight) (Mean values with their standard error of the means)

Values are presented as mean ± sem. The values with different superscript letters in the same row are significantly different (P < 0·05). NFD, normal fat diet; HFD, high-fat diet; COQ10, coenzyme Q10.
Whole-body fatty acid profile
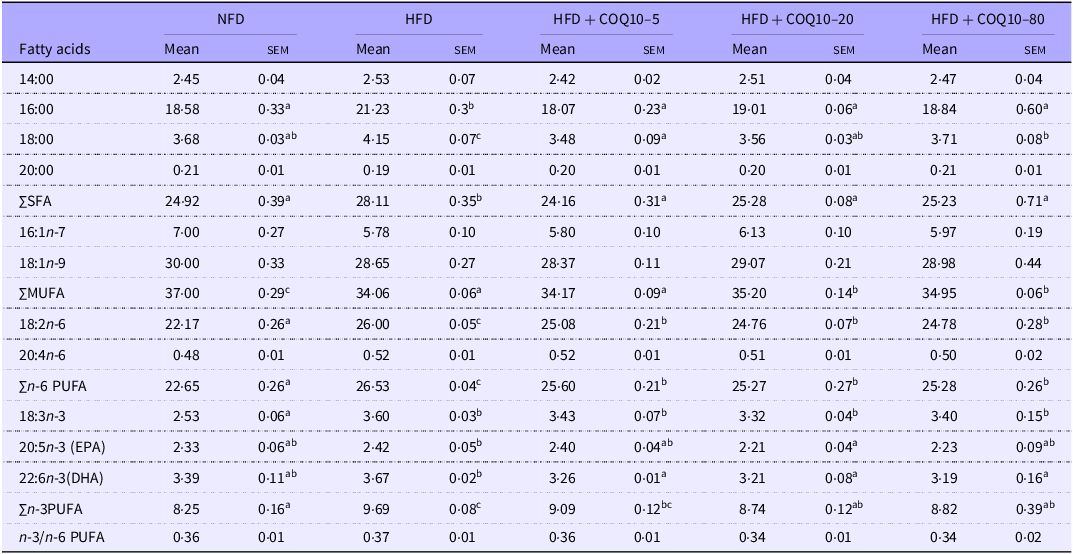
As presented in Table 6, the HFD group exhibited a significant increase in the ratios of SFA, palmitic acid (C:16) and stearic acid (C:18), compared with the NFD group, while the proportion of MUFA significantly decreased (P = 0·001). However, supplementation with COQ10 effectively reversed these trends. Moreover, the HFD group showed a marked increase in the ratios of n-6 PUFA, specifically linoleic acid (C18:2n-6), as well as n-3 PUFA and α-linolenic acid (C18:3n-3) (P =0·001). Notably, supplementation with 20–80 mg/kg COQ10 resulted in a significant reduction in the levels of n-6 PUFA, n-3 PUFA, α-linolenic acid and the long-chain n-3 PUFA such as eicosapentaenoic acid (EPA) (C20:5n-3) and docosahexaenoic acid (DHA) (C22:6n-3) (P =0·012).
Whole-body fatty acid profile of spotted bass (percentage of total fatty acids) fed the experimental diets for 8 weeks (Mean values with their standard error of the means)

Values are presented as mean ± sem. The values with different superscript letters in the same row are significantly different (P < 0·05). HFD, high-fat diet; COQ10, coenzyme Q10.
Serum and liver biochemical parameters
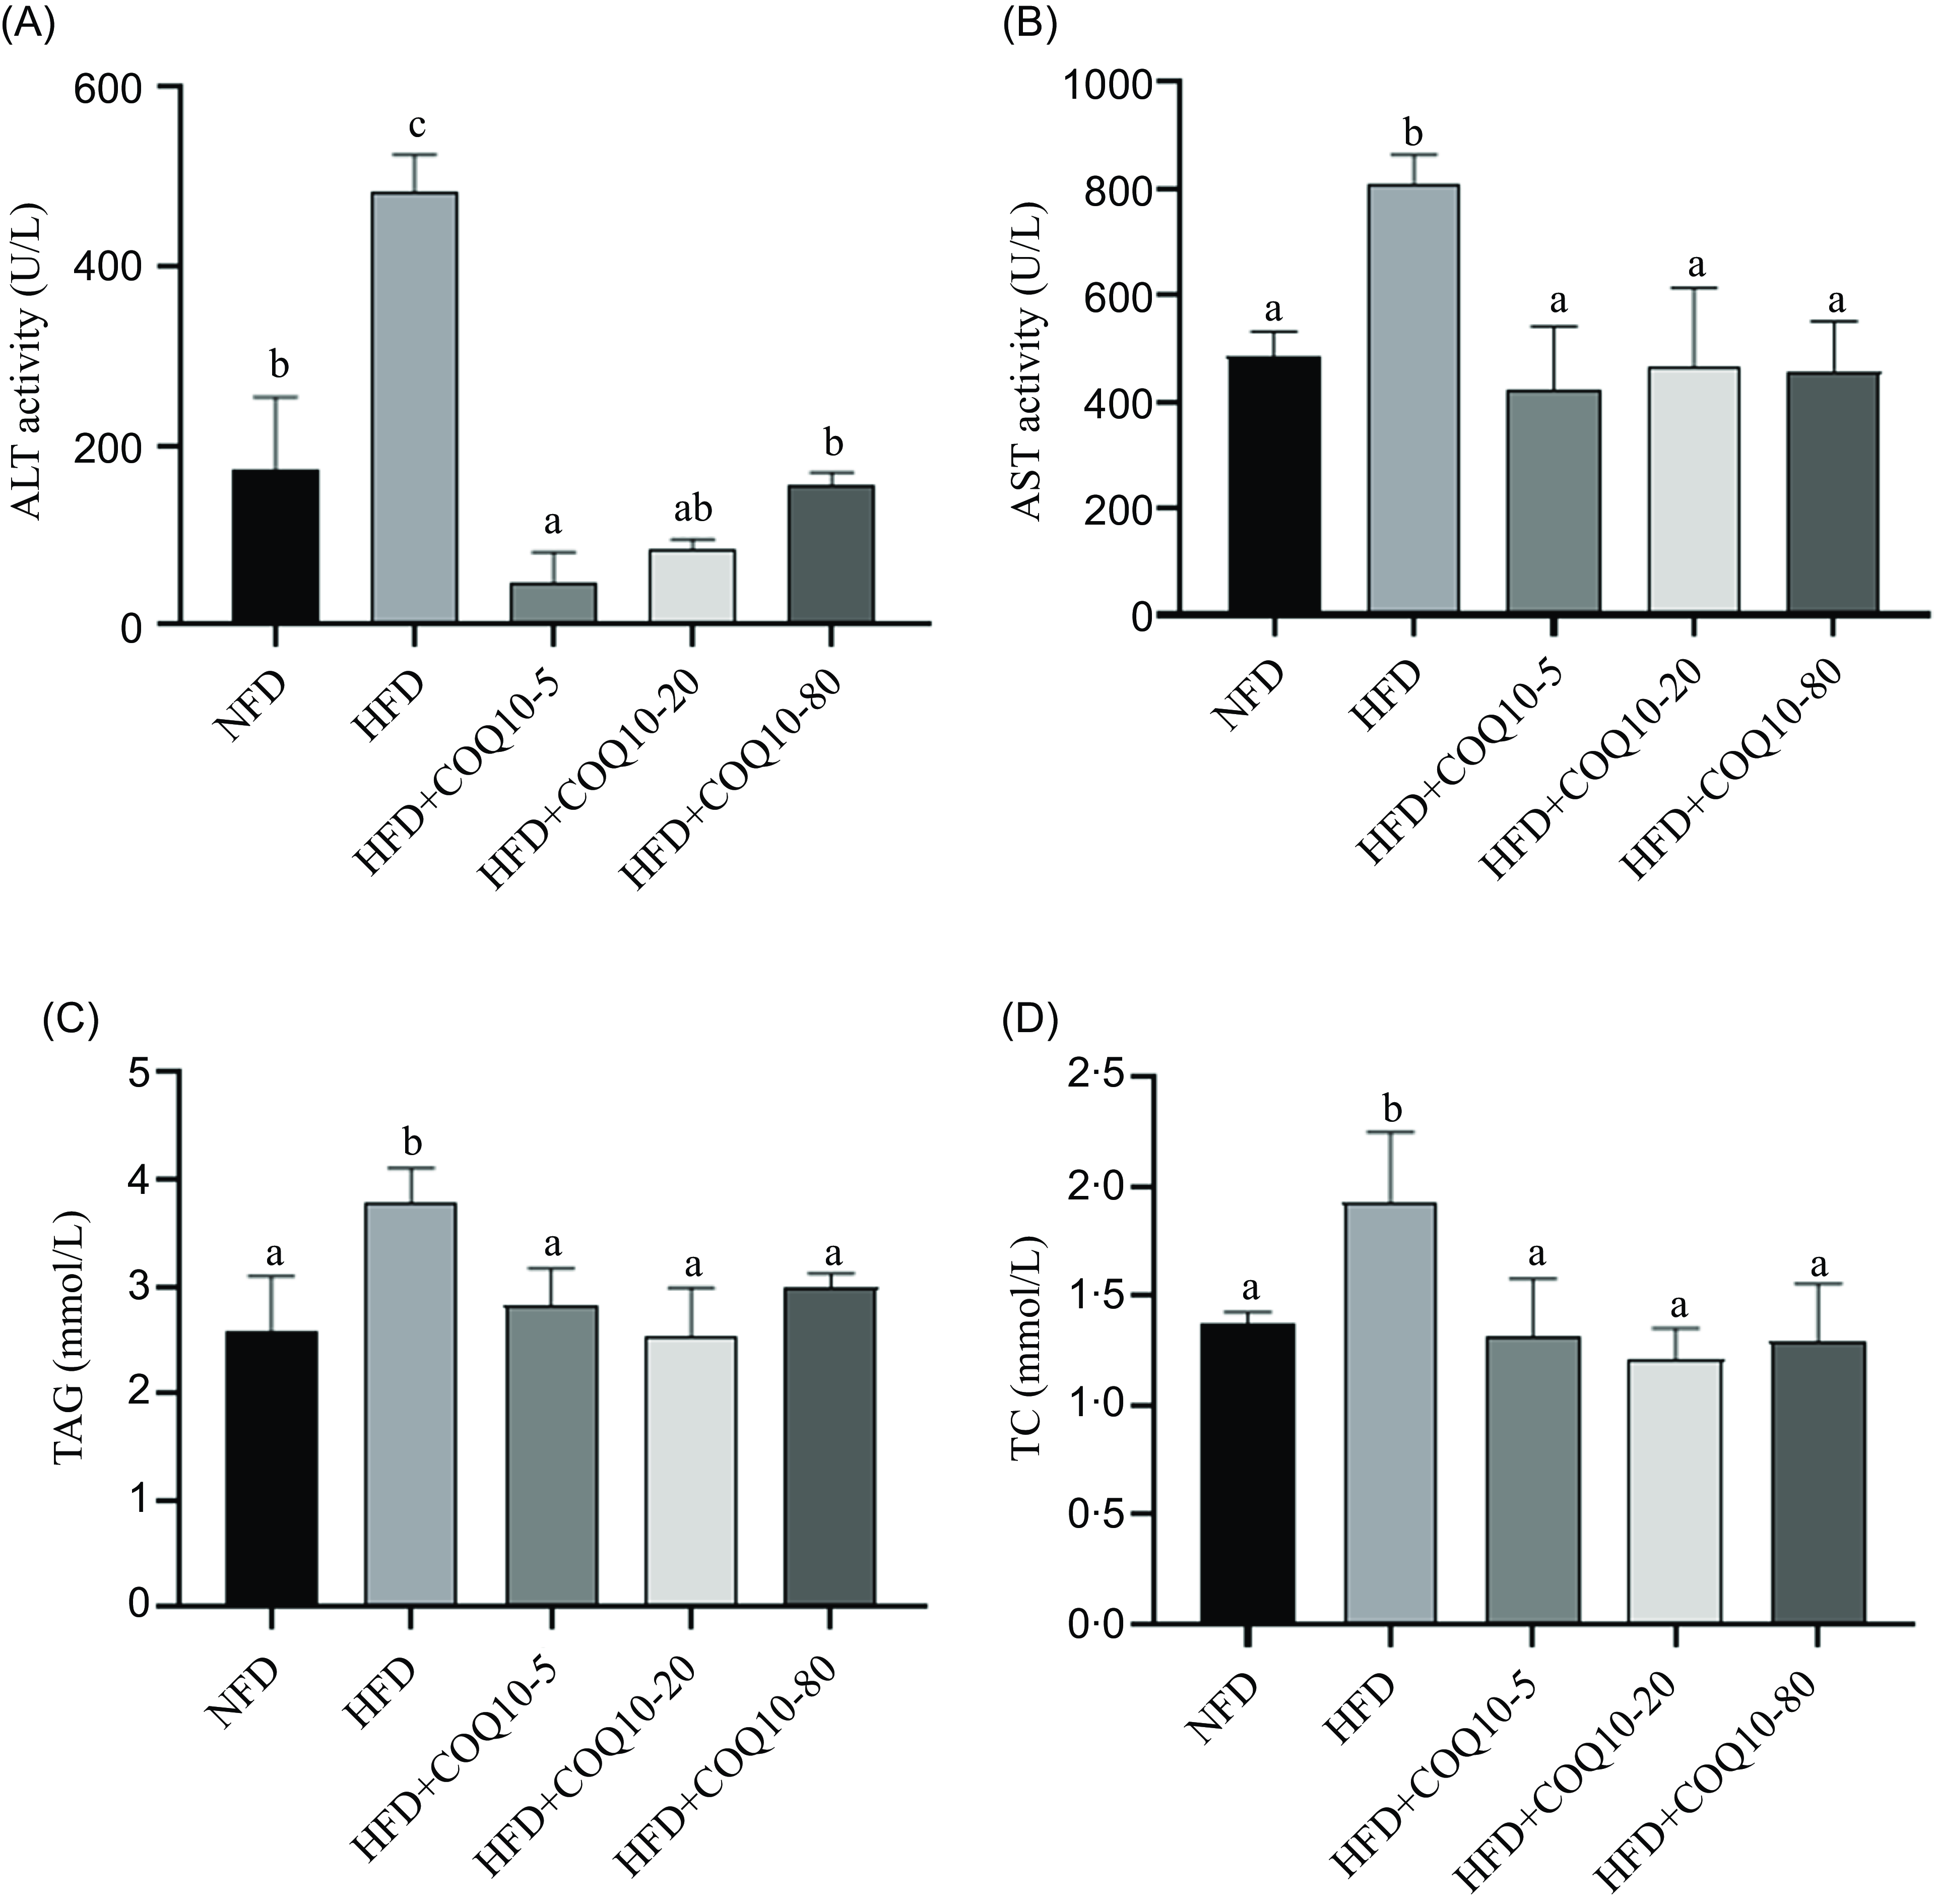
Serum AST and ALT activities significantly increased in HFD group compared with the NFD group (P = 0·001). However, COQ10 supplementation in the HFD resulted in a substantial reduction in the activities of both enzymes (Figure 1(a) and (b)) (P = 0·001). Furthermore, the HFD group exhibited remarkably higher concentrations of serum TAG and T-CHO compared with the other dietary treatments (P = 0·02), in addition, there were no significant differences in serum TAG and T-CHO levels between the NFD group and the COQ10 groups (P = 0·166) (Figure 1(c) and (d)).
Serum biochemical parameters of spotted seabass fed the experimental diets for 8 weeks (a) alanine aminotransferase activity (ALT), (b) aspartate aminotransferase activity (AST), (c) TAG level and (d) total cholesterol level (TC). All values are shown as mean ± se. Bars with different letters are significantly different (P < 0·05).

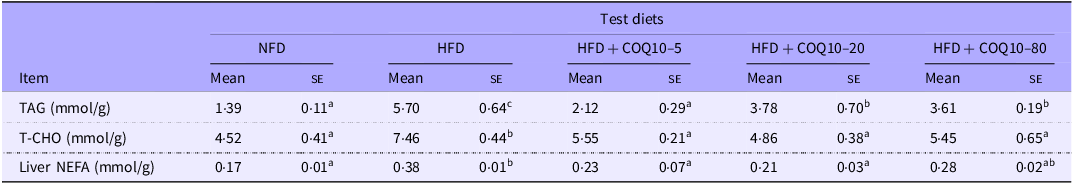
Similarly, in comparison to the NFD group, HFD feeding resulted in a significant accumulation of TAG, T-CHO and NEFA in the liver (P = 0·001). However, supplementation with COQ10 effectively attenuated these hepatic lipid elevations, significantly reducing the concentrations of TAG, T-CHO and NEFA (P = 0·002). Notably, the levels of T-CHO and NEFA in the COQ10-supplemented groups were comparable to those observed in the NFD group (Table 7) (P = 0·326), indicating a normalisation of lipid metabolism.
TAG, total cholesterol (TC) and non-esterified free fatty acids (NEFA) concentrations in liver of spotted seabass fed the experimental diets for 8 weeks (Mean values with their standard errors)

Values are shown as mean ± se. The values with different superscript letters in the same row are significantly different (P < 0·05). HFD, high-fat diet; COQ10, coenzyme Q10.
Liver fat metabolism-related enzymes activity
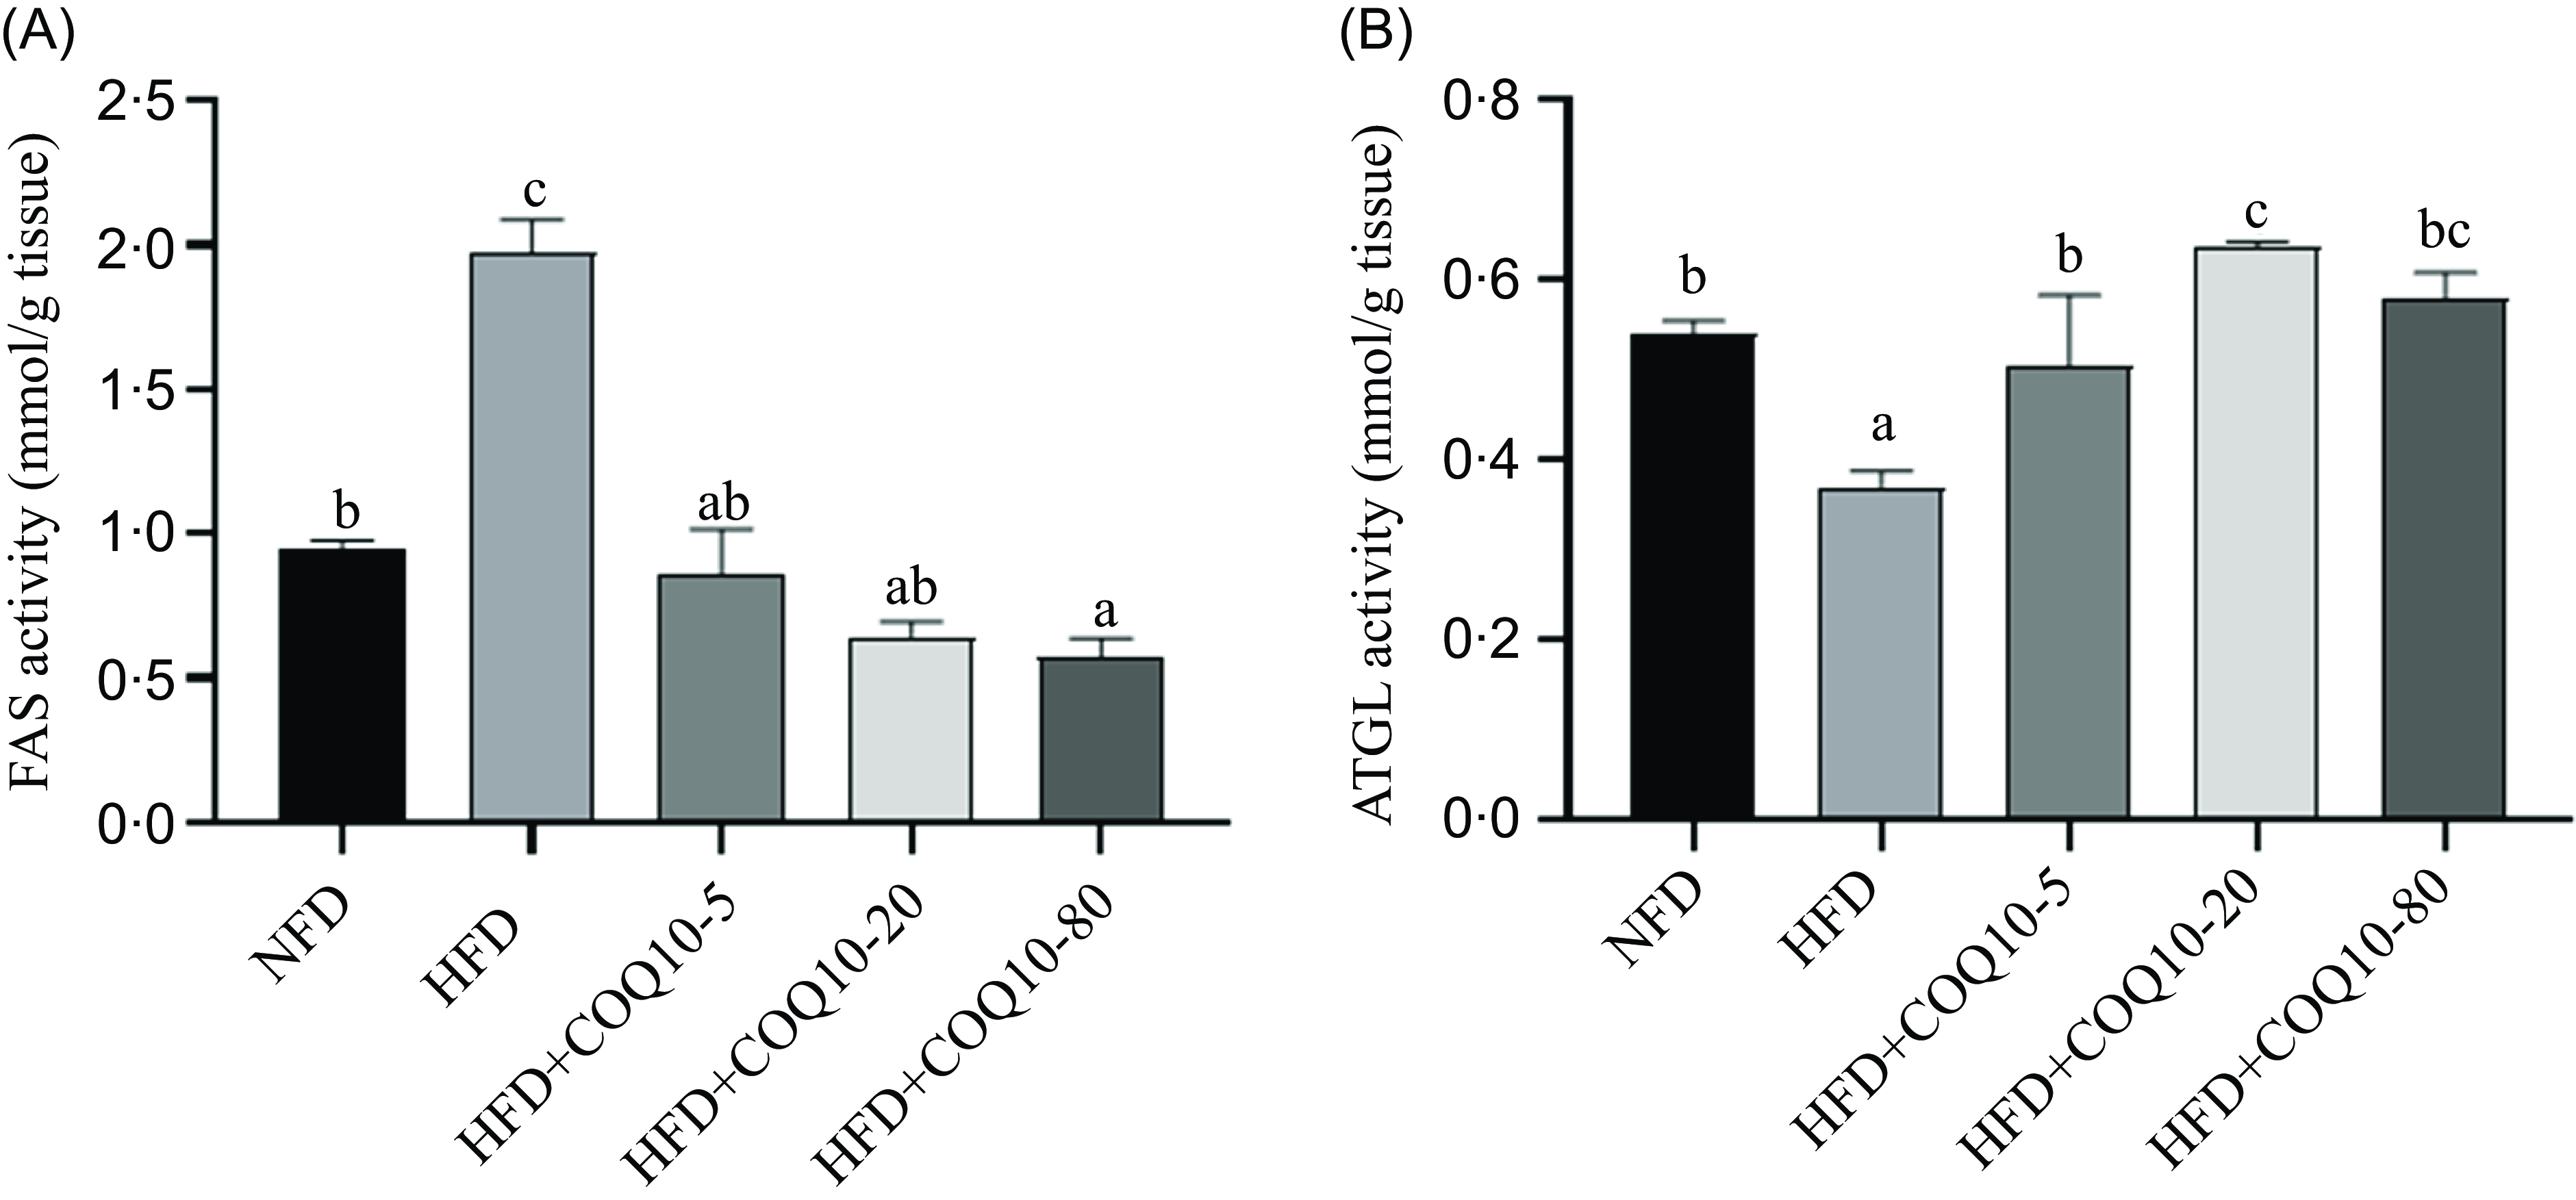
As shown in Figure 2(a) and (b), compared with the NFD group, the liver fatty acid synthase activity in the HFD group was significantly increased, and its activity was decreased in a dose-dependent manner by COQ10 supplementation (P = 0·001). On the contrary, the activity of adipose TAG lipase (ATGL) was significantly decreased in HFD, but the activity of ATGL was significantly restored by the addition of COQ10 (P = 0·006).
Liver fat metabolism-related enzymes activity in spotted seabass fed the experimental diets for 8 weeks (a) fatty acid synthase activity (FAS), (b) TAG lipase activity (ATGL). All values are shown as mean ± se. Bars with different letters are significantly different (P < 0·05).

Liver histology
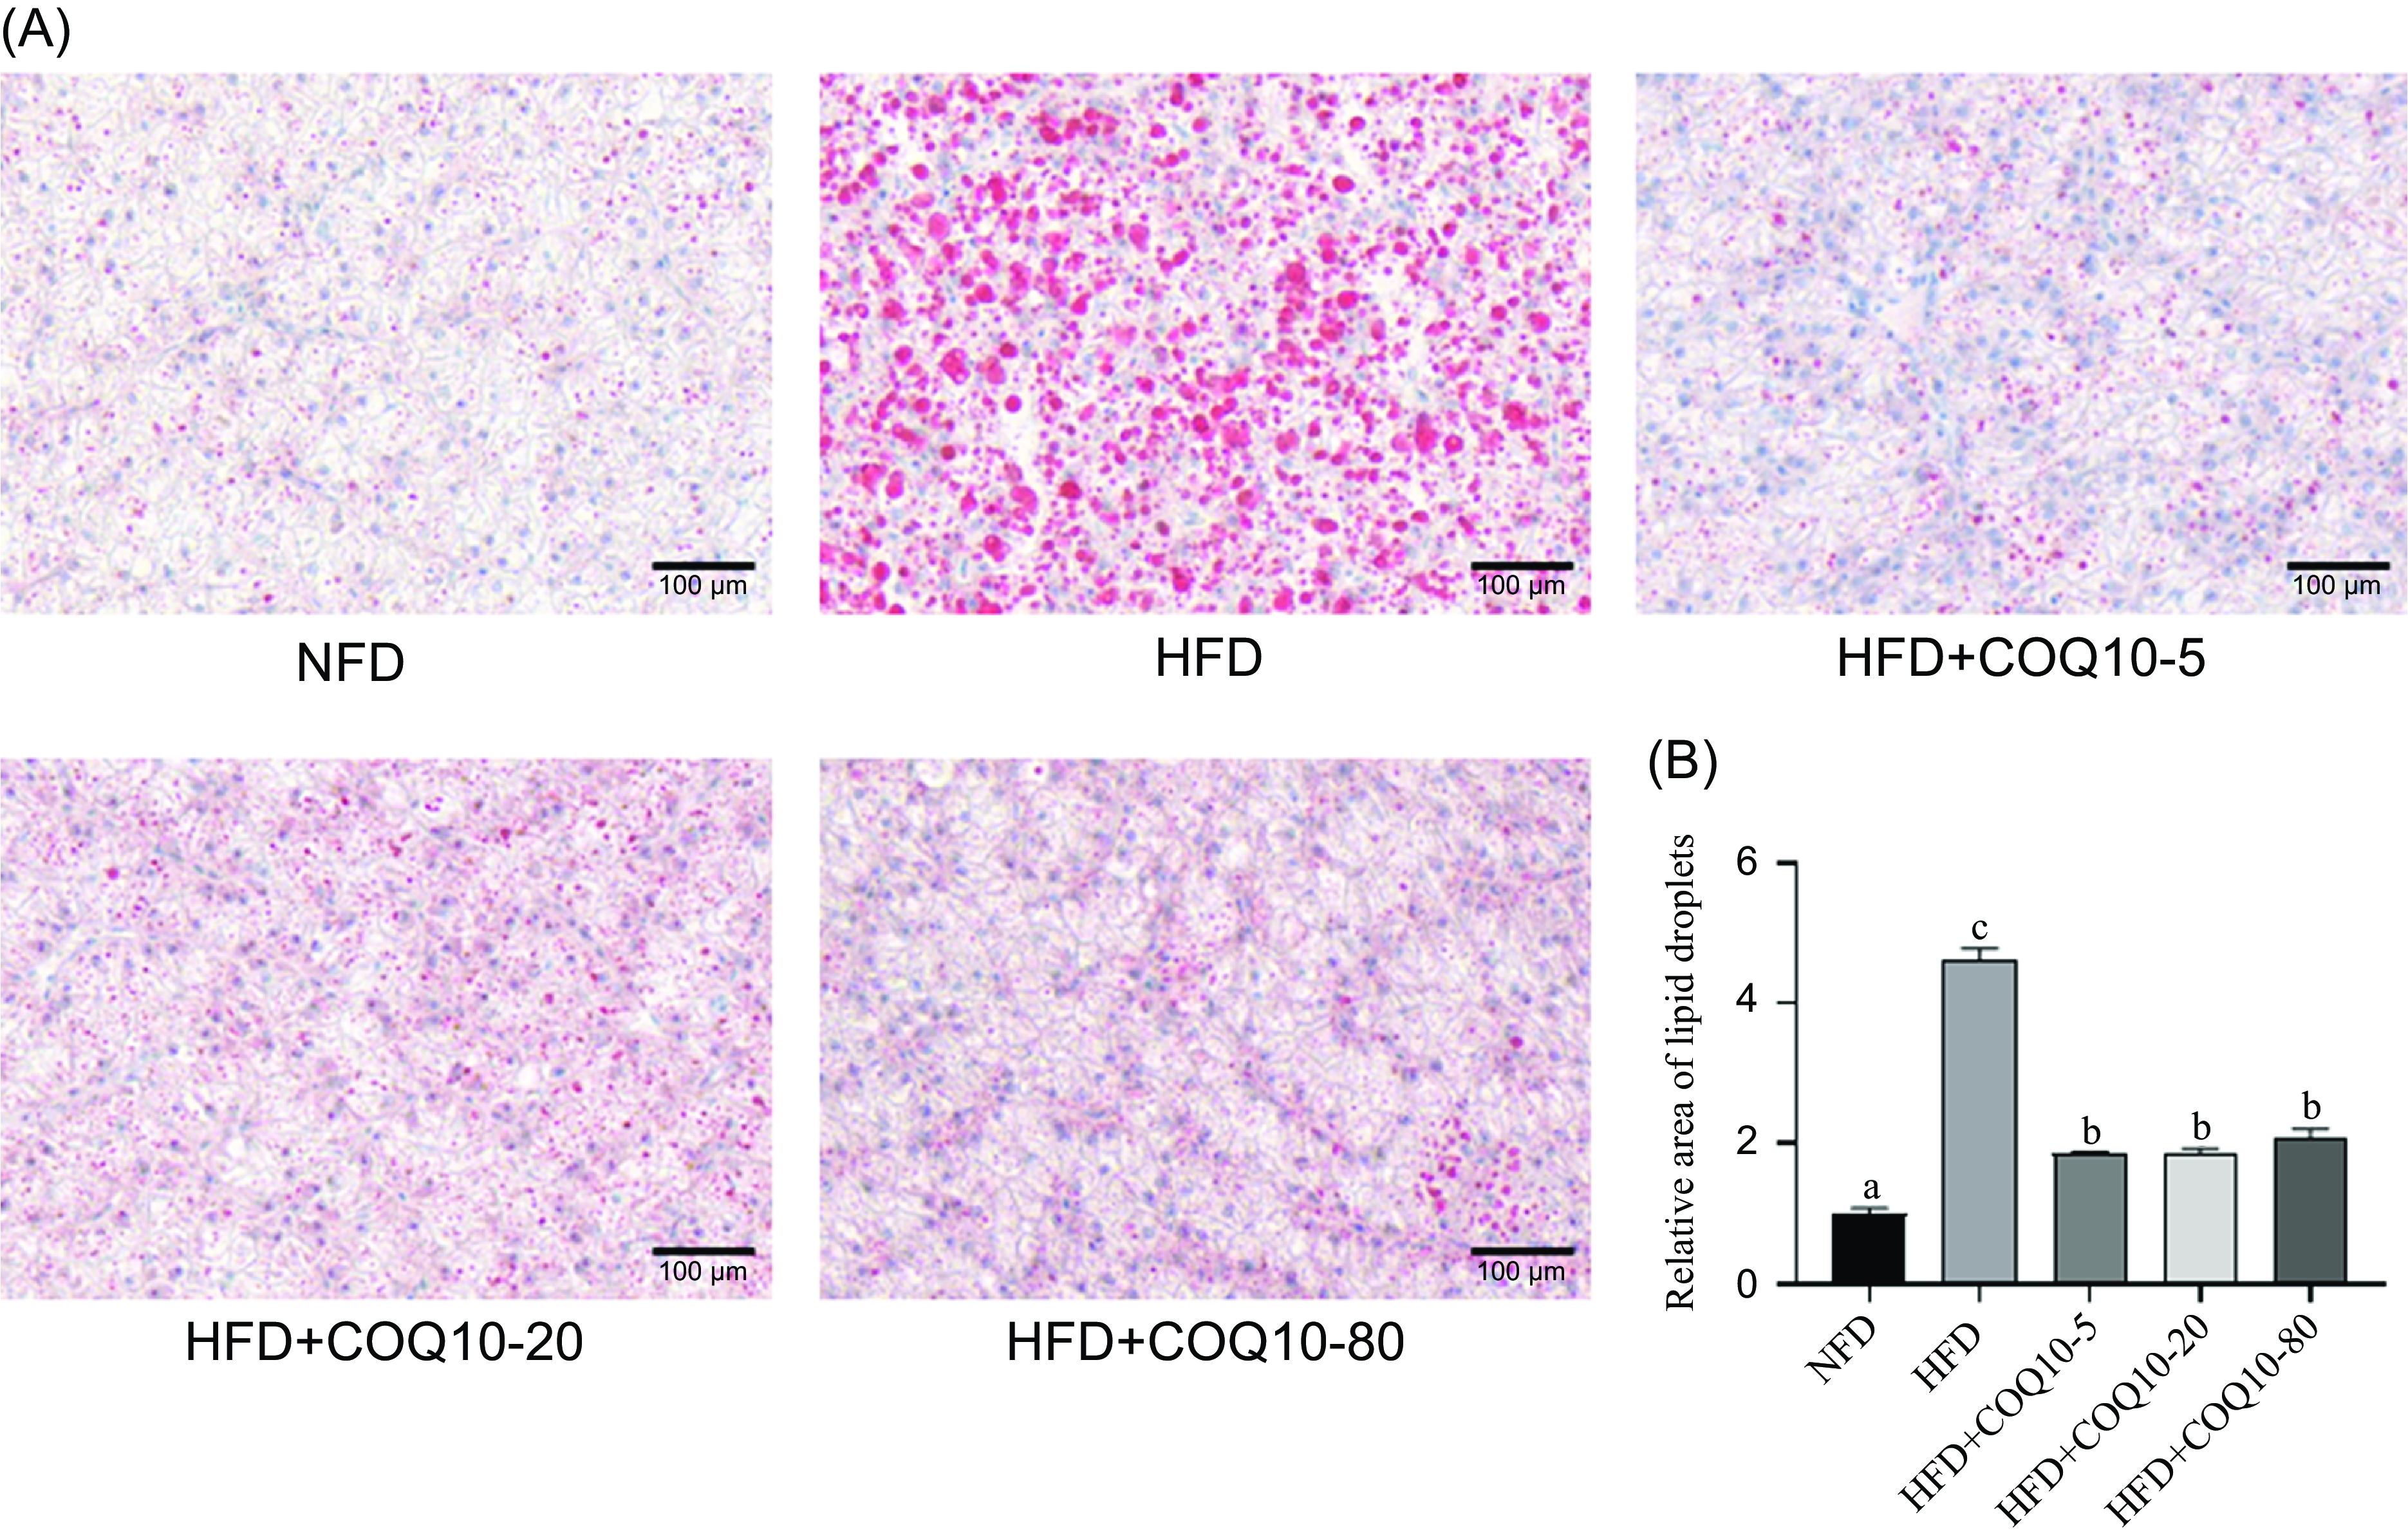
As illustrated in Figure 3(a), oil red O staining of the liver revealed a marked accumulation of lipid droplets in the HFD group compared with the NFD group, indicating substantial hepatic lipid deposition. However, supplementation with COQ10 clearly alleviated fat accumulation in the liver. The quantification of lipid droplets was performed using ImageJ software, and the results are presented in Figure 3(b). The analysis demonstrated a significant increase in lipid droplets area in the HFD group relative to the NFD group (P = 0·01), whereas COQ10 supplementation led to a pronounced, dose-dependent reduction in lipid droplets area across all treatment groups (P = 0·01), underscoring its protective effect against hepatic steatosis.
Liver histology (oil red O staining, scale = 100 μm) of spotted seabass fed the experimental diets for 8 weeks.

Liver antioxidant capacity
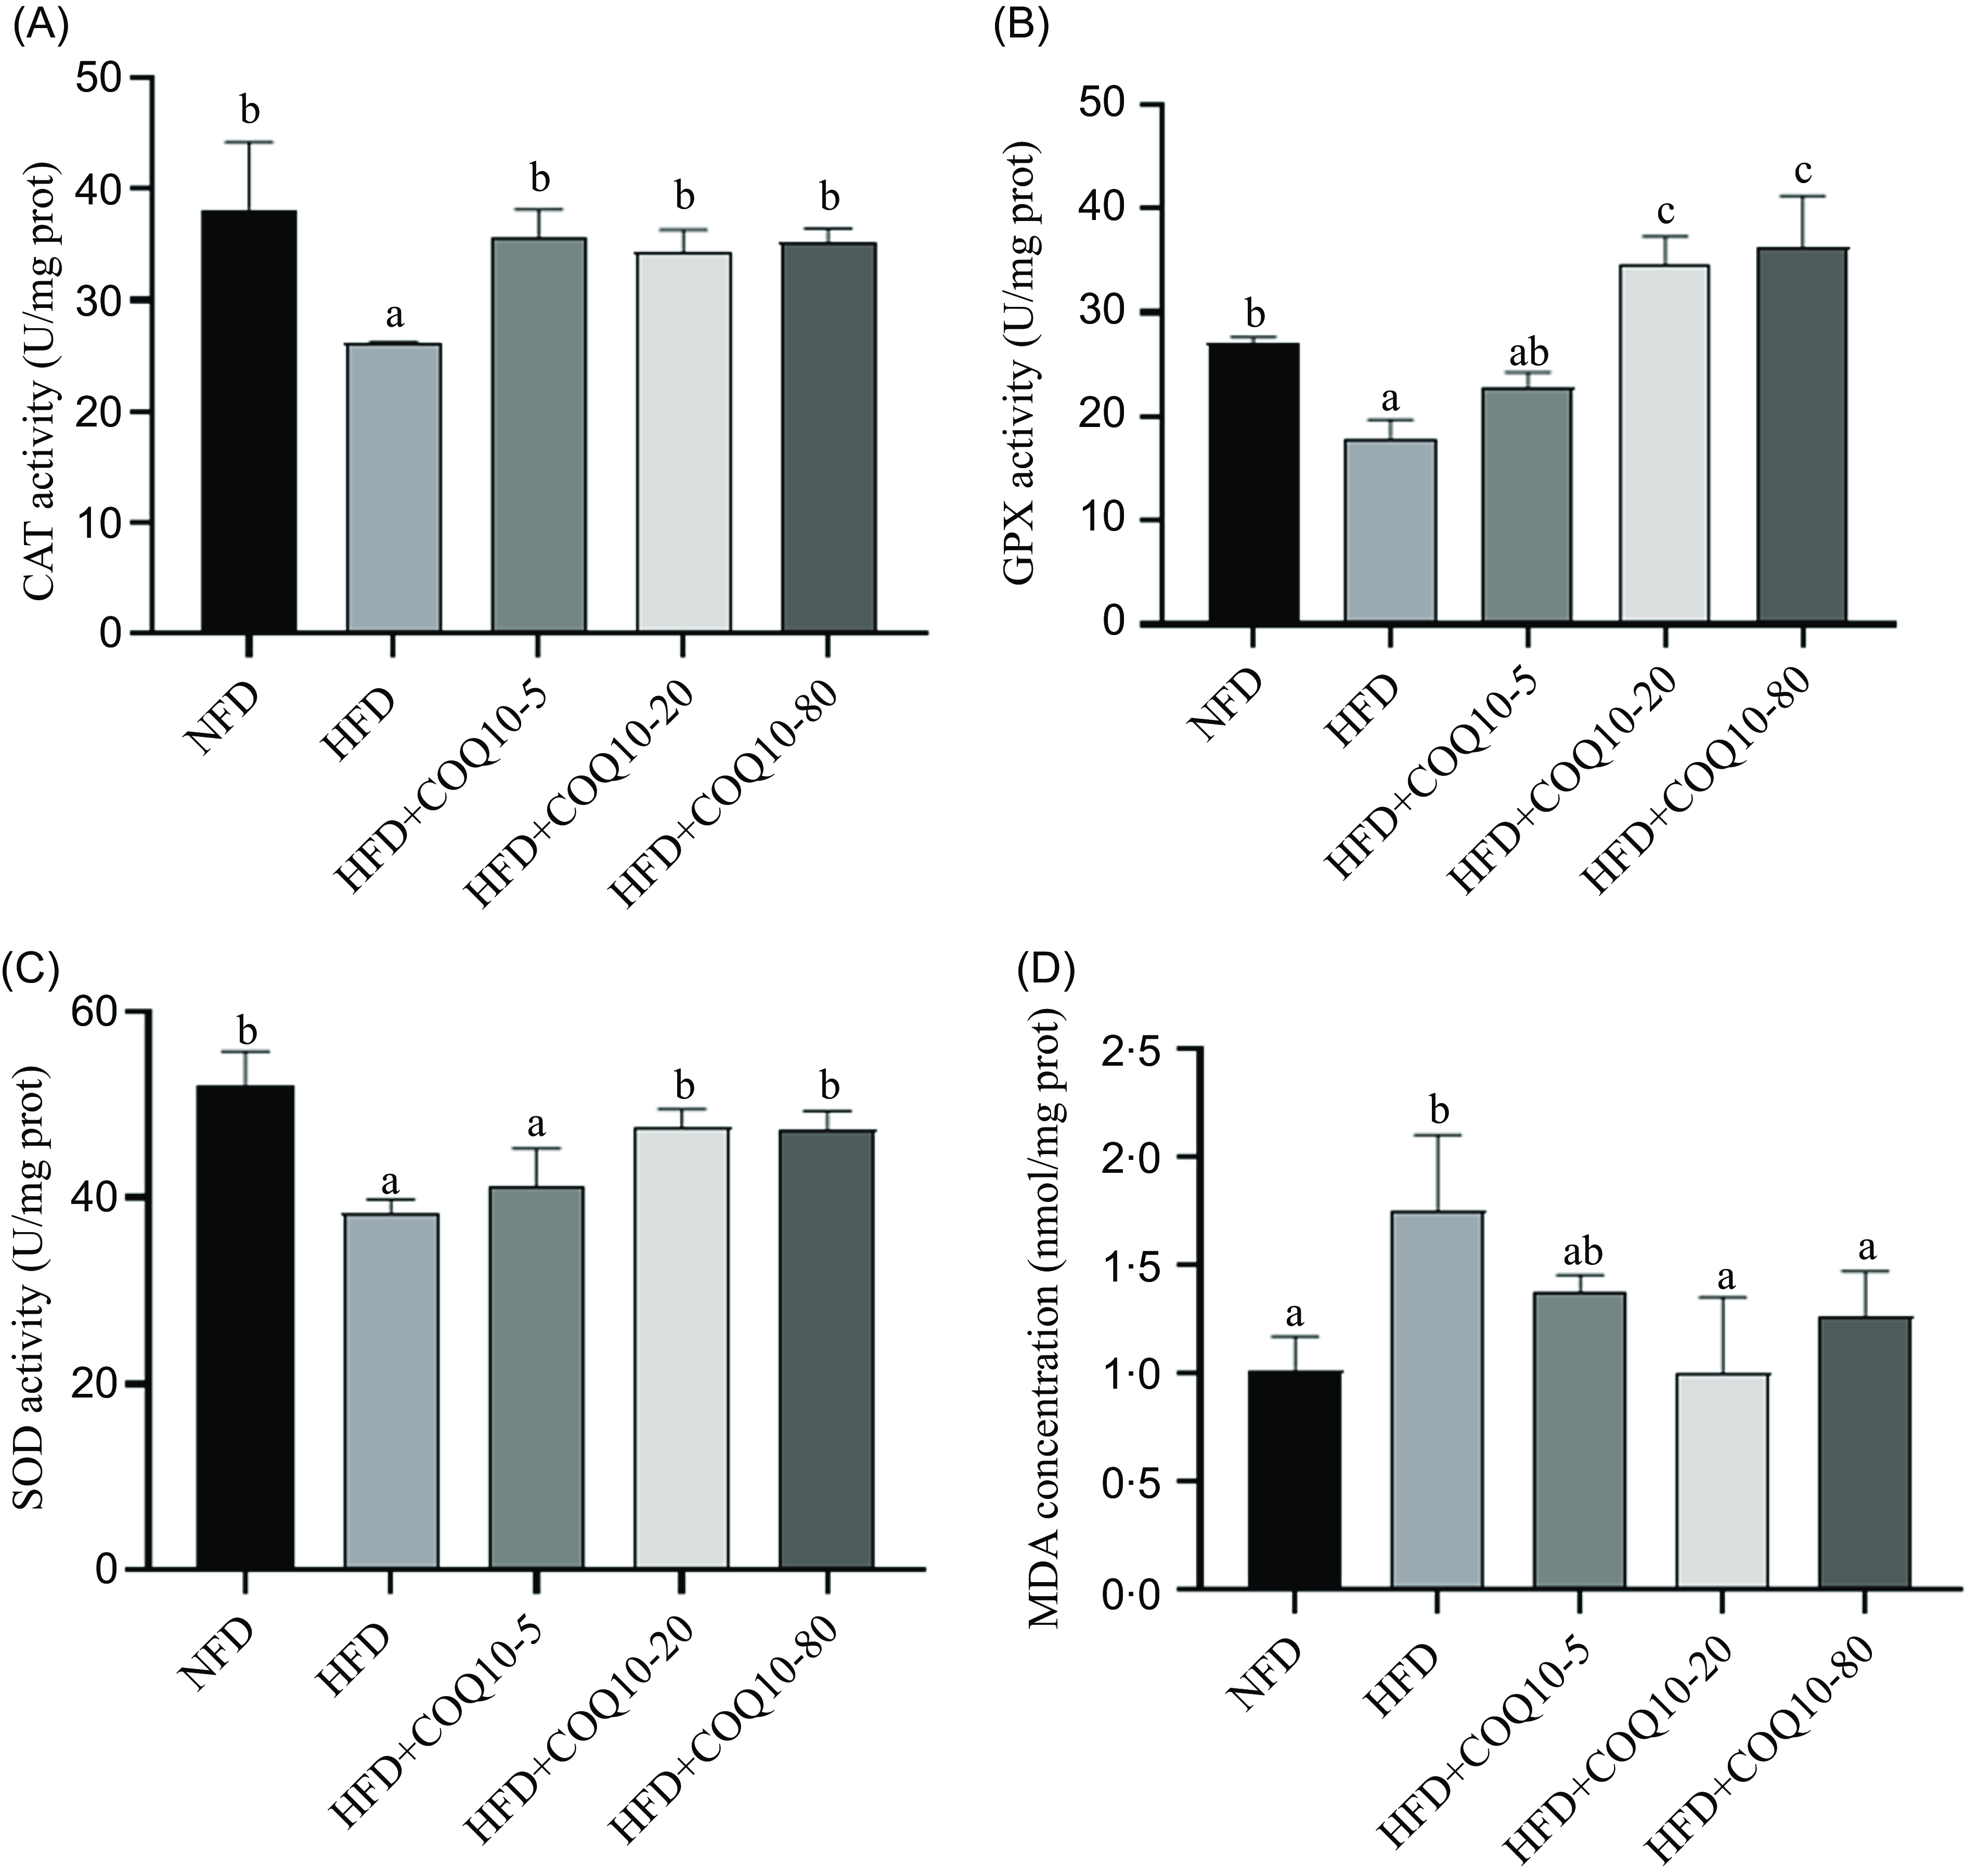
The activities of key liver antioxidant enzymes, including CAT, SOD and GPX, were significantly depressed in the HFD group compared with the NFD group (Figure 4, P = 0·022). Conversely, a marked increase in MDA concentration was observed, indicating increased oxidative stress and lipid peroxidation in the liver (P = 0·007). Notably, supplementation with COQ10 dose-dependently restored the activities of these antioxidant enzymes and attenuated the elevated MDA levels, thereby reversing the oxidative alterations associated with HFD feeding (P = 0·01).
Liver antioxidant capacity parameters of spotted seabass fed the experimental diets for 8 weeks (a) catalase activity (CAT), (b) glutathione peroxidase activity (GPX), (c) superoxide dismutase activity (SOD) and (d) malondialdehyde concentration (MDA). All values are shown as mean ± se. Bars with different letters are significantly different (P < 0·05).

Expression of fat metabolism-related genes
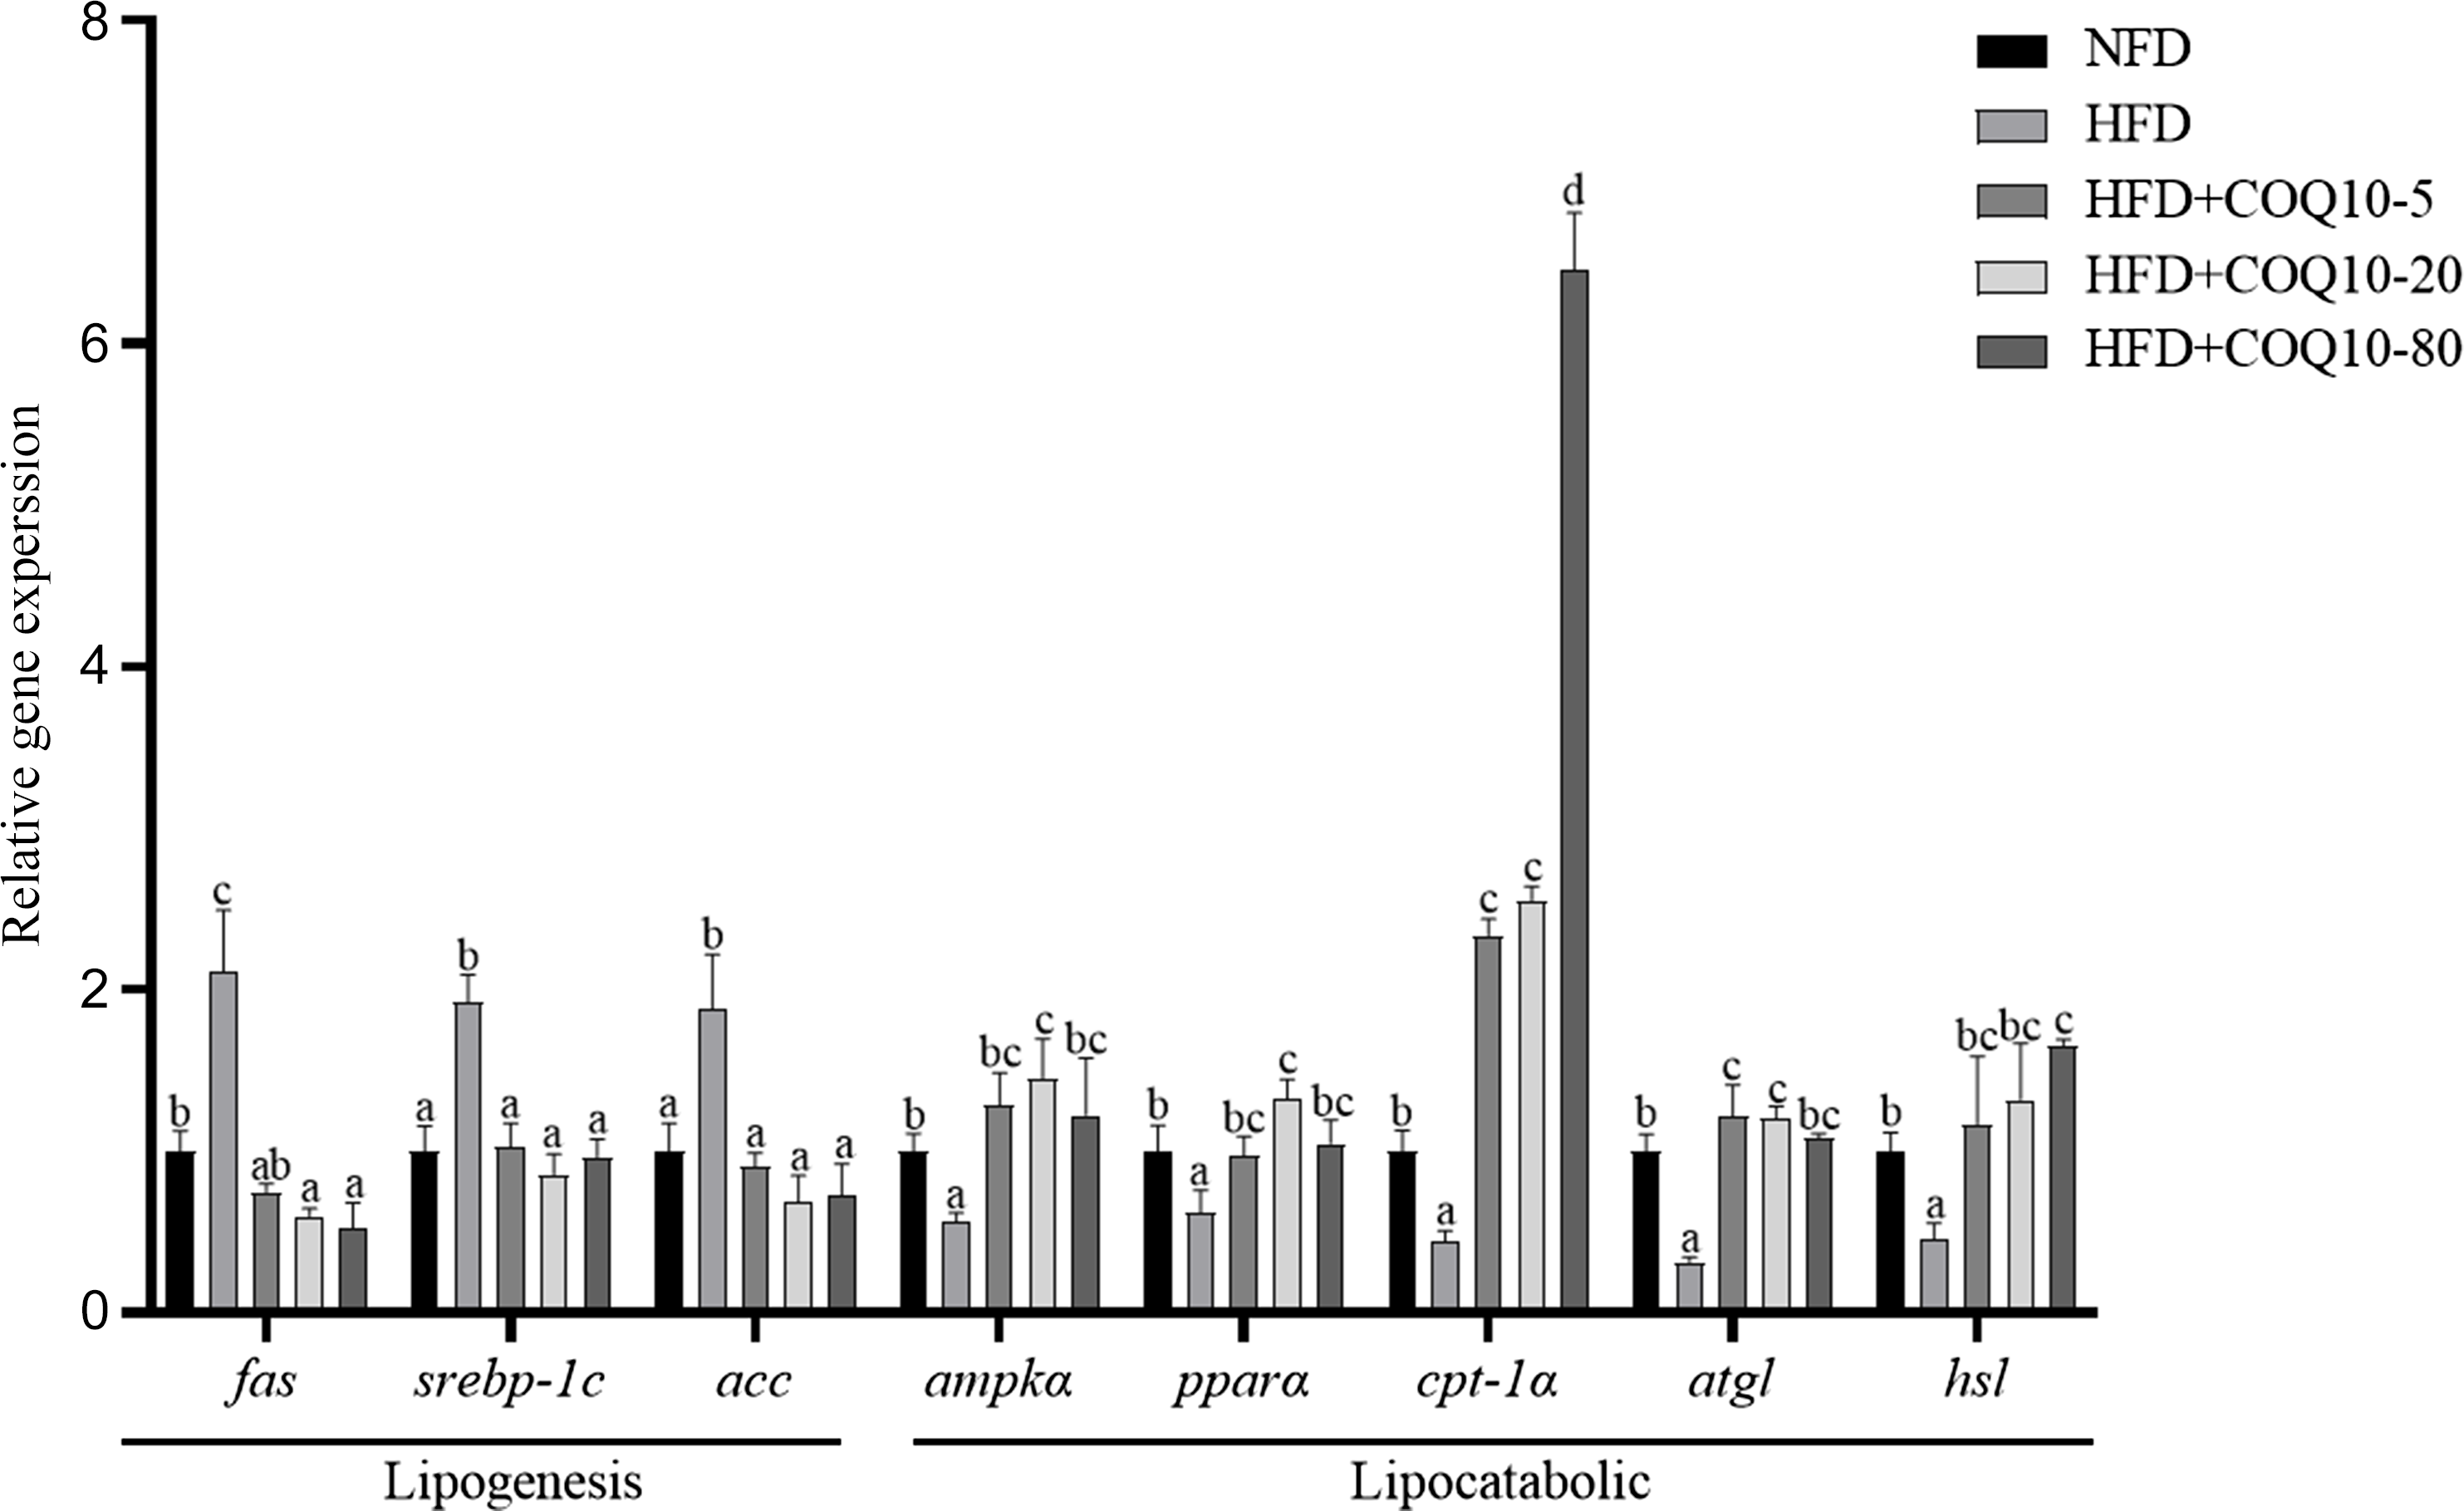
Feeding HFD resulted in a significant up-regulation of fat synthesis-related genes including fas, srebp-1c, acc, along with a significant down-regulation of lipolysis-related genes, such as atgl and hsl, indicating increased fat synthesis in the liver and inhibition of lipolysis metabolism (Figure 5) (P = 0·001). However, COQ10 supplementation reversed the expression levels of these fat metabolism-related genes (P = 0·013). Additionally, the expression of fatty acid β-oxidation-related genes, including ampkα1, pparα and cpt-1α in the liver of HFD group (P = 0·035) was inhibited. Importantly, the expression of these β-oxidation-related genes was significantly restored after COQ10 treatment, indicating that COQ10 promoted the utilisation of fatty acids in the liver of spotted seabass (P = 0·004) (Figure 5).
Expression of fat metabolism-related genes in the liver of spotted seabass fed the experimental diets for 8 weeks. All values are shown as mean ± se. Bars with different letters are significantly different (P < 0·05).

Mitochondrial function
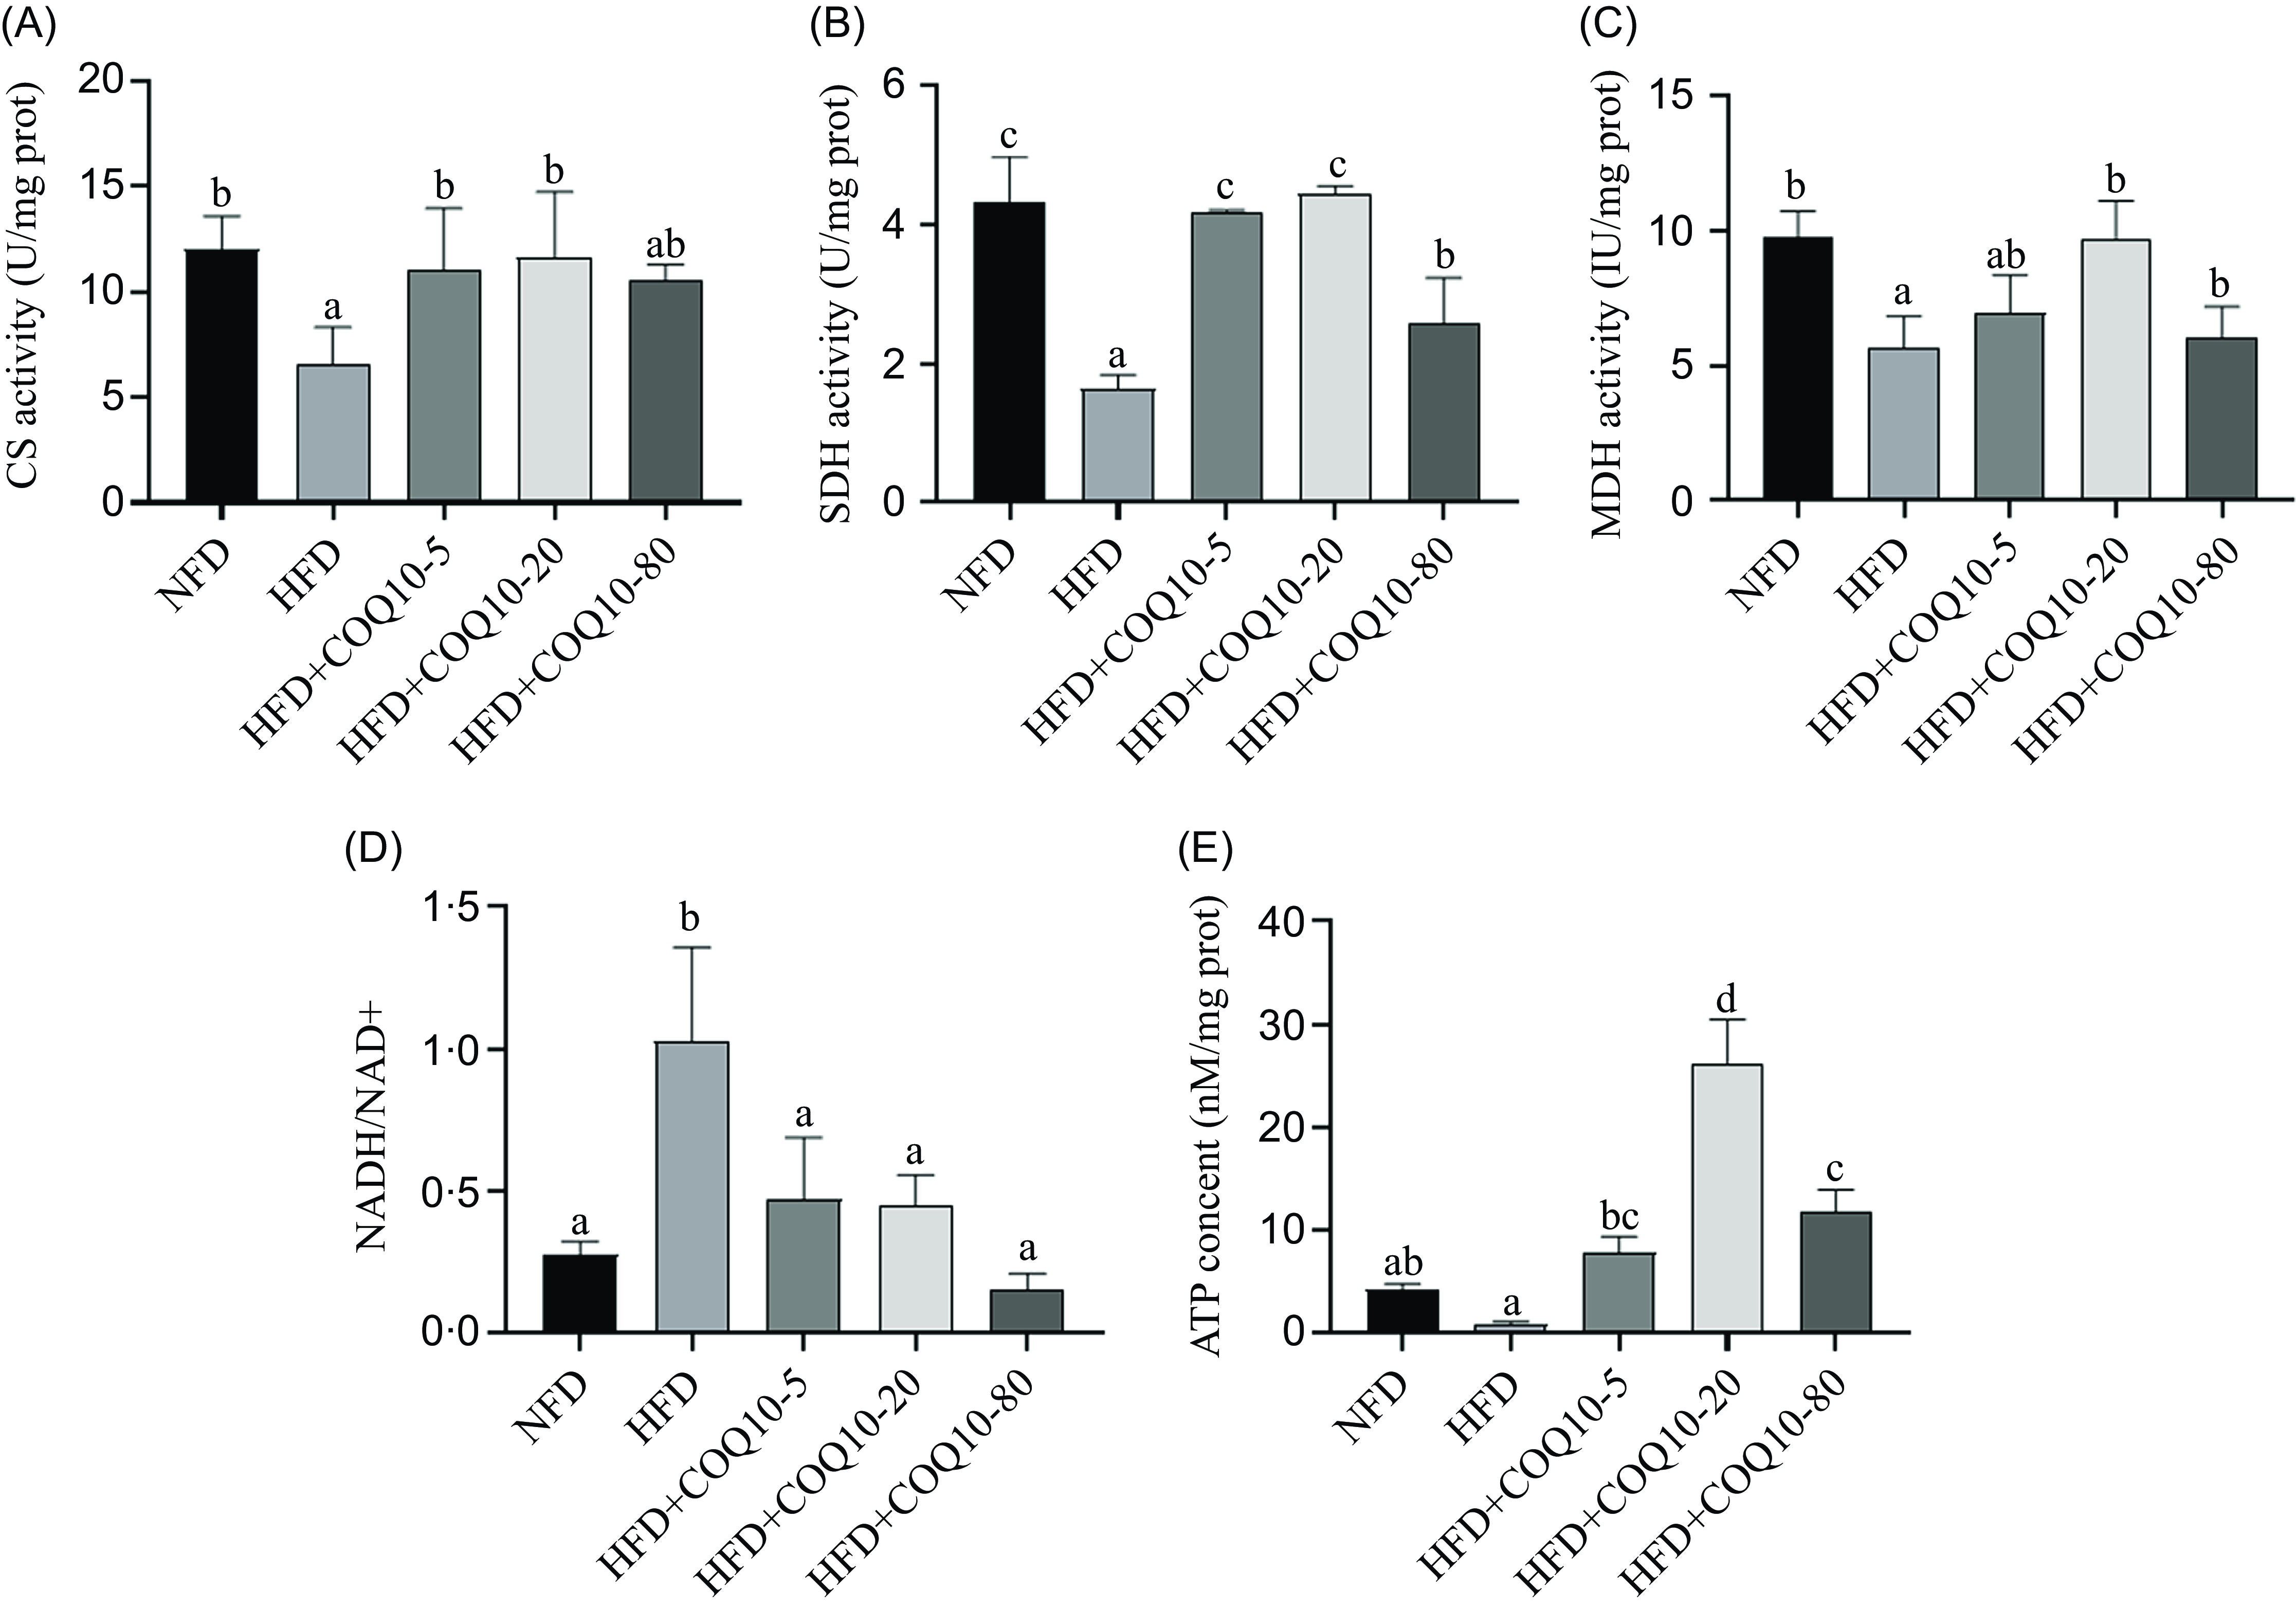
Feeding the HFD resulted in a significant decline in the activity of key mitochondrial function-related enzymes, including CS and SDH, in the liver of spotted seabass (P = 0·012). However, COQ10 administration significantly enhanced these enzyme activities (Figure 6(a) and (b)) (P = 0·032). Additionally, HFD feeding led to an increased NADH/NAD+ ratio, along with a reduction in MDH activity (Figure 6(c) and (d)) (P = 0·001). The HFD group exhibited a substantial decrease in liver ATP content, which was effectively reversed by COQ10 treatment (Figure 6(e)), indicating that COQ10 plays a critical role in restoring mitochondrial energy balance in the liver of spotted seabass (P = 0·003).
Mitochondrial citrate synthase (CS: (a)), succinate dehydrogenase (SDH: (b)) and malate dehydrogenase (MDH: (c)) activities, NAD +/NADH ratio (NAD +/NADH: (d)) and mitochondrial ATP content (e) in the liver of spotted seabass fed the experimental diets for 8 weeks. All values are shown as mean ± se. Bars with different letters are significantly different (P < 0·05).

Mitochondrial biogenesis and autophagy
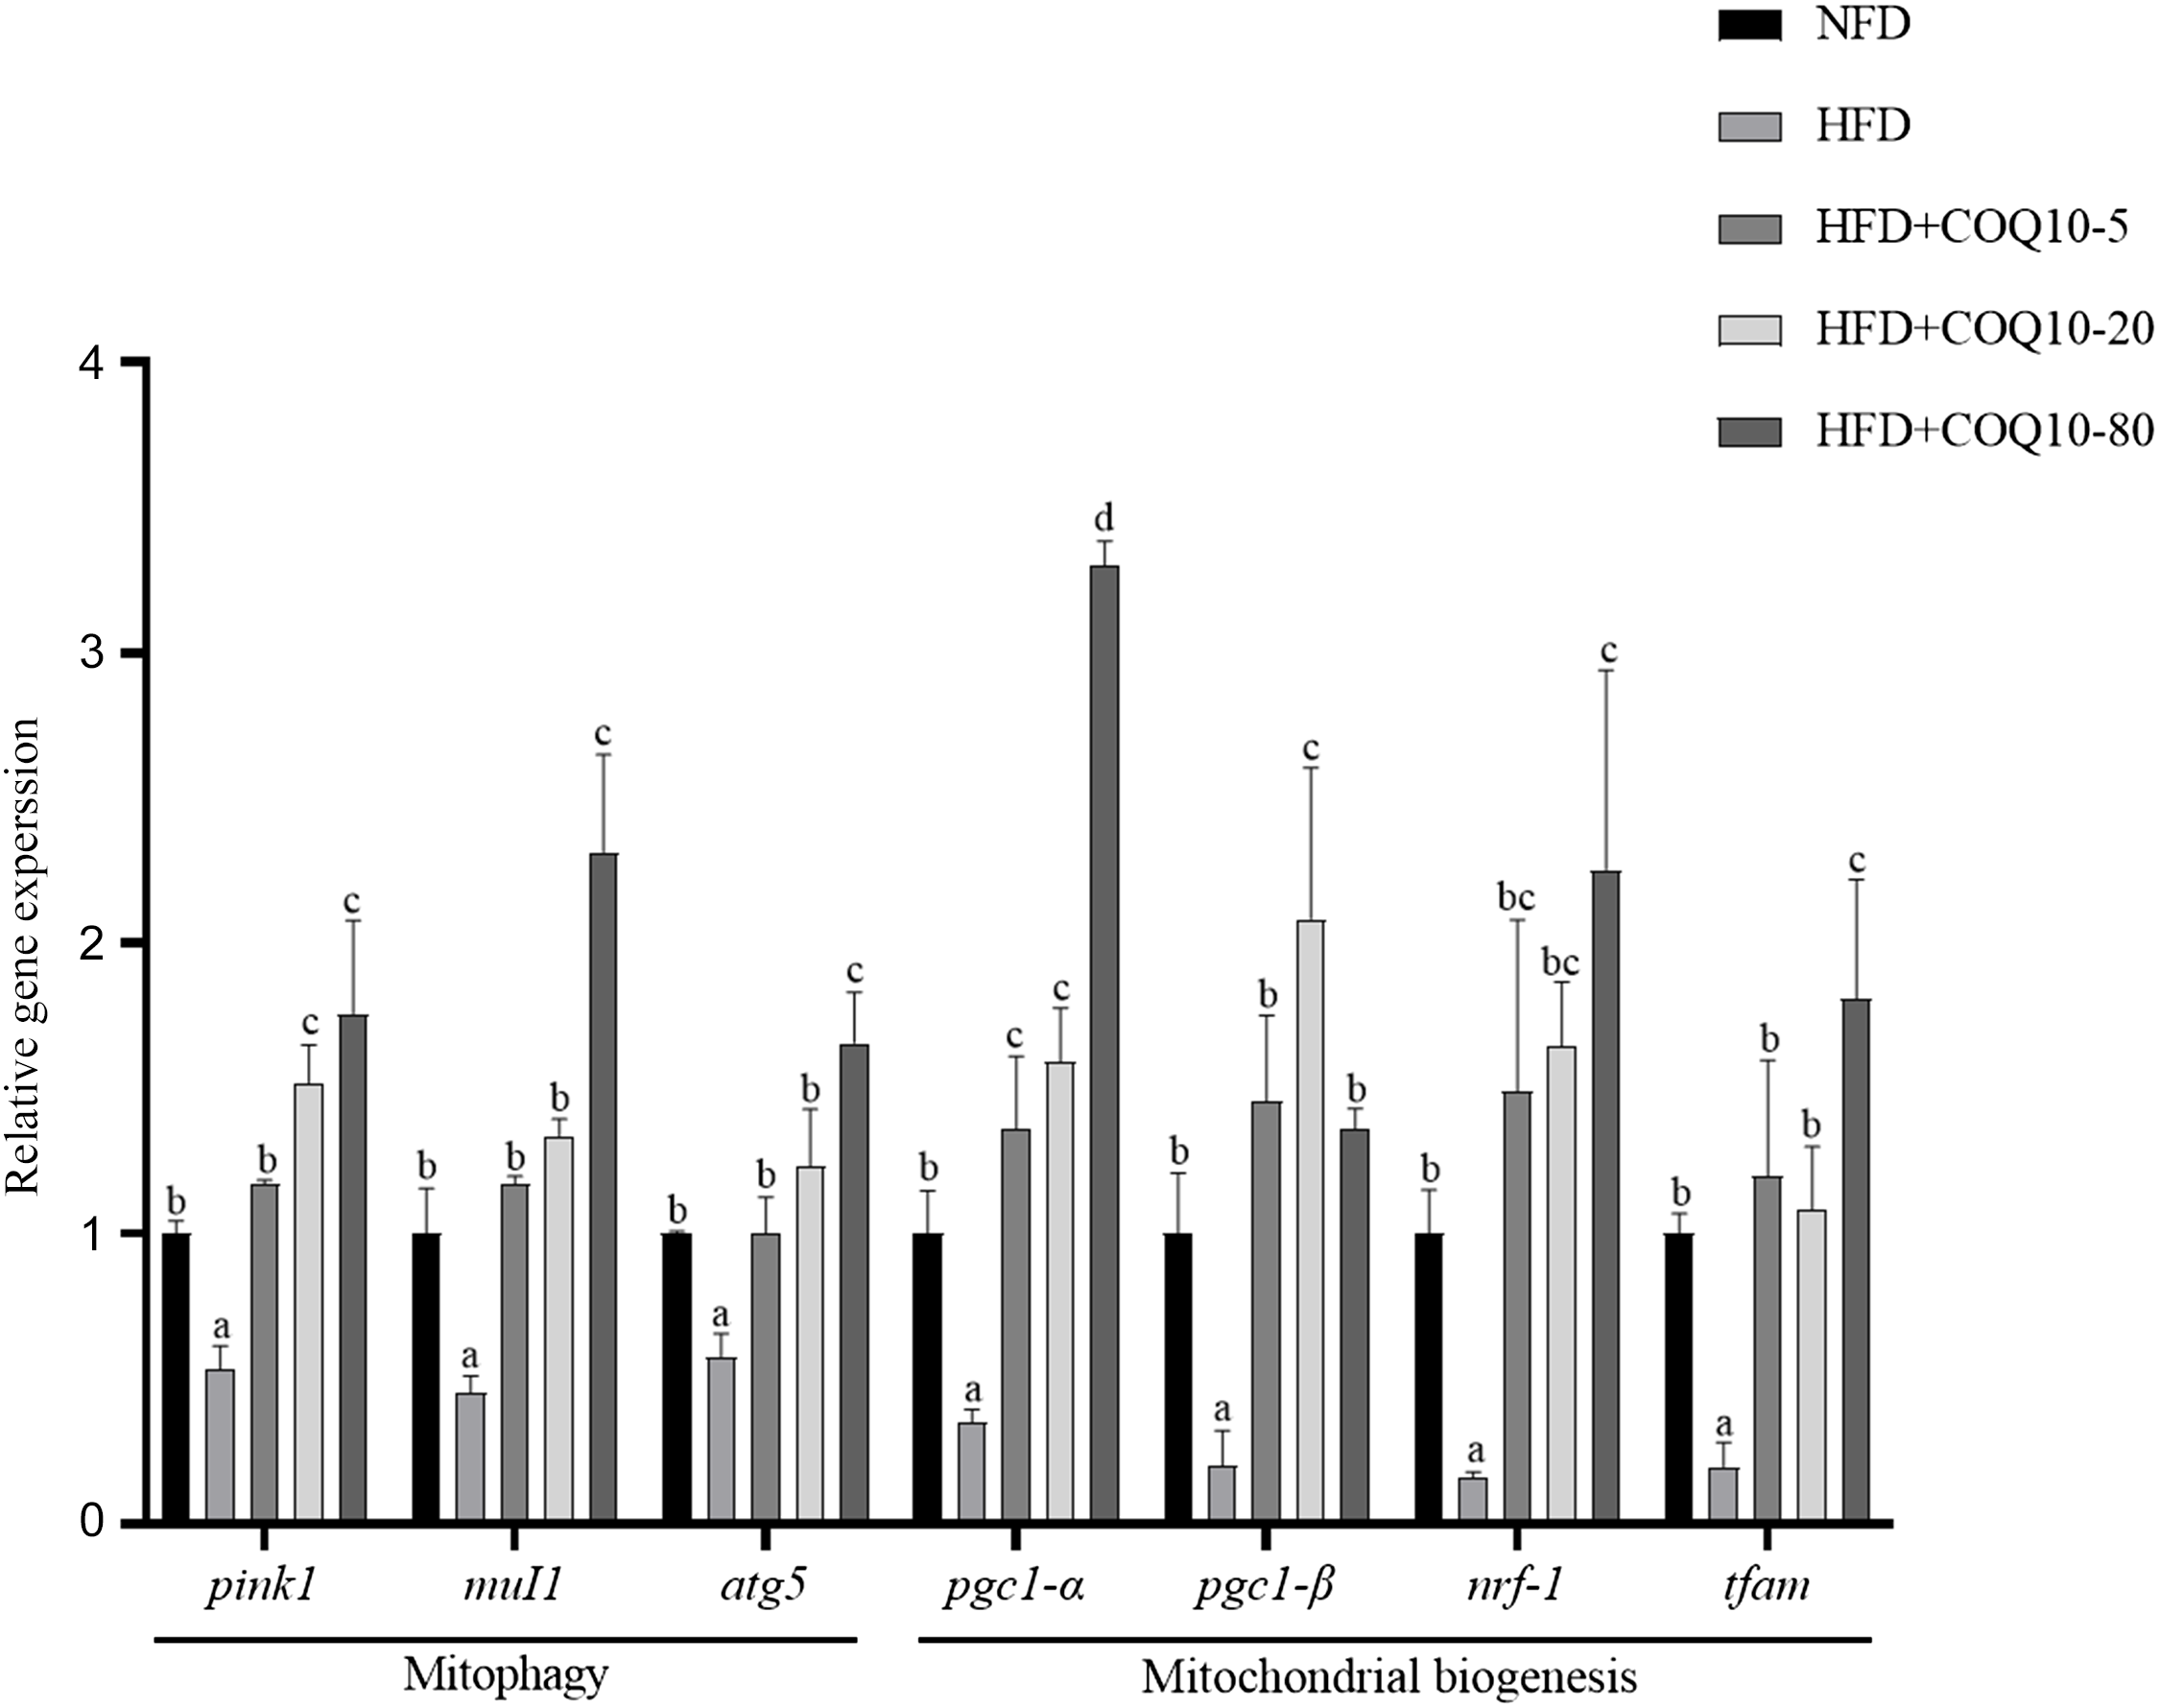
The expression profiles of genes associated with mitochondrial biogenesis and autophagy are presented in Figure 7. In the HFD group, there was a significant downregulation of mitochondrial biogenesis-related genes, including pgc-1α, pgc-1β, nrf1 and tfam, compared with the NFD group (P = 0·001). Similarly, autophagy-related genes, such as pink1, mul1 and atg5, were also significantly downregulated (P = 0·003). Notably, COQ10 supplementation significantly upregulated the expression of both mitochondrial biogenesis-related and autophagy-related genes, suggesting its potential role in enhancing mitochondrial function and promoting the autophagic process in the liver.
Expressions of mitochondrial function-related genes in the liver of spotted seabass fed the experimental diets for 8 weeks. All values are shown as mean ± se. Bars with different letters are significantly different (P < 0·05).

Discussion
Excessive fat intake can disrupt the metabolic homeostasis in farmed fish, leading to impaired growth and inferior feed utilisation(Reference Dai, Jiang and Yuan34). Studies have shown that the optimal dietary lipid level for spotted seabass is approximately 7·4–12·9 % of the diet and lipid levels exceeding 15 % disrupt lipid metabolism(Reference Xie, Lin and Wu35,Reference Xu, Qin and Yan36) . Likewise, in this study, feeding the HFD with 17 % fat led to decreased weight gain, specific growth rate and protein efficiency ratio compared with the group fed the NFD with 11 % fat. The growth-promoting effect of COQ10 observed in this study is consistent with findings from studies on European seabass (Dicentrarchus labrax) and grey mullet (Liza ramada)(Reference El Basuini, Shahin and Eldenary28,Reference El Basuini, Fattah and El-Hais37) .
Previous investigations have established that the accumulation of SFA in fish is detrimental to growth(Reference Zhong, Hu and Ji38). In this experiment, the assessment of total fatty acid composition revealed that HFD intake resulted in a marked increase in the deposition of SFA, concomitant with a reduction in the MUFA ratio, aligning with findings from research on rice field eel (Monopterus albus)(Reference Hu, Cai and Zhang39). DHA and EPA are pivotal for the growth and lipid metabolism in fish(Reference Rosjo, Berg and Manum40). Notably, this experiment demonstrated that HFD ingestion led to decreased DHA and EPA ratios in the whole body of spotted seabass. However, supplementation with COQ10 appeared to mitigate this decline, suggesting that COQ10 may promote the utilisation of DHA and EPA, thereby facilitating the growth of spotted seabass and alleviating disturbances in lipid metabolism. Research on largemouth bass has indicated that COQ10 can promote the absorption and utilisation of DHA and EPA, effectively countering the suppression of growth performance induced by oxidised fish oil(Reference Zhang, Cai and Dong41). Additionally, a study on triploid brown trout (Salmo trutta) showed that HFD intake resulted in increased total and muscle fat contents(Reference Regost, Arzel and Cardinal42). Similarly, our findings indicated that HFD feeding significantly elevated total and muscle fat content; however, supplementation with COQ10 did not yield a significant change in total fat content. Conversely, muscle fat content experienced a notable increase, which may be attributed to the role of COQ10 in promoting muscle fat deposition. Furthermore, investigations on grass carp demonstrated that DHA and EPA can stimulate muscle fat deposition(Reference Lei, Ji and Zhang43), which could also elucidate the mechanisms by which COQ10 enhances muscle fat content.
The liver serves as a critical organ in the regulation of lipid metabolism in fish. Among its various functions, the activities of ALT and AST are of paramount importance as these intracellular enzymes play vital roles in hepatic function. Serum activity levels of ALT and AST are frequently used as significant indicators for assessing the health status and the functional integrity of the fish liver(Reference Lu, Xu and Li44). Our results demonstrated that feeding HFD increases the ALT and AST activities in serum, while the addition of COQ10 reduced the activity of these transaminases. Similarly, studies on Nile tilapia (Oreochromis niloticus)(Reference Li, Qian and Zhou45) and golden pompano (Trachinotus ovatus)(Reference Li, Liang and Shao46) showed enhanced serum ALT and AST activities following HFD administration. Furthermore, investigations on rainbow trout and largemouth bass indicated that COQ10 could alleviate liver damage caused by ammonia nitrogen and oxidised fish oil, subsequently reducing the serum transaminase levels(Reference Zargari, Mazandarani and Safari47,Reference Zhang, Wu and Cai48) . The body’s fat metabolism can be accurately represented by its lipid status. Abnormally elevated TAG and T-CHO concentrations in fish blood, as key components of lipid metabolism, often indicate a disorder in lipid metabolism(Reference Vergara, López-Calero and Robaina49). The findings of this study demonstrated an increase in serum TAG and T-CHO concentrations in the HFD group, which is consistent with research on largemouth bass (Micropterus salmoides)(Reference Yin, Xie and Zhuang50) and rice field eel (Monopterus albus)(Reference Shi, Zhong and Zhong51). Studies in mice have shown that the addition of COQ10, either alone or in combination with rosiglitazone, can effectively reduce the elevation of blood lipid levels induced by HFD(Reference Chen, Chen and Xue21,Reference Carmona, Lefebvre and Lefebvre22) . COQ10 was also found to lower serum lipid levels and promote fat metabolism in European eel and Pacific white shrimp(Reference El Basuini, Shahin and Eldenary28,Reference El Basuini, Fattah and El-Hais37) . Our results similarly indicated that the addition of COQ10 lowered serum TAG and T-CHO levels, suggesting its beneficial effects on liver health and fat metabolism.
Liver steatosis is a significant manifestation of disordered fat metabolism. Alterations in TAG content within the liver are often regarded as key markers of metabolic dysfunction affecting multiple organs(Reference Elisa and Faidon52,Reference Xue, Chen and Jiang53) . Moreover, as the severity of liver steatosis intensifies, the extent of damage to liver function also increases(Reference Elisa and Faidon52,Reference Wang, Liu and Nie54,Reference Zhang, Lu and Jiang55) . In this study, HFD intake led to excessive fat deposition in the liver of spotted seabass, evidenced by a significant increase in TAG and T-CHO levels. Concurrently, abdominal fat was also significantly increased, indicating a disorder in lipid metabolism. Oil red O staining of liver sections and the quantitative assessment of lipid droplet area confirmed the findings from the liver biochemical indicators. NEFA, regarded as substrates of fatty acid oxidation, are often implicated as sources of lipotoxicity(Reference Neuschwander-Tetri13). Excessive NEFA can lead to cellular damage and apoptosis(Reference Neuschwander-Tetri13). In this study, HFD consumption led to augmented NEFA concentration in the liver, while COQ10 supplementation decreased their levels, suggesting that COQ10 alleviates lipid toxicity by activating fatty acid oxidation. Overall, the results of the liver biochemical indices and histological analyses in this study showed that COQ10 can mitigate fat deposition in the liver and reduce lipotoxicity. These findings are consistent with results from a study on Nile tilapia(Reference Qian, Wang and Ren7).
Fatty acid synthase and ACC serve as key enzymes in fatty acid synthesis, playing a crucial role in the process of generating new fatty acids. Their expression and activity are regulated by the sterol regulatory element-binding protein family, which are the primary regulators of lipid homeostasis, sterol regulatory element-binding protein controls the transcription of genes involved in lipid biosynthesis and uptake, ensuring a balance between fatty acids synthesis and degeneration to maintain metabolic equilibrium(Reference Wilentz, Witters and Pizer56). ATGL is critical in the mammalian lipolysis process and in mobilisation of lipid stores. It initiates the first step of TAG catabolism, and the lipolysis facilitated by ATGL may have significant implications for maintaining liver lipid homeostasis and influencing the progression of liver diseases. Downregulated expression of ATGL can lead to obesity and other metabolic complications due to impaired lipid mobilisation(Reference Zimmermann, Strauss and Haemmerle57–Reference Bolsoni-Lopes and Alonso-Vale59). Numerous studies have reported that HFD intake can upregulate the expression of fatty acid synthase and downregulate the expression of ATGL(Reference Li, Yuan and Liang60–Reference Zhang, Wen and Zhang62) in mice and fish models. Similarly, feeding spotted seabass the HFD resulted in increased expression of fas, acc, srebp-1c and reduced expression of atgl, which corresponded with the observed fatty acid synthase and ATGL enzymatic activities in the liver. These HFD-induced alterations in fas, acc, srebp-1c and atgl genes expression and their corresponding enzymatic activity in the liver were reversed by COQ10 supplementation, indicating that COQ10 can alleviate fat deposition by promoting fat breakdown and inhibiting fat synthesis. In addition to regulating hepatic de novo lipogenesis, the balance of hepatic TAG is also maintained through mitochondrial β-oxidation. In this pathway, PPAR-α, a nuclear hormone receptor activated by fatty acids, plays a critical role in the transcriptional regulation of lipid metabolism, particularly in promoting fatty acid oxidation(Reference Mandard, Müller and Kersten63). Among its downstream molecular targets, carnitine palmitoyltransferase-1 (CPT-1α) is an important component, serving as the rate-limiting enzyme in the mitochondrial fatty acid β-oxidation pathway. Our results showed that COQ10 treatment increased the expression of ppar-α and cpt-1α, promoting fatty acid oxidation. As an energy sensor, AMP-activated protein kinase (AMPK) plays a critical role in maintaining metabolic homeostasis. Studies have shown that AMPKα1 is associated with the incidence of non-alcoholic fatty liver disease and is involved in the liver lipid metabolism(Reference Yang, Li and Liu64–Reference Hardie66). Our previous research demonstrated that the activation of AMPKα1 can reduce fat deposition in the liver of blunt snout bream(Reference Dong, Li and Espe67). Moreover, studies have shown that the activation of AMPKα1 can upregulate CPT-1α and PPARα to promote fatty acid β-oxidation(Reference Chen, Chen and Xue21). Our data suggest that HFD ingestion may lead to dysfunction in AMPKα1 activation, while COQ10 application could potentially restore AMPKα1 activation. This suggests that the AMPKα1 metabolic pathway is involved in the lipid-lowering effect of COQ10. COQ10 appears to alleviate liver fat deposition in spotted seabass by both inhibiting lipogenesis and promoting fatty acid oxidation, consistent with findings from a study on mice(Reference Lee, Lee and Kim23). However, the underlying mechanisms require further investigation.
According to the two-hit hypothesis, the initial hit involves an increase in TAG accumulation in the liver, disrupting lipid metabolic balance. The second hit primarily arises from the excessive deposition of reactive oxygen species due to oxidative stress, resulting in lipid peroxidation and subsequent impairment of cellular structure and function(Reference Day and James68,Reference Tessari, Coracina and Cosma69) . To counter oxidative stress, fish have evolved an antioxidant defense system, which includes enzymatic antioxidants such as SOD, CAT, GPX and GR, as well as non-enzymatic antioxidants such as GSH(Reference Lu, Wang and Zhang16,Reference Ming, Ye and Zhang70) . MDA, one of the stable end products of lipid peroxidation, is commonly used as a marker to evaluate oxidative stress and lipid peroxidation in aquatic animals(Reference Ming, Ye and Zhang71). In this study, the activity of liver antioxidant enzymes in the HFD group was significantly lower than in the NFD group, while the MDA level in the HFD group exhibited the opposite trend. Elevated MDA levels in fish fed HFD indicated an imbalance between reactive oxygen species production and removal. These findings are consistent with result from studies on juvenile black carp (Mylopharyngodon piceus)(Reference Ming, Wang and Wang72), Nile tilapia(Reference Jia, Cao and Du73) and largemouth bass(Reference Xie, Yin and Tian74) fed HFD. Our results showed that supplementation with an appropriate dose of COQ10 in HFD could increase the activities of SOD, CAT and GPX in the liver of spotted seabass and reduce MDA level. COQ10, particularly in its reduced form (ubiquinol), functions as a potent antioxidant and free radical scavenger. It protects DNA, cell membranes, lipids and proteins, mitigating the potential for oxidative damage. Additionally, it aids in the regeneration of vitamin E and sometimes referred to as a ‘supervitamin’ or ‘vitamin Q’(Reference Yoshida, Hayakawa and Habuchi75,Reference Hargreaves and Mantle76) . A previous study on tilapia showed that supplementation of 20–40 mg/kg of COQ10 can significantly increase the activities of CAT, SOD and GPX, as well as expression of their genes in the liver and intestine. Studies on rainbow trout and largemouth bass also found that COQ10 can alleviate oxidative stress caused by oxidised fish oil and ammonia nitrogen stress(Reference El Basuini, Teiba and Zaki30,Reference Zargari, Mazandarani and Safari47,Reference Zhang, Wu and Cai48) .
Mitochondria are essential organelles present in most eukaryotic cells. They are the primary sites for physiological processes such as the tricarboxylic acid (TCA) cycle, oxidative phosphorylation and fatty acid β-oxidation, all of which are closely associated with nutrient metabolism. Therefore, normal mitochondrial function is necessary for animals to maintain metabolic homeostasis and efficiently utilise nutrients(Reference Bottje, Tang and Iqbal77). However, in cases of overnutrition, such as excessive fat intake, mitochondria become susceptible to metabolic stress(Reference James, Collins and Logan12). Numerous studies have shown that lipid metabolic disorders in fish are often accompanied by liver mitochondrial damage. For example, a study on zebrafish (Danio rerio) showed that the addition of the carnitine synthesis inhibitor midozide to the diet caused excessive liver fat deposition, accompanied by decreased mitochondrial fatty acid β-oxidation(Reference Li, Li and Qin78). Another study on grass carp (Ctenopharyngodon idella) showed that feeding a HFD enhances blood lipid content, alters liver fatty acid composition and reduces liver mitochondrial content and oxidative capacity(Reference Du, Clouet and Zheng4). CS, a key rate-limiting enzyme in the TCA cycle, catalyses the condensation of acetyl CoA and oxaloacetic acid to form citric acid, regulating the entry into the TCA cycle. SDH serves as a key link between the TCA cycle and oxidative phosphorylation. Both CS and SDH are used as marker enzymes for assessing mitochondrial function(Reference Zhang, Zheng and Huang79). In this study, feeding the HFD resulted in decreased CS and SDH activities, while COQ10 supplementation in the HFD significantly increased their activity. NAD+ is the primary hydrogen receptor in glycolysis (EMP) and the TCA cycle. The NADH generated transfers electrons to oxygen via the electron transport chain. During ATP synthesis, reactive oxygen species are produced as byproducts of electron transfer in the electron transport chain, and NADH is regenerated into NAD+. The oxidation of most large metabolites, such as sugars, fats and proteins, is completed through this system. Therefore, the NADH/NAD+ ratio is a key indicator of the state of glycolysis and TCA cycle. Elevated NADH levels and a higher NADH/NAD+ ratio indicate increased oxygen consumption during cellular respiration and a state of peroxidation. Additionally, a surge in the NADH/NAD+ ratio can impede both glycolysis and the TCA cycle. Our results showed that HFD intake enhances the NADH/NAD+ ratio in the liver of spotted seabass, indicating inhibition of lipid peroxidation and TCA cycle; however, this ratio was significantly reduced by COQ10 supplementation. MDH is an enzyme involved in the TCA cycle that converts malate to oxaloacetate, influencing the efficiency of the cycle. A reduction in MDH activity in the liver of cobia (Rachycentron canadum) with increasing dietary lipid level has been reported(Reference Wang, Liu and Tian80). Similarly, we observed a decrease in MDH activity in the HFD group, suggesting inhibition of the mitochondrial TCA cycle and impairment of mitochondrial function. However, supplementation with COQ10 significantly mitigated this effect. Additionally, mitochondrial dysfunction can impair the electron transport chain, leading to reduced ATP production(Reference Antoine, Fisher and Amewu81). Our data indicated that COQ10 administration can restore ATP levels in the liver of spotted seabass affected by HFD feeding, affirming the positive impact of COQ10 on mitochondrial function.
Mitochondria are highly dynamic organelles that undergo continuous renewal under normal physiological conditions. This renewal involves the constant generation of new, functional mitochondria through mitochondrial biogenesis, along with the removal of aging and damaged mitochondria through mitophagy. These two biological processes are essential for maintaining proper mitochondrial function, and consequently, cellular homeostasis(Reference Palikaras, Lionaki and Tavernarakis82). The transcription coactivators PGC-1α and PGC-1β play pivotal roles in regulating mitochondrial biogenesis by activating the expression of downstream transcription factors. Among these, NRF1 stimulates the expression of nuclear-encoded mitochondrial genes, promoting the transport and assembly of peptides and proteins necessary for mitochondrial function. TFAM, on the other hand, promotes the replication and transcription of mitochondrial DNA, facilitating the formation of mitochondrial respiratory chain complexes(Reference Scarpulla83). In this study, HFD was observed to notably suppress the expression of pgc-1α, nrf-1 and tfam, while COQ10 administration significantly enhanced the expression of pgc-1α, pgc-1β, nrf1 and tfam. These results suggest that HFD impairs mitochondrial development in the liver of spotted seabass, while COQ10 stimulates mitochondrial formation. This finding aligns with observations from two investigations in mammalian models(Reference Wagner, Ernst and Birringer84,Reference Choi, Pokharel and Lim85) . This effect may be attributed to mitochondrial biogenesis, a widely conserved process across species. Therefore, COQ10 may play a similar role in promoting mitochondrial biogenesis in different species. The removal of impaired mitochondria and their restoration through mitochondrial biogenesis are crucial aspects of the mitochondrial quality control mechanism. The PINK1-mediated mitophagy pathway is a key regulatory mechanism in this context(Reference Lazarou, Sliter and Kane86). Our results showed that the expression levels of pink1, mul1 and atg5 in the PINK1-mediated mitophagy pathway were significantly decreased in the HFD group, while COQ10 supplementation in the HFD stimulated the expression of these genes. Mitophagy and mitochondrial biogenesis are closely interacted, and dysregulation of mitophagy can impair mitochondrial formation(Reference Palikaras and Tavernarakis87). Thus, COQ10 may enhance mitochondrial biogenesis and improve mitochondrial function by stimulating mitophagy. However, additional evidence, such as protein expression analyses and further validation in cellular models, is needed to confirm that COQ10 activates mitophagy and promotes mitochondrial biogenesis.
Conclusion
In conclusion, our findings indicate that feeding a HFD can induce lipid metabolism disorders, characterised by excessive lipid accumulation, oxidative stress, liver histopathological abnormalities and dysregulation of lipid metabolism-related genes expression. The administration of 20–80 mg/kg COQ10 in the HFD improved fish growth, promoted lipid metabolism, strengthened antioxidant capacity, stimulated mitochondrial function and reduced excessive lipid accumulation. The lipid-lowering mechanism of COQ10 is likely mediated through the activation of AMPK signalling pathway, upregulation of lipolysis-related genes and the promotion of mitophagy and mitochondrial biogenesis. However, further research is needed to clarify the precise mechanisms through which COQ10 modulates mitochondrial function to facilitate lipid reduction.
Acknowledgements
This research was funded by the National Natural Science Foundation of China (32072984) and the Natural Science Foundation of Fujian Province (2023J06035).
The authors’ contributions were as follows: K. L. designed the research. X. M. conducted the research, analysed the data and wrote the manuscript. X. L., L. W., C. Z., B. H. and S. R. contributed to the writing and revision of the manuscript. All authors reviewed and approved the final manuscript.
We declare that we have no financial and personal relationships with other people or organisations that might inappropriately influence our work, and there is no professional or other personal interest of any nature or kind in any product, service and/or company that could be construed as influencing the content of this article.