

The glycaemic index (GI) was introduced in 1981 after observing the dramatic variation in blood glucose response after the ingestion of carbohydrate-rich foods( Reference Jenkins, Wolever and Taylor 1 ). It is defined as ‘the incremental area under the blood glucose response curve (IAUC) of a 50 g carbohydrate portion of a tested food expressed as a percent of the response to the same amount of carbohydrate from a reference food taken by the same participant (white bread or glucose), on a different day’( 2 ).
Initially, GI was only utilised in the prevention and management of diabetes( Reference Salmerón, Ascherio and Rimm 3 ). Further, epidemiological and interventional studies investigated other important implications of GI for prevention and treatment of obesity( Reference Brand-Miller, Holt and Pawlak 4 ), CVD( Reference Ludwig 5 ), CHD( Reference Van Dam, Visscher and Feskens 6 ) and certain forms of cancer( Reference Aziz 7 ). Recent scientific evidence indicates a possible role of low-GI diets in the treatment and prevention of diabetes mellitus (DM)( Reference Rahelić, Jenkins and Božikov 8 ), obesity( Reference Parillo, Licenziati and Vacca 9 ), hyperlipidaemia and CVD( Reference Ludwig 5 ), by improving insulin sensitivity( Reference Raatz, Torkelson and Redmon 10 ), regulating appetite( Reference Alfenas and Mattes 11 ), lowering fasting insulin and C-reactive protein levels( Reference Schwingshackl and Hoffmann 12 ), reducing total cholesterol and LDL-cholesterol( Reference Goff, Cowland and Hooper 13 ), and regulating blood pressure( Reference Radulian, Rusu and Dragomir 14 ).
Moreover, the FAO of the UN and the WHO have also validated the use of GI for the classification of carbohydrate-containing foods( 2 ), and recommend its use along with food composition tables to guide better food choices. However, several factors like cooking method, food particle size, food processing and starch structure could alter the GI of foods significantly( Reference Brouns, Bjorck and Frayn 15 ). The GI of the same food has been shown to vary in different countries, regions or manufacturers. Emirati traditional foods differ from other cuisines mainly in the ingredients used and the cooking method (e.g. prolonged cooking, mixing all ingredients in one pot), thus it is hypothesised that traditional Emirati foods have different GI values compared with similar foods in the Gulf region.
The first international table of GI was published in 1995( Reference Foster-Powell and Miller 16 ) and included 565 separate entries. Updated versions of the GI tables were published in 2002( Reference Foster-Powell, Holt and Brand-Miller 17 ) and the most recent in 2008( Reference Atkinson, Foster-Powell and Brand-Miller 18 ). The latter includes the GI and glycaemic load (GL) values of 2487 individual food items( Reference Atkinson, Foster-Powell and Brand-Miller 18 ). However, the majority of the published GI and GL values are from Western countries and not much data are available about the GI values of Arabic foods, particularly Emirati foods. Therefore, the main aim of the this study is to provide reliable values of GI and GL of some commonly consumed foods in the United Arab Emirates.
Methods
Participants
A total of eighty-eight healthy participants (thirty-seven males and fifty-one females) from United Arab Emirates University (UAEU), students and staff, were voluntarily recruited to take part in the study. Characteristics of the participants are presented in Table 1. Recruitment was carried out via posters distributed around the university campus and email invitations. All participants were informed about the details of the study, study protocol and were given a chance to ask questions. Informed written consent was obtained from all participants before taking part in the study. Participants were excluded if they were <18 or >40 years; BMI value was ≥25 or <18·5 kg/m2; fasting blood glucose value of >6·1 mmol/l or having a known history of impaired glucose tolerance or DM.
Anthropometric characteristics of the study population (Mean values and standard deviations for eighty-eight participants, 42 % males to 58 % females)
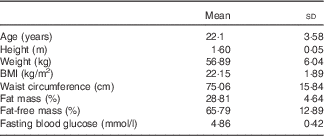
Participants were asked to complete a health-screening questionnaire before taking part to confirm that they met the inclusion criteria. Anthropometric measurements were conducted in the Nutrition and Health Department laboratory at UAEU before recruitment to confirm whether a participant met the inclusion criteria. All measurements were obtained at the fasting state (i.e. during active 12-h fast) while wearing minimal clothing (as local culture permits) and no shoes. Height was recorded to the nearest 1 cm using a stadiometer (Seca Ltd) and waist circumference (cm) was measured using a measuring tape. Body weight (kg), fat mass and fat-free mass were measured using Tanita Segmental Body Composition Analyser (TBF-410 MA; Tanita). BMI was calculated as weight (kg) divided by the square of the height (m2).
The present study was conducted according to the guidelines laid down in the Declaration of Helsinki and all procedures involving human subjects were approved by the United Arab Emirates University Scientific Research Ethics Committee (ref. no. 516/09).
Test foods
A total of eighteen different foods commonly consumed in the UAE and categorised into breads (n 5), entrée dishes (n 3), main dishes (n 5) and sweet dishes (n 5) were tested. The test foods were purchased from popular restaurants in the UAE that specialise in Emirati cuisine and have standardised recipes. Table 2 lists the major ingredients of the test foods.
Main ingredients of eighteen traditional foods commonly consumed in the United Arab Emirates

Analytical methods
Proximate analyses including moisture, protein, fat, fibre and ash content were conducted at the Nutrition and Health Department laboratories of the university following standard methods of the Association of Official Analytical Chemists( Reference Horwitz 19 ). Total carbohydrate and available carbohydrate content were estimated by difference( Reference Dashti, Al-Awadi and Khalafawi 20 ). The energy content was calculated by multiplying the amount of protein, carbohydrate and fat by factors of 4, 4 and 9, respectively( Reference Al Nagdy, Abd-El Ghani and Abdel-Rahman 21 ). Each test was performed in triplicate and the results averaged to minimise possible systematic and random experimental errors.
Study protocol
The procedure for GI measurement was adapted from Wolever et al.( Reference Wolever, Jenkins and Jenkins 22 ) and Brouns et al.( Reference Brouns, Bjorck and Frayn 15 ) and is recommended by Food and Agriculture Organization/World Health Organization( 2 ). Testing was repeated in at least fifteen participants for each test food. Prior to the test day, participants were requested to limit their intake of caffeinated drinks and avoid involvement in intense exercise. Participants were asked to fast for 12 h (overnight) the night before each test.
Using the randomised cross-over design, participants tested the reference food three times and each test food for one time only. Food testing was carried out on separate occasions with at least 1-d gap between measurements to minimise any carry-over effects. The reference food provided was glucose powder (glucose dextrose monohydrate) dissolved in 200 ml of water. Test foods were tested in equivalent available carbohydrate amounts (25 or 50 g) as per the reference food and were also served with 200 ml water. Test foods were purchased 1 d before the test, then heated in the morning of the test. Participants were encouraged to consume the reference or test foods within 15 min and to minimise physical activity during the testing time. Available carbohydrate content was used to determine the experimental portion (g) that would provide 50 or 25 g of available carbohydrates from each test food. The majority of test foods were tested against 50 g of available carbohydrate. Nevertheless, if the serving size was found to be too large to ingest comfortably, this test food was tested against 25 g of available carbohydrate( Reference Brouns, Bjorck and Frayn 15 ). In this study, only Chami (cottage cheese) was tested against 25 gof available carbohydrate due to its very low carbohydrate content (5·44/100 g).
Blood glucose measurements
Before blood collection, participants were asked to warm their hand to increase blood flow. A fasting blood sample (0 min) was then obtained (following the WHO 2010 guidelines for withdrawing blood( 23 )) before consumption of each food and additional blood samples obtained at 15, 30, 45, 60, 90 and 120 min after the consumption of each food. Capillary blood was collected from the third finger on the left hand using the OneTouch® UltraSoft™ Adjustable Blood Sampler (Johnson and Johnson). Squeezing of the finger was avoided to minimise plasma dilution and a 5-µl-blood sample was collected in a microcuvette by capillary action. Blood glucose was measured using the HemoCue Glucose 201+ portable system (HemoCue® Ltd). Calibration of the blood glucose meters was done daily according to the manufacturers’ instructions.
Calculation of glycaemic index and glycaemic load
The IAUC was geometrically calculated ignoring the area beneath the baseline( Reference Wolever, Jenkins and Jenkins 22 ). The IAUC for each test food consumed by each subject was expressed as a percentage of the mean IAUC for the reference food consumed by the same subject:
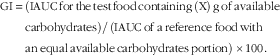 $$\eqalignno{{\rm GI}\,{\equals}&\,({\rm IAUC}\,{\rm for \,the \,test \,food \,containing}\,\left( {\rm X} \right)\,{\rm g}\,{\rm of}\,{\rm available}\, \cr & \,{\rm carbohydrates})/\,({\rm IAUC}\,{\rm of}\,{\rm a}\,{\rm reference}\,{\rm food}\,{\rm with}\,\cr & \,{\rm an}\,{\rm equal}\,{\rm available}\, {\rm carbohydrates}\,{\rm portion})\,{\times}100. $$
The overall GI of each test food was calculated as the mean for the whole group.
The GL of a serving of each test food was calculated by the following formula( Reference Wolever 24 ):
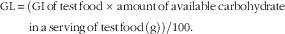 $$\eqalignno{ {\rm GL}\,{\equals}\,&({\rm GI}\,{\rm of}\,{\rm test}\,{\rm food}\,{\times}\,{\rm amount}\,{\rm of}\,{\rm available}\,{\rm carbohydrate}\,\cr & \,{\rm in}\,{\rm a}\, {\rm serving}\,{\rm of}\,{\rm test}\,{\rm food}\,({\rm g}))/100. $$
The serving size of each test foods was taken from the Photographic Atlas of Food Portions for the Emirate of Abu Dhabi( 25 ).
Statistical analysis
A total of fifteen participants or more were used for GI testing of a single food which is more than the minimum requirement recommended by the ISO 26642:2010 standard for GI testing( 26 ). All statistical analyses were performed using Minitab software for Windows version 16 (Minitab Inc.).
Results
The proximate analyses data were expressed as means and standard derivations (Table 3). Information from Table 3 was essential for calculating the amount of available carbohydrate (g/100 g) in each test food.
Proximate analysis of eighteen traditional foods commonly consumed in the United Arab Emirates (g/100 g on a fresh weight basis) (Mean values and standard deviations)

The GI and GL values for all tested foods are given in Table 4. GI values of carbohydrate foods are classified as low (≤55), medium (56–69 inclusive) and high (≥70) GI foods. The four groups of food included in this study (breads, entrée, main and dessert) produced a wide range of GI values ranging from 42 in Harees to 77 in Muhalla bread.
Glycaemic index (GI) and glycaemic load (GL) values of eighteen traditional foods commonly consumed in the UAE (Mean values with their standard deviations and standard errors)

Seven test foods had low GI (Chebab bread, Khameer bread, Harees (beef), Biryani (chicken), Leqemat, Khanfaroosh and Habba Hamra), six were classified as medium GI (Arabic bread, Chami, Machbous (fish), Khabisa, Batheetha and Balalet) and five showed high GI values (Regag bread, Muhalla bread, Fendal, Thareed (beef) and Arseyah).
Discussion
We tested the GI of eighteen traditional Emirati foods, that is five breads, three entrée dishes, five main dishes and five desserts. Among the tested breads, Muhalla bread had the highest GI (mean GI=77) and Khameer bread had the lowest GI (mean GI=47). Of the three entrée dishes tested Fendal was classified as a high-GI food (mean GI=74), Chami as a medium-GI food (mean GI=60) and Habba Hamra as a low-GI food (mean GI=47). Two of the main dishes had a high GI (Thareed and Arseyah), two had a low GI (Harees and Biryani) and one main dish had a medium GI (Machbous). The GI values of sweet dishes tested in the present study ranged from 44 in Leqemat to 67 in Khabisa.
Several factors are known to alter the glycaemic response of food, that is, presence of macronutrients such as fat and protein, type of starch, processing method, and addition of acids, sugars, gelling fibre or amylase inhibitors( Reference Arvidsson-Lenner, Asp and Axelsen 27 ). Other factors include the degree of chewing, concentration of amylase in the gut, presence of other food components in the gut, amount of the insulin response and rate of gastric emptying( Reference Englyst, Veenstra and Hudson 28 ).
Bread is a staple food that is prepared usually by baking a dough of flour (wheat, rye, rice, oat or barley) and water. Two breads were classified as high GI – Regag bread (mean GI=76) and Muhalla bread (mean GI=77) – and the main dish containing bread was also high in GI, that is – beef Thareed (mean GI=74). The 2008 international tables of GI and GL reported a mean GI value of 75 (high) for white wheat bread and 70 (high) for unleavened wheat bread( Reference Atkinson, Foster-Powell and Brand-Miller 18 ). Regag and Muhalla breads are unleavened wheat breads with an increased surface area and thinness leading to an increase in the availability of starch for digestion and therefore higher GI response (mean GI=76 and 77, respectively)( Reference Pfeifer, Lyczkowski and Thiele 29 , Reference Behall, Scholfield and Canary 30 ) compared with white wheat bread. The GI values of Regag and Muhalla breads reported in this study are comparable with the GI value of Tanour bread (mean GI=81) reported by Hassan et al.( Reference Hassan, Elobeid and Kerkadi 31 ). Tanour bread is also a thin type of bread with a large surface area and is usually baked on a crepe oven.
White Arabic wheat bread, also referred to as ‘Lebanese bread’, had a mean GI value of 67 (medium). Similarly, Ali et al. evaluated the GI of eight different types of traditional Omani wheat breads and reported a GI value of 63 (medium) for white Lebanese wheat bread( Reference Ali, Al-Nassri and Al-Rasasi 32 ). The 2008 international tables of GI and GL reported a mean GI value of 57 for white Pita bread. However, Arabic bread and Pita bread are not the same type of bread, as they differ in thickness and size. Other factors like the type of oven used for baking (gas oven or masonry oven), temperature of the oven and the amount of yeast added could affect the GI. Arabic bread loaf tends to be thinner, larger, leavened and baked in a masonry oven. The effect of sourdough fermentation of leavened baked breads on the GI has been previously reported( Reference Liljeberg, Lönner and Björck 33 – Reference Gobbetti, Rizzello and Di Cagno 36 ). The effect of sourdough fermentation on the GI of bread was thought to be due to the synthesis of lactic acid which in turn lowers the rate of starch digestion( Reference Liljeberg, Lönner and Björck 33 ), synthesis of acetic and propionic acids, causing a reduction in the gastric emptying rate( Reference De Angelis, Rizzello and Alfonsi 34 ), or the synthesis/release of amino acids and peptides, resulting in better regulation of glucose metabolism( Reference Novotni, Ćurić and Bituh 35 ). This could explain the lower GI values of Khameer bread (mean GI=47), Chebab bread (mean GI=54) and Arabic bread (mean GI=67) which are considered leavened breads (fermented by yeast) compared with other breads in this study.
Chebab bread and Khameer bread showed low GI values, which might be due to their high protein (7·08 and 10·45 g/100 g, respectively) and fat content (9·07 and 12·69 g/100 g, respectively), and the use of whole-grain wheat flour. Studies suggest that adding fat and protein to foods containing carbohydrates could possibly reduce their glycaemic response and decrease their overall GI( Reference Henry, Lightowler and Kendall 37 , Reference Flint, Moller and Raben 38 ). It has been proposed that protein stimulates greater gastric inhibitory peptide and higher insulin responses, which in turn lowers the postprandial peak of glucose and reduces the glycaemic response of high-GI foods( Reference Hatonen, Virtamo and Eriksson 39 ). High fat content was shown to delay the rate of gastric emptying, thus reducing the rate of glucose digestion and absorption( Reference Henry, Lightowler and Kendall 40 ). Moreover, using whole-grain wheat flour instead of refined wheat flour for the preparation of bread is recommended in order to reduce their high GI values. The presence of dietary fibre in foods could also delay its glycaemic response, as it contributes to slower nutrient absorption and delayed transit time in the small intestines( Reference Wolever, Jenkins and Jenkins 22 , Reference Trinidad, Valdez and Loyola 41 ).
The GI values of sweet potatoes reported in the literature ranged from 44 (low) to 78 (high)( Reference Foster-Powell, Holt and Brand-Miller 17 ) depending on the variety, maturity, cooking method (baking, steaming, roasting, frying or boiling), cutting method (cubing, peeling, mashing or slicing), cooling process and storage conditions (period and temperature)( Reference Fernandes, Velangi and Wolever 42 – Reference Ek, Brand-Miller and Copeland 45 ). In the current study, Fendal (boiled Beauregard sweet potato, red-orange skin and orange flesh) had a GI of 74 (high). Jenkins et al.( Reference Jenkins, Wolever and Taylor 1 ) found that sweet potato from Canada had a GI of 48 while sweet potato (Ipomoea batatas) in Australia had a GI of 44 only( Reference Thorburn and Brand 46 ). However, in New Zealand, Perry et al.( Reference Perry, Mann and Mehalski 47 ) reported a GI of 77 for Kumara (sweet potato)( Reference Perry, Mann and Mehalski 47 ). In contrast, the GI for sweet potato that has been peeled, cubed, boiled (in salted water for 15 min) was 59( Reference Wolever, Katzman-Relle and Jenkins 48 ). According to the 2008 international tables of GI and GL values, the mean GI value for boiled sweet potato is 63( Reference Atkinson, Foster-Powell and Brand-Miller 18 ), however, Fendal is an unpeeled whole Beauregard sweet potato boiled in water with the addition of dates to the boiling water as a sweetener which might explain its high GI. It is recommended to precook potatoes and consume them cold (potato salad, for example) or reheated( Reference Fernandes, Velangi and Wolever 42 , Reference Tahvonen, Hietanen and Sihvonen 49 ), or consuming potatoes with other ingredients such as acetic acid (vinegar)( Reference Liljeberg and Björck 50 ), vinaigrette dressing (vinegar and olive oil added to potato salad)( Reference Leeman, Östman and Björck 51 ) or topping baked potatoes with Cheddar cheese( Reference Henry, Lightowler and Kendall 40 ) to lower its glycaemic response.
Chami is a cottage cheese dish which is highly consumed among the Emirati population on a daily basis as part of breakfast (with bread) or as a snack (with dates), therefore it was essential to measure its GI value. Although Chami is not a major source of carbohydrates, its mean GI value was found to be 60. Another milk-based traditional food is the Habba Hamra, which is prepared by soaking red seeds in hot evaporated milk. The low mean GI of 47 for Habba Hamra was expected, as the literature indicated low GI for full-fat milk, ranging from 11 to 46( Reference Foster-Powell, Holt and Brand-Miller 17 , Reference Atkinson, Foster-Powell and Brand-Miller 18 ).
Rice is the main staple food and energy source for almost half of the world’s population. Hence, it has significant nutrition and health implications. Many studies on rice and rice products led to the conclusion that rice should generally be classified as a high-GI food( Reference Frei, Siddhuraju and Becker 52 – Reference Kaur, Ranawana and Henry 55 ). However, many factors could affect the GI of rice and rice products, including rice variety and starch content (amylose and amylopectin), cooking, processing, cooling, soaking, fibre content and particle size( Reference Kaur, Ranawana and Henry 55 ). Moreover, rice is hardly ever consumed on its own; it is often accompanied with other foods such as pulses, legumes, vegetables, seafood, nuts and meats, which could alter the overall GI of the mixed meal. In this study, Biryani, Machbous and Arseyah (mixed rice dishes (rice with chicken or fish)) were found to have low (52), medium (60) and high (72) GI values. The high protein content in Biryani (11·55 g/100 g) along with added vegetables (onion, garlic and pepper) could explain its low GI. In Sri Lanka, parboiled Mottai Karupan red rice showed a mean GI value of 47 when it was consumed with Amaranthus leaf curry, and 56 for parboiled rice with soya meat gravy( Reference Pirasath, Thayaananthan and Balakumar 56 ). The addition of acidic condiments (vinegar or pickles), emulsifiers, dairy products (milk, cheese and yogurt), vegetables, pulses and viscous fibre seems to decrease the GI of mixed meals containing rice( Reference Kaur, Ranawana and Henry 55 ). High GI value of Arseyah might be due to prolonged cooking (boiling for 2 h) and blending the rice while being cooked. These cooking methods result in increasing the gelatinisation and digestibility( Reference Juansang, Puttanlek and Rungsardthong 57 , Reference Lehmann and Robin 58 ). of rice, as well as having an impact on the glycaemic response of the mixed meal( Reference Kaur, Ranawana and Henry 55 ). Harees is a traditional dish with a porridge-like consistency; it is prepared from whole wheat with meat (beef or chicken)( Reference Habib, Ali and Ibrahim 59 ). The GI value of Harees was the lowest among the traditional dishes studied (mean GI=42) and this could be explained by its high amount of dietary fibre (5·56 g/100 g)( Reference Wolever, Jenkins and Jenkins 22 , Reference Trinidad, Valdez and Loyola 41 ). Similarly, the high fat content in Legemat and Khanfaroosh (22·8 and 30·32 g/100 g, respectively) might be the reason behind their low GI values (mean GI=44 and 45, respectively). Food choice should not solely depend on the GI value of the food, as high fat content – especially saturated fats as in the case of Khanfaroosh and Legemat (13·520 and 9·586 g/100 g, respectively) – defeats the purpose of choosing low-GI foods. Batheetha is a date paste made out of Khalas date fruit mixed with white wheat flour, ghee, sugar, cardamom and cinnamon. Various studies have reported the low GI value of date fruit( Reference Miller, Dunn and Hashim 60 , Reference Alkaabi, Al-Dabbagh and Ahmad 61 ). In 2011, Alkaabi et al.( Reference Alkaabi, Al-Dabbagh and Ahmad 61 ) reported the mean GI of Fara’d, Lulu, Bo ma’an, Dabbas and Khalas dates tested in thirteen healthy individuals to be 54·0, 53·5, 46·3, 49·1 and 55·1, respectively. In the current study, Batheetha was classified as a medium-GI food (59), possibly due to the sugar (sucrose) added during its preparation. Khabisa and Balalet are Emirati sweet dishes that both contain a high amount of white flour and sugar and have a medium GI value (mean GI=67 and 63, respectively). The findings of this study advocate attention to the nutritive value and health aspects of traditional desserts when establishing dietary guidelines for the UAE. Traditional desserts should be consumed in moderation due to their medium to high glycaemic response.
In this study, we have demonstrated that the majority of test foods were classified as high GL, which is expected as most of the test foods had high GI. However, the GL value is dependent on food portion size which tend to vary greatly between countries and even within a country. The results presented here should therefore be used and interpreted with caution. We recommend that dietitians calculate their own GL values using the GI data provided.
A limitation of the current study was purchasing test foods 1 d before the test, and refrigerating them until use. Refrigeration has been suggested to affect the GI of foods through starch retrogradation and the formation of resistance starch, which reduces the amount of starch available for digestion and in turn might reduce the GI of the test foods( Reference Carreira, Lajolo and de Menezes 62 , Reference Burton and Lightowler 63 ).
In conclusion, this study provides GI and GL values of eighteen locally consumed foods in the UAE. Determining the nutritional composition and the glycaemic response of Emirati traditional foods is important and key in assessing the dietary intake of the population which could be useful for health promotion and disease prevention. In addition, these tables could be used as a guide for nutrition therapy planning and dietary management for dietitians in the UAE and other Gulf Cooperation Council (GCC) countries. In addition, knowing the GI and GL values of traditional Emirati foods helps in developing better dietary guidelines and food choices for individuals living with diabetes and/or obesity.
Acknowledgements
The authors wish to thank all those who participated in this study.
The present study was funded by the Science and Technology Program of the Emirates Foundation for Philanthropy (ref. no. 2010/090). The Science and Technology Program of the Emirates Foundation for Philanthropy had no role in the design, analysis or writing of this article.
A. S. A. D. conceived and designed the experiments; M. N. M., E. O. O. analysed the data and reviewed the paper; A. S. A. D. and M. N. M. wrote the paper; A. S. A. D., M. N. M., F. T. A. M. and A. H. J. coordinated data collection; C. J. K. H. and L. C. I. contributed to drafting of the manuscript; C. J. K. H., L. C. I., A. H. J. and E. O. O. contributed to critical revision of the manuscript; A. S. A. D. contributed reagents/materials/analysis tools; all the authors read and approved the final version of the manuscript. None of the authors has any conflicts of interest to declare.


