





1. Introduction
From a bulk rheological perspective, polymer solutions and dense suspensions exhibit remarkably similar behaviour as their respective loading – defined as volume fraction in suspensions and concentration in polymer solutions – increases. The reduced viscosity of suspensions – defined as the ratio between the zero shear-rate viscosity of the suspension to that of the carrier fluid – scales linearly with volume fraction ( $\varPhi$
) in dilute regimes, quadratically in semi-dilute and with higher-order exponents in concentrated regimes (Guazzelli & Pouliquen Reference Guazzelli and Pouliquen2018). A similar trend holds for polymer solutions, such as xanthan gum in water, where the reduced viscosity transitions from linear to quadratic to strongly nonlinear scaling with concentration (Cuvelier & Launay Reference Cuvelier and Launay1986; Wyatt & Liberatore Reference Wyatt and Liberatore2009). This general behaviour extends to many polymer solutions, enabling classical suspension viscosity models to describe them effectively (Rao Reference Rao1993). Beyond zero shear-rate viscosity, both systems transition from Newtonian to shear-thinning to again Newtonian behaviour when traversing from low to moderate shear rates, with the onset of shear thinning shifting to a higher shear rate as loading increases (Milas, Rinaudo & Tinland Reference Milas, Rinaudo and Tinland1985; Stickel & Powell Reference Stickel and Powell2005). However, this rheological similarity has its limitations: whereas polymer solutions will generally maintain a Newtonian behaviour at infinite shear rates (Dakhil, Auhl & Wierschem Reference Dakhil, Auhl and Wierschem2019), suspensions will transition into a shear-thickening regime (Stickel & Powell Reference Stickel and Powell2005).
$\varPhi$
) in dilute regimes, quadratically in semi-dilute and with higher-order exponents in concentrated regimes (Guazzelli & Pouliquen Reference Guazzelli and Pouliquen2018). A similar trend holds for polymer solutions, such as xanthan gum in water, where the reduced viscosity transitions from linear to quadratic to strongly nonlinear scaling with concentration (Cuvelier & Launay Reference Cuvelier and Launay1986; Wyatt & Liberatore Reference Wyatt and Liberatore2009). This general behaviour extends to many polymer solutions, enabling classical suspension viscosity models to describe them effectively (Rao Reference Rao1993). Beyond zero shear-rate viscosity, both systems transition from Newtonian to shear-thinning to again Newtonian behaviour when traversing from low to moderate shear rates, with the onset of shear thinning shifting to a higher shear rate as loading increases (Milas, Rinaudo & Tinland Reference Milas, Rinaudo and Tinland1985; Stickel & Powell Reference Stickel and Powell2005). However, this rheological similarity has its limitations: whereas polymer solutions will generally maintain a Newtonian behaviour at infinite shear rates (Dakhil, Auhl & Wierschem Reference Dakhil, Auhl and Wierschem2019), suspensions will transition into a shear-thickening regime (Stickel & Powell Reference Stickel and Powell2005).
Both media not only share similar rheological behaviour but also show striking parallels in how loading alters turbulence and its coherent structures in wall-bounded and free-shear flows. Dense suspensions exhibit what can be termed as increased ‘levelling out’ with volume fraction: in wall-bounded turbulence, regions that would present with low and high levels of turbulence in an analogous single-phase Newtonian flow respectively exhibit higher or lower turbulence levels, which is attributed to the attenuation of small-scale turbulent coherent structures (Kiger & Pan Reference Kiger and Pan2002; Richter & Sullivan Reference Richter and Sullivan2014; Picano, Breugem & Brandt Reference Picano, Breugem and Brandt2015; Fornari et al. Reference Fornari, Formenti, Picano and Brandt2016; Costa et al. Reference Costa, Picano, Brandt and Breugem2018); or in free-shear flows, features that would appear as a thin shear layer or a tight vortex core with concentrated vorticity and clear boundaries in a single-phase Newtonian flow are now thickened and broadened, with diffused vorticity and unclear boundaries (Zhang & Rival Reference Zhang and Rival2020; Barnes, Zhang & Rival Reference Barnes, Zhang and Rival2024). Polymer solutions exhibit a similar behaviour with increasing concentration: in wall-bounded turbulence, relative to a Newtonian fluid, the turbulent energy spectra reduce and shift towards larger scales, which results in the overall increase in integral length scales and indicates an attenuation of and transition from high-energy small-scale turbulent coherent structures to lower-energy large-scale coherent structures, an observation borne out by coherent-structure visualisations as well (Warholic et al. Reference Warholic, Heist, Katcher and Hanratty2001; Singh, Rudman & Blackburn Reference Singh, Rudman and Blackburn2017; Arosemena et al. Reference Arosemena, Andersson and Solsvik2021a , Reference Arosemena, Andersson, Andersson and Solsvikb ; Saeed & Elbing Reference Saeed and Elbing2023); and, similar to wall-bounded turbulence, free-shear flows also exhibit an attenuation of small-scale flow structures and a transition to larger low-energy flow structures (Guimarães et al. Reference Guimarães, Pimentel, Pinho, Da Silva and Pinho2020, Reference Guimarães, Pinho and Da Silva2025; Barnes, Rosi & Rival Reference Barnes, Rosi and Rival2025). What is unique to polymer solutions is their anisotropic behaviour, typically promoting fluctuations in the streamwise direction due to the unwinding of polymer chains while fluctuations in the stream-normal direction are generally reduced. However, like dense suspensions, polymer solutions also ‘level out’ small-scale high-energy structures into large-scale low-energy structures.
The ‘levelling out’ of turbulence in both media may manifest from a natural tendency to rapidly diffuse vorticity out of vortex cores. Analytical work on suspensions has shown accelerated diffusion of Lamb–Oseen vortices due to particle waves emanating from cores (Druzhinin Reference Druzhinin1994), a finding later verified in simulations (Shuai & Kasbaoui Reference Shuai and Kasbaoui2022) and confirmed experimentally (Zhang & Rival Reference Zhang and Rival2020). While fewer studies have focused on polymer solutions, recent experiments suggest increased vorticity diffusion with concentration, mirroring suspension behaviour (Barnes et al. Reference Barnes, Rosi and Rival2025). Although thicker vortex cores are theoretically less stable (Widnall & Sullivan Reference Widnall and Sullivan1973), experimental observations indicate that vortices in both media can exhibit increased stability, likely because small-scale disturbances are attenuated.
The shared flow behaviour present in both polymer solutions and suspensions emphasises the dominant role of the collective dynamics of the dispersions over the dispersions’ individual characteristics. Whereas ‘individual characteristics’ refers to the specific properties of the dispersion, such as particles in the case of a suspension or flexible chains in the case of a polymer solution, collective dynamics (Stickel & Powell Reference Stickel and Powell2005; Guazzelli & Pouliquen Reference Guazzelli and Pouliquen2018) refers to the complex, emergent behaviour arising from interactions among the dispersion suspended in a fluid. These include hydrodynamic forces, contact forces, Brownian motion and non-hydrodynamic forces. Collective dynamics, which are driven by the degree of loading, describe how relative motion and individual characteristics of the dispersion are influenced by the dispersion itself, and give rise to phenomena like anisotropic organisation, clustering, shear-induced diffusion and modifications to bulk properties such as viscosity and normal stresses. Given the shared rheology and flow behaviour of suspensions and polymer solutions, collective dynamics appear as the primary driver of flow modification in loaded media, despite the distinct characteristics of the dispersions – namely, suspensions composed of particles and polymer solutions composed of flexible chains. However, the parallels described above that arise from the shared collective dynamics between the two flow media do not imply full equivalence between polymer solutions and suspensions. Rather, they raise the question of which aspects of flow modification are governed primarily by loading-driven collective dynamics, and which remain sensitive to the individual characteristics of the dispersed phase.
Nonetheless, the observed similarities between suspension and polymer systems also suggest that, with an appropriately selected polymer, one can reasonably reproduce key aspects of the flow behaviour of a dense suspension, provided both lie within comparable loading regimes. However, which aspects are replicated, and which aspects are not, remain unclear and warrant further investigation, and addressing these distinctions is essential for evaluating the extent to which polymer solutions can serve as useful analogues for suspensions. This approach is especially valuable for flow-field acquisition, as optical techniques fail in opaque suspensions and become unreliable beyond moderate volume fractions (Zhang & Rival Reference Zhang and Rival2018). Advanced imaging methods such as MRI, X-ray or ultrasound can overcome these challenges but require specialised, often cost-prohibitive equipment (Poelma Reference Poelma2017; Aliseda & Heindel Reference Aliseda and Heindel2021). Using polymer analogues as stand-ins provides additional advantages: they are single phase, eliminating the need for specialised pumping systems and simplifying simulations by avoiding multiphase coupling (Brandt & Coletti Reference Brandt and Coletti2022). Polymer analogues have been widely adopted to study cardiovascular flows, where blood acts as a shear-thinning dense suspension composed of roughly 50 % red blood cells in plasma. In these studies, analogue selection has primarily focused on matching the bulk viscosity in steady shear, typically using dilute or low semi-dilute polymer (Deplano et al. Reference Deplano, Knapp, Bailly and Bertrand2014; Li, Walker & Rival Reference Li, Walker and Rival2014; Yi et al. Reference Yi, Yang, Johnson, Bramlage and Ludwig2022). However, selecting analogues solely on a viscosity-matching basis risks missing critical loading-driven collective dynamics, particularly in light of how loading ‘levels out’ turbulence and coherent flow structures.
The preceding discussion suggests that, in order to reproduce any aspects of the flow beyond bulk rheology, a polymer solution should not only exhibit similar rheology but also comparable collective dynamics to that of the suspension. Therefore, using polymer solutions to model dense suspensions is questionable without assessing the extent of their shared collective dynamics. This work directly addresses this concern: we explicitly assess the degree of shared collective dynamics between polymer solutions and dense suspensions by normalising their loadings ( $\varPhi$
or
$\varPhi$
or $c$
) using critical thresholds, thereby mapping both media onto their respective loading spectra and comparing flow-structure modifications along those regimes. This is achieved experimentally by analysing the growth and diffusion of a starting vortex ring generated in each medium across a range of loadings. We hypothesise that such normalisation enables a consistent comparison of coherent-structure modification across both systems, and will reveal that similar loading regimes lead to comparable collective dynamics. However, we acknowledge that individual dispersion characteristics may still influence the flow response, with the primary goal of this work being to assess the limits of collective-dynamic parallels between suspensions and polymer solutions. These insights can inform the design of future experimental analogues and computational models that rely on polymer solutions to emulate dense particulate suspensions in otherwise inaccessible flow scenarios.
$c$
) using critical thresholds, thereby mapping both media onto their respective loading spectra and comparing flow-structure modifications along those regimes. This is achieved experimentally by analysing the growth and diffusion of a starting vortex ring generated in each medium across a range of loadings. We hypothesise that such normalisation enables a consistent comparison of coherent-structure modification across both systems, and will reveal that similar loading regimes lead to comparable collective dynamics. However, we acknowledge that individual dispersion characteristics may still influence the flow response, with the primary goal of this work being to assess the limits of collective-dynamic parallels between suspensions and polymer solutions. These insights can inform the design of future experimental analogues and computational models that rely on polymer solutions to emulate dense particulate suspensions in otherwise inaccessible flow scenarios.
The Introduction continues with a comparison of the loading spectra of suspensions and polymer solutions (§ 1.1), linking shared collective dynamics to underlying individual characteristics. We then discuss how the growth rates of circulation and vortex-core radius in a vortex ring can be interpreted to understand vorticity diffusion in media loaded with either polymer chains or particles (§ 1.2). The Methods section (§ 2) outlines the piston-cylinder apparatus, the hydrogel-bead suspensions and xanthan-gum-in-water solutions tested and the ultrasound velocimetry and post-processing approaches used in this study. Finally, the Results section examines circulation and vortex-core growth rates, establishes scaling for toroidal vorticity, and analyses turbulent kinetic energy to comment on vortex stability, highlighting how similar loading regimes lead to comparable collective dynamics and inform the use of polymer analogues in future studies.
1.1. Loading regimes in suspensions and polymer solutions
Figure 1 illustrates the loading regimes for both suspensions and polymer solutions, with suspensions plotted on the left axis in terms of volume fraction $(\varPhi )$
, and polymer solutions on the right axis in terms of concentration
$(\varPhi )$
, and polymer solutions on the right axis in terms of concentration $(c)$
. It is important to note that the loading-regime estimates along the polymer-solution axis are specific to pure xanthan gum in water.
$(c)$
. It is important to note that the loading-regime estimates along the polymer-solution axis are specific to pure xanthan gum in water.
Loading regimes of suspensions (a) and polymer solutions (b). The concentration estimates that appear for polymers pertain to a pure xanthan-gum-in-water solution.

We begin by examining the loading regimes in suspensions. At extremely low volume fractions, a suspension transitions through one-way ( $\varPhi \lesssim \mathcal{O}(10^{-5})$
) and two-way coupling regimes (
$\varPhi \lesssim \mathcal{O}(10^{-5})$
) and two-way coupling regimes ( $\varPhi \lesssim \mathcal{O}(10^{-3})$
), where the dispersion either provides no feedback to the flow or does so, respectively. This is followed by the suspension entering the four-way coupling regime, where the collective particle dynamics begin to encroach into dynamics driven by individual particle characteristics. Initially, however, interactions driven by the collective dynamics are negligible, resulting in a linear dependence between zero shear-rate viscosity and volume fraction, as predicted by single-sphere rheological models such as the Einstein (Reference Einstein1905) model. When the overlap volume fraction is reached, i.e.
$\varPhi \lesssim \mathcal{O}(10^{-3})$
), where the dispersion either provides no feedback to the flow or does so, respectively. This is followed by the suspension entering the four-way coupling regime, where the collective particle dynamics begin to encroach into dynamics driven by individual particle characteristics. Initially, however, interactions driven by the collective dynamics are negligible, resulting in a linear dependence between zero shear-rate viscosity and volume fraction, as predicted by single-sphere rheological models such as the Einstein (Reference Einstein1905) model. When the overlap volume fraction is reached, i.e. $\varPhi = \varPhi ^* \approx 0.1$
, the distance between particles (
$\varPhi = \varPhi ^* \approx 0.1$
, the distance between particles ( $R_{\textit{PP}}$
) roughly overlaps with the particles’ geometric length scale (
$R_{\textit{PP}}$
) roughly overlaps with the particles’ geometric length scale ( $L_{{P}}$
), marking the point where collective dynamics begin to dominate, which results in quadratic scaling between the zero shear-rate viscosity and volume fraction. Collective-dynamic interactions are initially hydrodynamic but are progressively overtaken by contact forces, which become dominant when the volume fraction exceeds what is termed the critical volume fraction of approximately
$L_{{P}}$
), marking the point where collective dynamics begin to dominate, which results in quadratic scaling between the zero shear-rate viscosity and volume fraction. Collective-dynamic interactions are initially hydrodynamic but are progressively overtaken by contact forces, which become dominant when the volume fraction exceeds what is termed the critical volume fraction of approximately $\varPhi ^{**} \approx 0.4$
. Further increases in
$\varPhi ^{**} \approx 0.4$
. Further increases in $\varPhi$
lead to the dominance of contact phenomena, such as jamming and surface friction, which results in a higher-order scaling between the zero shear-rate viscosity and volume fraction. Finally, the suspension reaches the random close packing limit, which occurs at a volume fraction of
$\varPhi$
lead to the dominance of contact phenomena, such as jamming and surface friction, which results in a higher-order scaling between the zero shear-rate viscosity and volume fraction. Finally, the suspension reaches the random close packing limit, which occurs at a volume fraction of $\varPhi _{\textit{RP}} \approx 0.64$
for monodisperse spheres (Elghobashi Reference Elghobashi1991; Stickel & Powell Reference Stickel and Powell2005; Guazzelli & Pouliquen Reference Guazzelli and Pouliquen2018; Brandt & Coletti Reference Brandt and Coletti2022).
$\varPhi _{\textit{RP}} \approx 0.64$
for monodisperse spheres (Elghobashi Reference Elghobashi1991; Stickel & Powell Reference Stickel and Powell2005; Guazzelli & Pouliquen Reference Guazzelli and Pouliquen2018; Brandt & Coletti Reference Brandt and Coletti2022).
We now examine how the rheological behaviour of a polymer solution evolves across its characteristic loading regimes. With increasing concentration, polymer solutions exhibit behaviours akin to suspensions, as the relationship between concentration and flow characteristics follows similar trends. Polymers can be modelled as chains of electrostatic ‘blobs’ of length $L_{{C}}$
, comprising repeating monomers, with each chain creating an electric field screened by other polymer molecules and counter-ions at an electrostatic screening distance
$L_{{C}}$
, comprising repeating monomers, with each chain creating an electric field screened by other polymer molecules and counter-ions at an electrostatic screening distance $r_{\textit{scr}}$
. At very low concentrations, polymer chains are far enough apart that
$r_{\textit{scr}}$
. At very low concentrations, polymer chains are far enough apart that $r_{\textit{scr}}$
extends beyond the chain-to-chain distance
$r_{\textit{scr}}$
extends beyond the chain-to-chain distance $R_{\textit{CC}}$
, meaning the chains act in isolation and maintain a rod-like shape. This persists until the interaction concentration
$R_{\textit{CC}}$
, meaning the chains act in isolation and maintain a rod-like shape. This persists until the interaction concentration $c_{\textit{int}}$
, where individual inter-chain interactions start to encroach on collective intra-chain forces as
$c_{\textit{int}}$
, where individual inter-chain interactions start to encroach on collective intra-chain forces as $r_{\textit{scr}}$
shrinks to the scale of
$r_{\textit{scr}}$
shrinks to the scale of $R_{\textit{CC}}$
. This transition is analogous to the four-way coupling regime in suspensions where collective particle dynamics emerge. Here, chains increasingly influence one another’s behaviour rather than responding independently to the flow. However, as in suspensions, collective dynamics remain less dominant within the dilute regime, with the solution exhibiting linear scaling between the zero shear-rate viscosity and the concentration. This is true until the overlap concentration
$R_{\textit{CC}}$
. This transition is analogous to the four-way coupling regime in suspensions where collective particle dynamics emerge. Here, chains increasingly influence one another’s behaviour rather than responding independently to the flow. However, as in suspensions, collective dynamics remain less dominant within the dilute regime, with the solution exhibiting linear scaling between the zero shear-rate viscosity and the concentration. This is true until the overlap concentration $c^*$
, where
$c^*$
, where $R_{\textit{CC}} \approx L_{{C}}$
, marking the onset of the semi-dilute regime. Here, collective chain interactions become more significant, primarily through hydrodynamics and electrostatic effects, and like in suspensions, the scaling between the zero shear-rate viscosity and concentration is quadratic. Beyond
$R_{\textit{CC}} \approx L_{{C}}$
, marking the onset of the semi-dilute regime. Here, collective chain interactions become more significant, primarily through hydrodynamics and electrostatic effects, and like in suspensions, the scaling between the zero shear-rate viscosity and concentration is quadratic. Beyond $c^*$
,
$c^*$
, $r_{\textit{scr}}$
compresses to less than the chain length
$r_{\textit{scr}}$
compresses to less than the chain length $L_{{C}}$
, increasing chain flexibility and enhancing the collective chain dynamics. However, contact forces remain negligible until later concentrations, particularly at the entanglement concentration
$L_{{C}}$
, increasing chain flexibility and enhancing the collective chain dynamics. However, contact forces remain negligible until later concentrations, particularly at the entanglement concentration $c_{{e}}$
, which sees the onset of network formation, followed by
$c_{{e}}$
, which sees the onset of network formation, followed by $c^{**}$
, where maximal chain flexibility is reached by the polymers. Like with suspensions, contact forces between the polymer chains become more significant, resulting in a higher-order scaling between the zero shear-rate viscosity and concentration. This continues until the gel point
$c^{**}$
, where maximal chain flexibility is reached by the polymers. Like with suspensions, contact forces between the polymer chains become more significant, resulting in a higher-order scaling between the zero shear-rate viscosity and concentration. This continues until the gel point $c_{\textit{gp}}$
, where the solution has gelled into an ‘infinite macromolecule’, practically behaving like a solid. It is important to note that while
$c_{\textit{gp}}$
, where the solution has gelled into an ‘infinite macromolecule’, practically behaving like a solid. It is important to note that while $c^*$
and
$c^*$
and $c_e$
are widely recognised,
$c_e$
are widely recognised, $c^{**}$
is not always explicitly identified, particularly in non-polar systems where electrostatic screening is far less pronounced, making these transitions more gradual. The degree of chain polarity plays a key role in the severity of the change: highly polar polymers exhibit stronger electrostatic effects and rod-like behaviour at low concentrations, with sharper transitions as screening length scales evolve. Less polar or screened systems exhibit smoother rheological changes, although signatures of a contact-dominated regime at what could be considered
$c^{**}$
is not always explicitly identified, particularly in non-polar systems where electrostatic screening is far less pronounced, making these transitions more gradual. The degree of chain polarity plays a key role in the severity of the change: highly polar polymers exhibit stronger electrostatic effects and rod-like behaviour at low concentrations, with sharper transitions as screening length scales evolve. Less polar or screened systems exhibit smoother rheological changes, although signatures of a contact-dominated regime at what could be considered $c^{**}$
persist (Cuvelier & Launay Reference Cuvelier and Launay1986; Dobrynin, Colby & Rubinstein Reference Dobrynin, Colby and Rubinstein1995; Wyatt & Liberatore Reference Wyatt and Liberatore2009; Nsengiyumva & Alexandridis Reference Nsengiyumva and Alexandridis2022).
$c^{**}$
persist (Cuvelier & Launay Reference Cuvelier and Launay1986; Dobrynin, Colby & Rubinstein Reference Dobrynin, Colby and Rubinstein1995; Wyatt & Liberatore Reference Wyatt and Liberatore2009; Nsengiyumva & Alexandridis Reference Nsengiyumva and Alexandridis2022).
Despite the clear parallels, there are limitations to the analogy between suspensions and polymers. The first is structural differences – chains versus particles – leading to entanglement in polymer solutions, which is absent in suspensions. However, this limitation also exists in independent formulations for each medium – suspensions are not all composed of perfect spheres, and polymers are not necessarily simple chains (Dobrynin et al. Reference Dobrynin, Colby and Rubinstein1995; Guazzelli & Pouliquen Reference Guazzelli and Pouliquen2018). A second limitation is the effect of polarity in polymer solutions, which is negligible in non-electrorheological suspensions. Polarity effects become less significant in strong solvents and even more so in the presence of an ionic solution, as the inherent charges within such solutions screen the polymer charges making the chains far more compliant (Cuvelier & Launay Reference Cuvelier and Launay1986; Wyatt & Liberatore Reference Wyatt and Liberatore2009). Finally, while both jamming in suspensions and gelling in polymer solutions represent a transition to a solid-like state in each medium, the underlying mechanisms are fundamentally different: jamming arises from the formation of dense, mechanically arrested particle clusters held together by enduring contacts (Stickel & Powell Reference Stickel and Powell2005; Hogendoorn et al. Reference Hogendoorn, Breugem, Frank, Bruschewski, Grundmann and Poelma2023), whereas gelling occurs through the formation of a system-spanning polymer network mediated by chain connections and entanglements (Stauffer et al. Reference Stauffer, Coniglio and Adam1982). Despite these limitations, parallels in the evolution of the collective dynamics across the loading spectra of both media suggest that a polymer analogue’s loading factor should reflect that of the target suspension to accurately capture its collective particle dynamics.
The parameters $\varPhi _{\textit{RP}}$
and
$\varPhi _{\textit{RP}}$
and $c_{\textit{gp}}$
represent natural maxima for normalising the loading factor in their respective media. However, no definitive value exists for either. In the case of suspensions, the value of
$c_{\textit{gp}}$
represent natural maxima for normalising the loading factor in their respective media. However, no definitive value exists for either. In the case of suspensions, the value of $\varPhi _{\textit{RP}}$
can range from 0.56 to 0.64, depending on the packing method (Guazzelli & Pouliquen Reference Guazzelli and Pouliquen2018). The determination of
$\varPhi _{\textit{RP}}$
can range from 0.56 to 0.64, depending on the packing method (Guazzelli & Pouliquen Reference Guazzelli and Pouliquen2018). The determination of $c_{\textit{gp}}$
for a polymer solution is even more challenging, both analytically and experimentally, as it is a transitional process that occurs over orders of concentration (Stauffer et al. Reference Stauffer, Coniglio and Adam1982; Carnali Reference Carnali1992). In contrast, concentrations that divide the dilute, semi-dilute and concentrated regimes of polymer solutions are more easily identifiable through clear and repeatable rheological changes with increasing concentration (Cuvelier & Launay Reference Cuvelier and Launay1986; Meyer et al. Reference Meyer, Fuller, Clark and Kulicke1993; Wyatt & Liberatore Reference Wyatt and Liberatore2009; de Moura & Moreno Reference de Moura and Moreno2019; Nsengiyumva & Alexandridis Reference Nsengiyumva and Alexandridis2022). Given the challenges in estimating these maxima, particularly for
$c_{\textit{gp}}$
for a polymer solution is even more challenging, both analytically and experimentally, as it is a transitional process that occurs over orders of concentration (Stauffer et al. Reference Stauffer, Coniglio and Adam1982; Carnali Reference Carnali1992). In contrast, concentrations that divide the dilute, semi-dilute and concentrated regimes of polymer solutions are more easily identifiable through clear and repeatable rheological changes with increasing concentration (Cuvelier & Launay Reference Cuvelier and Launay1986; Meyer et al. Reference Meyer, Fuller, Clark and Kulicke1993; Wyatt & Liberatore Reference Wyatt and Liberatore2009; de Moura & Moreno Reference de Moura and Moreno2019; Nsengiyumva & Alexandridis Reference Nsengiyumva and Alexandridis2022). Given the challenges in estimating these maxima, particularly for $c_{\textit{gp}}$
, loading factors are normalised here by their respective transitions into the contact-dominated concentrated regime, i.e.
$c_{\textit{gp}}$
, loading factors are normalised here by their respective transitions into the contact-dominated concentrated regime, i.e. $\hat {\varPhi } = \varPhi / \varPhi ^{**}$
for dense suspensions, or
$\hat {\varPhi } = \varPhi / \varPhi ^{**}$
for dense suspensions, or $\hat {c} = c / c^{**}$
for polymer chains. The critical loading factors
$\hat {c} = c / c^{**}$
for polymer chains. The critical loading factors $\varPhi ^{**}$
and
$\varPhi ^{**}$
and $c^{**}$
used here are taken from the literature and were not measured directly for the suspensions and polymer solutions investigated in this study. Specifically, for normalisation, the suspension volume fraction
$c^{**}$
used here are taken from the literature and were not measured directly for the suspensions and polymer solutions investigated in this study. Specifically, for normalisation, the suspension volume fraction $\varPhi ^{**}$
is taken as 0.4 following Guazzelli & Pouliquen (Reference Guazzelli and Pouliquen2018), while the critical concentration
$\varPhi ^{**}$
is taken as 0.4 following Guazzelli & Pouliquen (Reference Guazzelli and Pouliquen2018), while the critical concentration $c^{**}$
for xanthan-gum solutions is set at 2000 ppm, consistent with rheological studies identifying this as the onset of the concentrated regime (Meyer et al. Reference Meyer, Fuller, Clark and Kulicke1993; Wyatt & Liberatore Reference Wyatt and Liberatore2009; Dakhil et al. Reference Dakhil, Auhl and Wierschem2019; de Moura & Moreno Reference de Moura and Moreno2019).
$c^{**}$
for xanthan-gum solutions is set at 2000 ppm, consistent with rheological studies identifying this as the onset of the concentrated regime (Meyer et al. Reference Meyer, Fuller, Clark and Kulicke1993; Wyatt & Liberatore Reference Wyatt and Liberatore2009; Dakhil et al. Reference Dakhil, Auhl and Wierschem2019; de Moura & Moreno Reference de Moura and Moreno2019).
The critical loadings ( $\varPhi ^{**}$
for suspensions and
$\varPhi ^{**}$
for suspensions and $c^{**}$
for polymer solutions) are introduced here not as fitting parameters, but as physically meaningful thresholds marking the onset of contact-dominated collective dynamics. Here, ‘contact dominated’ refers to the dominance of local interaction constraints in momentum transport, not to geometric space filling by the dispersed phase. Beyond these loadings, the rheological response is governed primarily by direct particle contacts in suspensions and by interchain entanglements in polymer solutions, while long-range hydrodynamic or electrostatic interactions become secondary. Although the microscopic mechanisms differ – jamming via frictional particle contacts in suspensions versus chain entanglement in polymer solutions – both systems undergo a transition to regimes in which relative motion within the dispersed phase is constrained predominantly by contact interactions. Normalising loading by
$c^{**}$
for polymer solutions) are introduced here not as fitting parameters, but as physically meaningful thresholds marking the onset of contact-dominated collective dynamics. Here, ‘contact dominated’ refers to the dominance of local interaction constraints in momentum transport, not to geometric space filling by the dispersed phase. Beyond these loadings, the rheological response is governed primarily by direct particle contacts in suspensions and by interchain entanglements in polymer solutions, while long-range hydrodynamic or electrostatic interactions become secondary. Although the microscopic mechanisms differ – jamming via frictional particle contacts in suspensions versus chain entanglement in polymer solutions – both systems undergo a transition to regimes in which relative motion within the dispersed phase is constrained predominantly by contact interactions. Normalising loading by $\varPhi ^{**}$
and
$\varPhi ^{**}$
and $c^{**}$
therefore maps both media onto an analogous collective-dynamics spectrum, enabling meaningful comparison across systems with fundamentally different microstructures.
$c^{**}$
therefore maps both media onto an analogous collective-dynamics spectrum, enabling meaningful comparison across systems with fundamentally different microstructures.
1.2. Vorticity diffusion and core spreading in loaded vortex rings
A vortex ring represents a simple canonical-flow structure whose behaviour in isolation can provide a lens into flow-structure behaviour in more complex flow environments. Thus, by characterising the similarities in how a vortex ring modifies in response to changes in loading in suspensions or polymer solutions, we can establish a foothold into understanding the shared collective dynamics between the flow media – insights that can be extended to more challenging flow scenarios. This motivates the following section, which uses the vorticity transport equation to examine how vortex rings respond to medium loading (i.e. $\varPhi$
or
$\varPhi$
or $c$
) and to gain insight into coherent-structure behaviour in complex media.
$c$
) and to gain insight into coherent-structure behaviour in complex media.
Key variables of a starting vortex ring generated by a piston-cylinder system in a suspension or polymer solution. The piston of diameter $D$
moves at velocity
$D$
moves at velocity $u_{{p}}$
, producing a vortex ring that convects at
$u_{{p}}$
, producing a vortex ring that convects at $u_{{p}} \approx u_{{c}}$
with radius
$u_{{p}} \approx u_{{c}}$
with radius $R \approx ( {1}/{2})D$
. The ring, described in a Frenet frame
$R \approx ( {1}/{2})D$
. The ring, described in a Frenet frame $(s, r, \theta )$
, is fed toroidal vorticity
$(s, r, \theta )$
, is fed toroidal vorticity $\omega _s$
from the shear layer at a rate
$\omega _s$
from the shear layer at a rate $\dot {\varSigma }_{\omega _s}$
, modified by suspended particles or polymer chains at a rate
$\dot {\varSigma }_{\omega _s}$
, modified by suspended particles or polymer chains at a rate $\dot {\varSigma }_{\textit{sus/pol}}$
, resulting in a toroidal circulation
$\dot {\varSigma }_{\textit{sus/pol}}$
, resulting in a toroidal circulation $\varGamma$
. Figure adapted after Fernando & Rival (Reference Fernando and Rival2016a).
$\varGamma$
. Figure adapted after Fernando & Rival (Reference Fernando and Rival2016a).

Figure 2 depicts an axisymmetric vortex ring forming downstream of a piston cylinder within a Frenet coordinate framework that convects with the ring: $s$
represents an arclength along the vortex ring’s filament;
$s$
represents an arclength along the vortex ring’s filament; $r$
is the radially outward distance from the filament;
$r$
is the radially outward distance from the filament; $\theta$
is an angular coordinate that spins about the
$\theta$
is an angular coordinate that spins about the $s$
axis; and
$s$
axis; and $t$
is time. The convective velocity of the vortex ring
$t$
is time. The convective velocity of the vortex ring $(u_{{c}})$
is approximated as the velocity of the piston cylinder
$(u_{{c}})$
is approximated as the velocity of the piston cylinder $(u_{{p}})$
, while the radial distance
$(u_{{p}})$
, while the radial distance $R$
from the ring’s centre to the filament line is estimated as half the piston cylinder’s diameter,
$R$
from the ring’s centre to the filament line is estimated as half the piston cylinder’s diameter, $({1}/{2})D$
. It is further assumed that the vortex core is sufficiently slender such that
$({1}/{2})D$
. It is further assumed that the vortex core is sufficiently slender such that $R+r\approx R$
within the core, and that the convective velocity is far smaller than poloidal velocity, i.e.
$R+r\approx R$
within the core, and that the convective velocity is far smaller than poloidal velocity, i.e. $||u_{{\theta }}|| - ||u_{{c}}|| \approx ||u_{{\theta }}||$
. In addition, we assume that the shear layer emanating from the piston cylinder provides a source of primarily toroidal vorticity, i.e.
$||u_{{\theta }}|| - ||u_{{c}}|| \approx ||u_{{\theta }}||$
. In addition, we assume that the shear layer emanating from the piston cylinder provides a source of primarily toroidal vorticity, i.e. $\dot {\varSigma }_{\omega _s}\gg \dot {\varSigma }_{\omega _r}\approx \dot {\varSigma }_{\omega _\theta }\approx 0$
, and that this toroidal vorticity significantly outweighs other components of vorticity, i.e.
$\dot {\varSigma }_{\omega _s}\gg \dot {\varSigma }_{\omega _r}\approx \dot {\varSigma }_{\omega _\theta }\approx 0$
, and that this toroidal vorticity significantly outweighs other components of vorticity, i.e. $\omega _{s}\gg \omega _{r}\approx \omega _{\theta }\approx 0$
. With these assumptions, and in the case of a Newtonian fluid, the vortex transport equations simplify to a single equation describing the transport of toroidal vorticity
$\omega _{s}\gg \omega _{r}\approx \omega _{\theta }\approx 0$
. With these assumptions, and in the case of a Newtonian fluid, the vortex transport equations simplify to a single equation describing the transport of toroidal vorticity
 \begin{align} {\dfrac {\partial \omega _{s}}{\partial t}}_{{newt}} = \nu \left ( \dfrac {1}{r} \dfrac {\partial }{\partial r} \left (r \dfrac {\partial \omega _{s}}{\partial r}\right )\right ) + \dot {\varSigma }_{\omega _s}, \end{align}
where $\dot {\varSigma }_{\omega _s}$
is the toroidal-vorticity feeding rate from the shear layer. If we integrate the result over sufficiently large area (
$\dot {\varSigma }_{\omega _s}$
is the toroidal-vorticity feeding rate from the shear layer. If we integrate the result over sufficiently large area ( $A$
) and apply the fundamental theorem of calculus to the viscous diffusion term, we find the following expression for circulation (
$A$
) and apply the fundamental theorem of calculus to the viscous diffusion term, we find the following expression for circulation ( $\varGamma$
):
$\varGamma$
):
 \begin{align} {\dfrac {\partial \varGamma }{\partial t}}_{{newt}} = \int \dot {\varSigma }_{\omega _s} {\rm d}A. \end{align}
The equation states that the rate at which circulation increases within the toroidal plane is equal to the net rate at which vorticity is fed into the plane, a classical result for starting vortices prior to pinch-off (Nitsche Reference Nitsche1996; Gharib, Rambod & Shariff Reference Gharib, Rambod and Shariff1998) that bears out across a wide range of feeding protocols and Reynolds numbers (Fernando & Rival Reference Fernando and Rival2016b ; Rosi & Rival Reference Rosi and Rival2017).
The Newtonian toroidal-vorticity transport equation can be made to incorporate the effect of suspended particles or polymer chains through the addition of a vorticity source term. This is done respectively for suspensions and polymer solutions in (1.3) and (1.4)
 \begin{align} {\dfrac {\partial \omega _{s}}{\partial t}}_{\textit{sus}} = \nu \left ( \dfrac {1}{r} \dfrac {\partial }{\partial r} \left (r \dfrac {\partial \omega _{s}}{\partial r}\right )\right ) + \dot {\varSigma }_{\omega _s}+\left [\boldsymbol{\nabla }\times \left (\dfrac {1}{\rho }\boldsymbol{f}_{\kern-0.5pt\textit{sus}}\right )\right ]_s, \\[-28pt] \nonumber \end{align}
 \begin{align} {\dfrac {\partial \omega _{s}}{\partial t}}_{\textit{pol}} = \nu \left ( \dfrac {1}{r} \dfrac {\partial }{\partial r} \left (r \dfrac {\partial \omega _{s}}{\partial r}\right )\right ) + \dot {\varSigma }_{\omega _s}+\left [\boldsymbol{\nabla }\times \left (\dfrac {1}{\rho }\boldsymbol{\nabla }\boldsymbol{\cdot }\tau _{ {pol}}\right )\right ]_s. \\[0pt] \nonumber \end{align}
In the case of suspensions, the additional source term captures the momentum exchange between the fluid and particles that manifests through $\boldsymbol{f}_{\kern-0.5pt\textit{sus}}$
, which is the fluid–particle net force per volume at a point. In the case of polymer solutions, the additional source term captures the effect of a polymer solution’s extra stress tensor (
$\boldsymbol{f}_{\kern-0.5pt\textit{sus}}$
, which is the fluid–particle net force per volume at a point. In the case of polymer solutions, the additional source term captures the effect of a polymer solution’s extra stress tensor ( $\tau _{\textit{pol}}$
). By capturing the effect of loading in either medium through an additional term, we avoid lumping the effect with the viscous diffusion term. This eliminates the need for an effective viscosity and preserves the viscosity of the carrier phase,
$\tau _{\textit{pol}}$
). By capturing the effect of loading in either medium through an additional term, we avoid lumping the effect with the viscous diffusion term. This eliminates the need for an effective viscosity and preserves the viscosity of the carrier phase, $\nu$
, within the equations.
$\nu$
, within the equations.
Like before, we can integrate over a sufficiently large area domain, thereby eliminating the viscous diffusion term in both (1.3) and (1.4), resulting in (1.5) and (1.6) for suspensions and polymer solutions, respectively,
 \begin{align} {\dfrac {\partial \varGamma }{\partial t}}_{\textit{sus}} = \int \dot {\varSigma }_{\omega _s} {\rm d}A + \int \left [\boldsymbol{\nabla }\times \left (\dfrac {1}{\rho }\boldsymbol{f}_{\kern-0.5pt\textit{sus}}\right )\right ]_s {\rm d}A = \int \dot {\varSigma }_{\omega _s} {\rm d}A + \int \dot {\varSigma }_{{{sus}}} {\rm d}A, \\[-28pt] \nonumber \end{align}
 \begin{align} {\dfrac {\partial \varGamma }{\partial t}}_{\textit{pol}} = \int \dot {\varSigma }_{\omega _s} {\rm d}A +\int \left [\boldsymbol{\nabla }\times \left (\dfrac {1}{\rho }\boldsymbol{\nabla }\boldsymbol{\cdot }\tau _{\textit{pol}}\right )\right ]_s {\rm d}A = \int \dot {\varSigma }_{\omega _s} {\rm d}A + \int \dot {\varSigma }_{{{pol}}} {\rm d}A. \\[0pt] \nonumber \end{align}
Dividing (1.5) and (1.6) by (1.2) provides the following result:
 \begin{align} \left . {\dfrac {\partial \varGamma }{\partial t}}_{\textit{sus/pol}} \ \middle / \ {\dfrac {\partial \varGamma }{\partial t}}_{{newt}} \right . = 1 + \left . \int \dot {\varSigma }_{{ {sus/pol}}} {\rm d}A \ \middle / \ \int \dot {\varSigma }_{{\omega _s}} {\rm d}A \right. . \end{align}
Using the roll-up of an infinite vortex sheet off of a semi-infinite plate as an idealisation of a starting-jet vortex, Nitsche (Reference Nitsche1996) showed that non-dimensional circulation $\varGamma ^*=({1}/{2})\varGamma /(u_{{c}}R)$
of a starting-jet vortex scales with non-dimensional time
$\varGamma ^*=({1}/{2})\varGamma /(u_{{c}}R)$
of a starting-jet vortex scales with non-dimensional time $t^*=({1}/{2})u_{{c}}t/R$
such that
$t^*=({1}/{2})u_{{c}}t/R$
such that $\varGamma ^*\sim a_\varGamma t^{* \ 1/3}$
. However, Nitsche (Reference Nitsche1996) derives their scalings only for the initial vortex-sheet roll-up near the tube edge, and is valid only for very small piston strokes before downstream translation of the vortex begins. In contrast, the analysis by Gharib et al. (Reference Gharib, Rambod and Shariff1998), which integrates the vorticity flux emanating from the shear layer by assuming a linear profile that spans from zero at the piston wall to
$\varGamma ^*\sim a_\varGamma t^{* \ 1/3}$
. However, Nitsche (Reference Nitsche1996) derives their scalings only for the initial vortex-sheet roll-up near the tube edge, and is valid only for very small piston strokes before downstream translation of the vortex begins. In contrast, the analysis by Gharib et al. (Reference Gharib, Rambod and Shariff1998), which integrates the vorticity flux emanating from the shear layer by assuming a linear profile that spans from zero at the piston wall to $u_c$
at the shear-layer edge, demonstrates that
$u_c$
at the shear-layer edge, demonstrates that $\varGamma ^*\sim a_\varGamma t^{*}$
. Using the formulation from Gharib et al. (Reference Gharib, Rambod and Shariff1998), (1.7) can be written as the following:
$\varGamma ^*\sim a_\varGamma t^{*}$
. Using the formulation from Gharib et al. (Reference Gharib, Rambod and Shariff1998), (1.7) can be written as the following:
 \begin{align} (a / a_{0})_{\varGamma ^*} = 1+\lambda _\varGamma , \end{align}
where the left-hand side represents the ratio of circulation growth-rate coefficients between the complex fluid ( $a_{\varGamma ^*}$
) and the non-loaded case (
$a_{\varGamma ^*}$
) and the non-loaded case ( $a_{\varGamma ^*_0}$
). Equations (1.7) and (1.8) indicate that any difference between circulation growth rates of a suspension or polymer solution and its Newtonian counterpart must be caused by the net out-of-plane transfer of circulation caused by the suspended particles or the polymer chains. Conversely, the result also indicates that if the circulation growth rates for a suspension or a polymer solution matches that of a Newtonian fluid, then the out-of-plane transfer of circulation caused by the presence of suspended particles or polymer chains is negligible. In light of this result, circulation rates within suspensions and polymer solutions across broad loading regimes are experimentally measured and compared with the corresponding Newtonian case to evaluate the effect of out-of-plane circulation contributions in these complex media.
$a_{\varGamma ^*_0}$
). Equations (1.7) and (1.8) indicate that any difference between circulation growth rates of a suspension or polymer solution and its Newtonian counterpart must be caused by the net out-of-plane transfer of circulation caused by the suspended particles or the polymer chains. Conversely, the result also indicates that if the circulation growth rates for a suspension or a polymer solution matches that of a Newtonian fluid, then the out-of-plane transfer of circulation caused by the presence of suspended particles or polymer chains is negligible. In light of this result, circulation rates within suspensions and polymer solutions across broad loading regimes are experimentally measured and compared with the corresponding Newtonian case to evaluate the effect of out-of-plane circulation contributions in these complex media.
Returning to the simplified toroidal-vorticity transport equation, it can be further simplified if we limit our analysis to the vicinity of the vortex core, i.e. $r\rightarrow 0$
. Here, it is safe to assume that vorticity reaches a maximum such that the derivative of toroidal vorticity with respect to
$r\rightarrow 0$
. Here, it is safe to assume that vorticity reaches a maximum such that the derivative of toroidal vorticity with respect to $r$
is zero, and that vorticity is quasi-steady if
$r$
is zero, and that vorticity is quasi-steady if $t^*\gg 0$
. In this case, the vorticity transport equation for a Newtonian fluid simplifies to
$t^*\gg 0$
. In this case, the vorticity transport equation for a Newtonian fluid simplifies to
 \begin{align} \frac {\partial \omega _s}{\partial t} = \frac {\nu }{r} \left ( \frac {\partial \omega _s}{\partial r} + r \frac {\partial ^2 \omega _s}{\partial r^2} \right ) + \dot {\varSigma }_{\omega _s} \rightarrow \nu \left .\frac {\partial ^2 \omega _s}{\partial r^2} \right |_{\substack {{newt} \\ r = 0}} \approx -\dot {\varSigma }_{\omega _s} . \end{align}
This core-limit reduction is consistent with classical analyses of viscous vorticity diffusion in axisymmetric vortices (Lamb Reference Lamb1932; Batchelor Reference Batchelor1967). In the case of a suspension or polymer solution, the same process results in (1.10)
 \begin{align} {\nu } \left .\frac {\partial ^2 \omega _s}{\partial r^2} \right |_{\substack {{sus/pol} \\ r = 0}} \approx -\dot {\varSigma }_{\omega _s} - \dot {\varSigma }_{{{sus/pol}}}. \end{align}
It is reiterated here that $\nu$
denotes the kinematic viscosity of the carrier fluid alone; particle- or polymer-induced transport effects are captured exclusively through the additional vorticity source terms, i.e.
$\nu$
denotes the kinematic viscosity of the carrier fluid alone; particle- or polymer-induced transport effects are captured exclusively through the additional vorticity source terms, i.e. $\dot {\varSigma }_{\textit{sus/pol}}$
. Equation (1.10) shows that the steepness of the vorticity gradient in the vicinity of the core is determined by the accumulation of two factors: the vorticity feeding rate (first term), a positive definite value that augments the downward concavity of the radial vorticity distribution thereby steepening the vortex-core boundary; and the source term associated with suspended-particle or polymer-chain interactions. Precisely speaking, the second term can be either a local source or sink of vorticity. However, as discussed in the Introduction, by and large, loading the medium causes a diffusion of coherent structures and a transition to larger flow scales, a result that suggests that the second tends to function as a sink within the vicinity of the vortex core, thereby attenuating the downward concavity of the vorticity distribution and relaxing the vortex-core boundary.
$\dot {\varSigma }_{\textit{sus/pol}}$
. Equation (1.10) shows that the steepness of the vorticity gradient in the vicinity of the core is determined by the accumulation of two factors: the vorticity feeding rate (first term), a positive definite value that augments the downward concavity of the radial vorticity distribution thereby steepening the vortex-core boundary; and the source term associated with suspended-particle or polymer-chain interactions. Precisely speaking, the second term can be either a local source or sink of vorticity. However, as discussed in the Introduction, by and large, loading the medium causes a diffusion of coherent structures and a transition to larger flow scales, a result that suggests that the second tends to function as a sink within the vicinity of the vortex core, thereby attenuating the downward concavity of the vorticity distribution and relaxing the vortex-core boundary.
If the distribution of toroidal vorticity in the radial direction is described by a Gaussian distribution, i.e. a Lamb–Oseen vortex
 \begin{align} \omega _s(r)=\dfrac {\varGamma }{\pi r_{\textit{core}}^2}e^{-r^2/r_{\textit{core}}^2} , \end{align}
then its second derivative in the vicinity of the core should be well described by
 \begin{align} \left .\frac {\partial ^2 \omega _s}{\partial r^2} \right |_{\substack {r = 0}} \approx -\dfrac {2\varGamma }{\pi r_{\textit{core}}^4}, \end{align}
where $r_{\textit{core}}$
is the Gaussian standard distribution of the toroidal vorticity in the radial direction, and is representative of the vortex-core radius. Using the same vortex-sheet model, Nitsche (Reference Nitsche1996) finds that the distance from the core centre to the final orbit of the vortex sheet, which is taken as the vortex radius (
$r_{\textit{core}}$
is the Gaussian standard distribution of the toroidal vorticity in the radial direction, and is representative of the vortex-core radius. Using the same vortex-sheet model, Nitsche (Reference Nitsche1996) finds that the distance from the core centre to the final orbit of the vortex sheet, which is taken as the vortex radius ( $r_{\textit{core}}^*=r_{\textit{core}}/D$
), scales as
$r_{\textit{core}}^*=r_{\textit{core}}/D$
), scales as $r_{\textit{core}}^*\sim a_{r_{\textit{core}}} t^{* \ 2/3}$
. However, as per reasons outlined above, the scaling laws from Nitsche (Reference Nitsche1996) are not appropriate for the problem at hand. Unfortunately, scaling laws for the vortex core during the formation process are challenging to find within the literature. Nonetheless, experiments by Tinaikar, Advaith & Basu (Reference Tinaikar, Advaith and Basu2018) and by Ortega-Chavez, Gan & Gaskell (Reference Ortega-Chavez, Gan and Gaskell2023), which explored starting-jet vortex rings with circulation-based Reynolds numbers ranging from 100 to 7500, suggest that the core radius exhibits a linear trend during formation – essentially proportional to the mass of the rotational fluid accepted from the shear layer – followed by power-law scaling with a reduced slope beyond formation, where the starting vortex grows primarily due to vorticity diffusion. Thus, assuming a linear growth rate during the formation phase such that
$r_{\textit{core}}^*\sim a_{r_{\textit{core}}} t^{* \ 2/3}$
. However, as per reasons outlined above, the scaling laws from Nitsche (Reference Nitsche1996) are not appropriate for the problem at hand. Unfortunately, scaling laws for the vortex core during the formation process are challenging to find within the literature. Nonetheless, experiments by Tinaikar, Advaith & Basu (Reference Tinaikar, Advaith and Basu2018) and by Ortega-Chavez, Gan & Gaskell (Reference Ortega-Chavez, Gan and Gaskell2023), which explored starting-jet vortex rings with circulation-based Reynolds numbers ranging from 100 to 7500, suggest that the core radius exhibits a linear trend during formation – essentially proportional to the mass of the rotational fluid accepted from the shear layer – followed by power-law scaling with a reduced slope beyond formation, where the starting vortex grows primarily due to vorticity diffusion. Thus, assuming a linear growth rate during the formation phase such that $r_{\textit{core}}^* \sim a_{r_{\textit{core}}}t^*$
, (1.10) can be divided by (1.9), resulting in
$r_{\textit{core}}^* \sim a_{r_{\textit{core}}}t^*$
, (1.10) can be divided by (1.9), resulting in
 \begin{align} \left . \left .\frac {\partial ^2 \omega _s}{\partial r^2} \right |_{\substack {{sus/pol} \\ r = 0}} \middle / \left .\frac {\partial ^2 \omega _s}{\partial r^2} \right |_{\substack {{newt} \\ r = 0}} \right . \approx \dfrac {\varGamma ^*_{\textit{sus/pol}}}{\varGamma ^*_{ {newt}}} \left ( \dfrac {a_{r^*_{ {core,newt}}}}{a_{r^*_{ {core,sus/pol}}}}\right )^4= 1+\lambda _r, \end{align}
which, upon rearranging, yields
 \begin{align} \dfrac { \varGamma ^*/ \ \varGamma ^*_0 }{ \left ( a/a_0\right )^{4}_{r_{\textit{core}}^*}} = 1+\lambda _r. \end{align}
On the left-hand side, the denominator represents the ratio of vortex-core growth-rate coefficients between the complex fluid ( $a_{r_{\textit{core}}^*}$
) and the non-loaded case (
$a_{r_{\textit{core}}^*}$
) and the non-loaded case ( $a_{r_{\textit{core}}^*,0}$
) raised to the fourth power, while the numerator represents the loaded-to-unloaded circulation ratio,
$a_{r_{\textit{core}}^*,0}$
) raised to the fourth power, while the numerator represents the loaded-to-unloaded circulation ratio, $\varGamma ^*/\varGamma ^*_0$
. On the right-hand side,
$\varGamma ^*/\varGamma ^*_0$
. On the right-hand side, $\lambda _r$
represents the ratio of the vorticity source term caused by the presence of suspended particles or polymer chains to the vorticity diffusion in the unloaded Newtonian case
$\lambda _r$
represents the ratio of the vorticity source term caused by the presence of suspended particles or polymer chains to the vorticity diffusion in the unloaded Newtonian case $(\dot \varSigma _{\omega _{{pol/sus}}}/\dot \varSigma _{\omega _s})$
in the vicinity of the vortex core. The result directly ties the vortex-core radius to the local vorticity transport contribution of suspended particles or polymer chains in the vicinity of the core. Given the propensity of loading to cause the diffusion of vortex structures,
$(\dot \varSigma _{\omega _{{pol/sus}}}/\dot \varSigma _{\omega _s})$
in the vicinity of the vortex core. The result directly ties the vortex-core radius to the local vorticity transport contribution of suspended particles or polymer chains in the vicinity of the core. Given the propensity of loading to cause the diffusion of vortex structures, $\lambda _r$
should exist between
$\lambda _r$
should exist between $0$
and
$0$
and $-1$
, which, assuming
$-1$
, which, assuming $\varGamma ^*/\varGamma ^*_0\approx 1$
, would cause the vortex core to increase relative to the Newtonian case. In light of this result, the current study utilises the vortex-core growth rate as defined here to assess the particle- or chain-induced vorticity source term in the vicinity of the vortex core, relative to the Newtonian case.
$\varGamma ^*/\varGamma ^*_0\approx 1$
, would cause the vortex core to increase relative to the Newtonian case. In light of this result, the current study utilises the vortex-core growth rate as defined here to assess the particle- or chain-induced vorticity source term in the vicinity of the vortex core, relative to the Newtonian case.
The parameters $\lambda _\varGamma$
and
$\lambda _\varGamma$
and $\lambda _r$
represent deviations in circulation transport and vorticity diffusion relative to the Newtonian case. These parameters can also be compared between suspensions and polymer solutions to assess the differences between the two complex media. If suspensions and polymer solutions exhibit disparate trends across
$\lambda _r$
represent deviations in circulation transport and vorticity diffusion relative to the Newtonian case. These parameters can also be compared between suspensions and polymer solutions to assess the differences between the two complex media. If suspensions and polymer solutions exhibit disparate trends across $\hat {c}$
or
$\hat {c}$
or $\hat {\varPhi }$
, this would suggest that individual characteristics of the dispersions in each medium have an outsized effect on their respective flow behaviour. However, if
$\hat {\varPhi }$
, this would suggest that individual characteristics of the dispersions in each medium have an outsized effect on their respective flow behaviour. However, if $\hat {c}$
or
$\hat {c}$
or $\hat {\varPhi }$
follow similar trends, this would suggest that the collective dynamics of the dispersion govern the flow behaviour and outweigh the influence of individual characteristics.
$\hat {\varPhi }$
follow similar trends, this would suggest that the collective dynamics of the dispersion govern the flow behaviour and outweigh the influence of individual characteristics.
(a) Labelled schematic of the piston-cylinder arrangement and UIV set-up. (b) Close-up of the UIV field of view. The piston diameter ( $D$
), stroke length (
$D$
), stroke length ( $L$
), piston velocity (
$L$
), piston velocity ( $u_{{p}}$
) and vortex convective velocity (
$u_{{p}}$
) and vortex convective velocity ( $u_{{c}}$
) are indicated with values where appropriate. The origin and extent of the field of view are also shown. Figure adapted from Barnes et al. (Reference Barnes, Zhang and Rival2024).
$u_{{c}}$
) are indicated with values where appropriate. The origin and extent of the field of view are also shown. Figure adapted from Barnes et al. (Reference Barnes, Zhang and Rival2024).

2. Methods
This section describes the experimental and post-processing methods used to capture and assess the toroidal-vorticity fields of vortex rings forming within suspensions and polymer solutions across a broad range of volume fractions and concentrations. First, the piston-cylinder apparatus that generated confined vortex rings within a cylindrical pipe is described. This is followed by a discussion of the properties of the suspensions and polymer solutions tested within the current study. The ultrasound velocimetry technique used to acquire data in both the suspension and polymer-solution experiments is then described, followed by the post-processing methods used to extract toroidal vorticity and the subsequent analysis procedures.
2.1. Piston-cylinder apparatus
Figure 3 depicts the piston-cylinder apparatus used to generate vortex rings in the flow media tested herein. A linear traverse actuated a piston-cylinder mechanism at constant speeds, driving the flow medium into a larger acrylic tube that terminated in a reservoir. The experimental set-up produced a vortex ring, and ultrasound image velocimetry (UIV) was used to capture the upper half of its toroidally oriented plane using a probe connected to a clinical ultrasound system. The piston, whose diameter was $D=38.2\,\textrm {mm}$
, expelled the flow medium into the larger downstream tube of diameter
$D=38.2\,\textrm {mm}$
, expelled the flow medium into the larger downstream tube of diameter $D_{\textrm {o}}=76.4\,\textrm {mm}$
, which resulted in a confinement ratio of
$D_{\textrm {o}}=76.4\,\textrm {mm}$
, which resulted in a confinement ratio of $D_{\textrm {o}}/D=2$
. The piston’s stroke length was
$D_{\textrm {o}}/D=2$
. The piston’s stroke length was $L=154\,\textrm {mm}$
, resulting in a stroke-to-piston ratio of
$L=154\,\textrm {mm}$
, resulting in a stroke-to-piston ratio of $L/D=4$
. The distance between the piston’s outlet and the reservoir’s inlet was
$L/D=4$
. The distance between the piston’s outlet and the reservoir’s inlet was $12D_{\textrm {o}}$
, mitigating the effect of the reservoir on the vortex ring’s formation. Prior to each run, the downstream reservoir was hand stirred for one minute, followed by a one-minute resting period. The piston was then retracted at a creeping speed, thereby drawing the carrier fluid and dispersed phase into the piston in a non-discriminatory manner, after which the system was allowed to rest for an additional one minute. This procedure was adopted to promote a repeatable, well-mixed particle distribution immediately upstream and downstream of the nozzle. In Najjari, Zhang & Rival (Reference Najjari, Zhang and Rival2021), ultrasound images of the dispersed phase obtained under similar experimental conditions showed that this procedure yielded visually homogeneous particle distributions near the nozzle.
$12D_{\textrm {o}}$
, mitigating the effect of the reservoir on the vortex ring’s formation. Prior to each run, the downstream reservoir was hand stirred for one minute, followed by a one-minute resting period. The piston was then retracted at a creeping speed, thereby drawing the carrier fluid and dispersed phase into the piston in a non-discriminatory manner, after which the system was allowed to rest for an additional one minute. This procedure was adopted to promote a repeatable, well-mixed particle distribution immediately upstream and downstream of the nozzle. In Najjari, Zhang & Rival (Reference Najjari, Zhang and Rival2021), ultrasound images of the dispersed phase obtained under similar experimental conditions showed that this procedure yielded visually homogeneous particle distributions near the nozzle.
The piston actuated at two speeds – $u_{{p}}=0.16\,$
and
$u_{{p}}=0.16\,$
and $0.27\,\rm {m\,s}^{-1}$
– which resulted in two carrier-phase circulation-based Reynolds numbers of
$0.27\,\rm {m\,s}^{-1}$
– which resulted in two carrier-phase circulation-based Reynolds numbers of $\textit{Re}_{\varGamma ,{cp}}=24\times 10^3$
and
$\textit{Re}_{\varGamma ,{cp}}=24\times 10^3$
and $42\times 10^3$
. At these Reynolds numbers, the vortex rings fall within the transitional-to-turbulent flow regime (Glezer Reference Glezer1988). Previous studies have demonstrated that the vortex ring’s convective velocity and radius are linearly proportional to the piston’s velocity and diameter, respectively, such that
$42\times 10^3$
. At these Reynolds numbers, the vortex rings fall within the transitional-to-turbulent flow regime (Glezer Reference Glezer1988). Previous studies have demonstrated that the vortex ring’s convective velocity and radius are linearly proportional to the piston’s velocity and diameter, respectively, such that $u_{{c}} \propto u_{{p}}$
and
$u_{{c}} \propto u_{{p}}$
and $2R \approx D$
, which justifies the non-dimensionalisation of time as
$2R \approx D$
, which justifies the non-dimensionalisation of time as $t^*=u_{{p}}t/D$
(Barnes et al. Reference Barnes, Zhang and Rival2024). Previous studies have also shown that defining the Reynolds number with an equivalent viscosity that accounts for loading does not improve collapse within the results within the turbulent regime tested here, and as such
$t^*=u_{{p}}t/D$
(Barnes et al. Reference Barnes, Zhang and Rival2024). Previous studies have also shown that defining the Reynolds number with an equivalent viscosity that accounts for loading does not improve collapse within the results within the turbulent regime tested here, and as such $\textit{Re}_{\varGamma ,{cp}}$
is employed by the current study instead (Zhang & Rival Reference Zhang and Rival2020; Barnes et al. Reference Barnes, Zhang and Rival2024).
$\textit{Re}_{\varGamma ,{cp}}$
is employed by the current study instead (Zhang & Rival Reference Zhang and Rival2020; Barnes et al. Reference Barnes, Zhang and Rival2024).
During the four-diameter stroke, the piston accelerates and decelerates over equivalent durations of $0.5t^*$
in the low–Reynolds-number cases and
$0.5t^*$
in the low–Reynolds-number cases and $1.0t^*$
in the high-Reynolds-number cases (
$1.0t^*$
in the high-Reynolds-number cases ( $t^* = t u_p / D$
). During the constant-speed phase for all cases, the piston velocity remains within 2 % of the prescribed value. Gharib et al. (Reference Gharib, Rambod and Shariff1998), whose piston velocity deviated from the prescribed value by roughly 1 % during the constant-speed phase, reported that a vortex formed by a piston with non-dimensional ramp-up and ramp-down times similar to those in our experiment exhibited circulations and formation times nearly identical to those produced by an impulsively started piston. Furthermore, although not entirely analogous, Fernando, Weymouth & Rival (Reference Fernando, Weymouth and Rival2020), who investigated the effect of initial acceleration on the force history of flat plates accelerated from rest to a constant velocity, observed that the force history of a plate that ramped up to its final speed by
$t^* = t u_p / D$
). During the constant-speed phase for all cases, the piston velocity remains within 2 % of the prescribed value. Gharib et al. (Reference Gharib, Rambod and Shariff1998), whose piston velocity deviated from the prescribed value by roughly 1 % during the constant-speed phase, reported that a vortex formed by a piston with non-dimensional ramp-up and ramp-down times similar to those in our experiment exhibited circulations and formation times nearly identical to those produced by an impulsively started piston. Furthermore, although not entirely analogous, Fernando, Weymouth & Rival (Reference Fernando, Weymouth and Rival2020), who investigated the effect of initial acceleration on the force history of flat plates accelerated from rest to a constant velocity, observed that the force history of a plate that ramped up to its final speed by $1.0t^*$
–analogous to our ramp-up time – converged to that of an impulsively started plate by
$1.0t^*$
–analogous to our ramp-up time – converged to that of an impulsively started plate by $t^*=1.5$
. Finally, Limbourg & Nedić (Reference Limbourg and Nedić2021), who examined the effect of stroke-to-diameter ratios on circulation, impulse, and kinetic energy of starting-jet vortices, reported that piston-speed unsteadiness of 5 % relative to the prescribed value had a negligible impact on their results. These past findings, together with the fact that the present study focuses on vortex development well after the ramp-up phase and before the ramp-down phase, strongly indicate that the speed variations and ramp times in our experiment have a negligible effect on the reported results.
$t^*=1.5$
. Finally, Limbourg & Nedić (Reference Limbourg and Nedić2021), who examined the effect of stroke-to-diameter ratios on circulation, impulse, and kinetic energy of starting-jet vortices, reported that piston-speed unsteadiness of 5 % relative to the prescribed value had a negligible impact on their results. These past findings, together with the fact that the present study focuses on vortex development well after the ramp-up phase and before the ramp-down phase, strongly indicate that the speed variations and ramp times in our experiment have a negligible effect on the reported results.
2.2. Working fluids
Vorticity fields were acquired across a broad loading range of suspensions and polymer solutions, including unloaded deionised water, three suspensions of hydrogel beads in deionised water and three xanthan-gum solutions prepared in deionised water. The hydrogel beads (LiquiBlock 2 G-110, Emerging Technologies, Greensboro, USA) are made of a superabsorbent polymer that absorbs 450 g of water per gramme of hydrogel material. The beads swell to a mean saturated diameter ranging from $0.8$
to
$0.8$
to $1.4\,$
mm, corresponding to a particle-to-pipe diameter ratio of
$1.4\,$
mm, corresponding to a particle-to-pipe diameter ratio of $d_p/D_o \approx 0.025$
. The particles exhibit a mean aspect ratio near unity and a settling velocity of
$d_p/D_o \approx 0.025$
. The particles exhibit a mean aspect ratio near unity and a settling velocity of $0.4\,\% \pm 0.2\,\%$
relative to the lowest tested piston velocity. When fully hydrated, the hydrogel beads match the density of water, resulting in ultrasound measurements with minimal acoustic reflections. Suspensions were prepared by slowly incorporating the dry hydrogel into degassed deionised water and allowing full saturation under static conditions. The mixtures were degassed again prior to testing. Volume fractions of
$0.4\,\% \pm 0.2\,\%$
relative to the lowest tested piston velocity. When fully hydrated, the hydrogel beads match the density of water, resulting in ultrasound measurements with minimal acoustic reflections. Suspensions were prepared by slowly incorporating the dry hydrogel into degassed deionised water and allowing full saturation under static conditions. The mixtures were degassed again prior to testing. Volume fractions of $ \varPhi = 2\,\%$
,
$ \varPhi = 2\,\%$
, $20\,\%$
and
$20\,\%$
and $40\,\%$
(corresponding to normalised values
$40\,\%$
(corresponding to normalised values $ \hat {\varPhi } = 0.05$
,
$ \hat {\varPhi } = 0.05$
, $0.50$
and
$0.50$
and $1$
) were tested, spanning dilute to concentrated regimes (see figure 1).
$1$
) were tested, spanning dilute to concentrated regimes (see figure 1).
Xanthan-gum solutions were prepared using powder sourced from Duinkerken Foods (Summerside, Canada). To facilitate dispersion, 0.4 % by weight aqueous glycerol was added as a surfactant. The xanthan gum was gradually incorporated under low-shear mixing conditions to minimise mechanical degradation. The solutions were degassed and then left to rest for 24 h to ensure complete hydration. Polymer concentrations of 35, 450 and 900 ppm (corresponding to normalised values $ \hat {c} = 0.02$
,
$ \hat {c} = 0.02$
, $0.23$
and
$0.23$
and $0.45$
) were tested, representing mixtures from the dilute-interacting to the semi-dilute entangled regime (see figure 1). Rheological characterisation using both cone-plate and concentric-cylinder geometries confirmed that all three mixtures increased in shear-thinning strength with increasing polymer concentration, and followed a power-law behaviour of the form
$0.45$
) were tested, representing mixtures from the dilute-interacting to the semi-dilute entangled regime (see figure 1). Rheological characterisation using both cone-plate and concentric-cylinder geometries confirmed that all three mixtures increased in shear-thinning strength with increasing polymer concentration, and followed a power-law behaviour of the form $ \mu = k\dot {\gamma }^{n-1}$
, where
$ \mu = k\dot {\gamma }^{n-1}$
, where $\mu$
,
$\mu$
, $k$
and
$k$
and $n$
are the dynamic viscosity, consistency index and flow-behaviour index of the flow medium. The rheological behaviour of the tested polymer solutions are consistent with previous studies (Palacios-Morales & Zenit Reference Palacios-Morales and Zenit2013; Li et al. Reference Li, Walker and Rival2014; Rahgozar & Rival Reference Rahgozar and Rival2017). Viscoelastic effects, including normal stress differences and relaxation times, were reported to be negligible at these concentrations by the same studies. Additional rheological details are available in Barnes et al. (Reference Barnes, Rosi and Rival2025).
$n$
are the dynamic viscosity, consistency index and flow-behaviour index of the flow medium. The rheological behaviour of the tested polymer solutions are consistent with previous studies (Palacios-Morales & Zenit Reference Palacios-Morales and Zenit2013; Li et al. Reference Li, Walker and Rival2014; Rahgozar & Rival Reference Rahgozar and Rival2017). Viscoelastic effects, including normal stress differences and relaxation times, were reported to be negligible at these concentrations by the same studies. Additional rheological details are available in Barnes et al. (Reference Barnes, Rosi and Rival2025).
The suspension data used here were originally acquired in Barnes et al. (Reference Barnes, Zhang and Rival2024), where the only results comparable to this study were vorticity fields. All analyses on circulation growth, vortex-core radius evolution, self-similar vorticity profiles and turbulent kinetic energy are presented here for the first time.
2.3. Ultrasound image velocimetry and data post-processing
Ultrasound image velocimetry was employed to measure the flow fields across all test cases – including cases suitable for optical particle image velocimetry (PIV) – to eliminate instrumentation bias and ensure direct comparability between cases. The same UIV apparatus was employed across all cases, with minor adjustments to imaging settings. All flow media were seeded with microbubble contrast agents with an average diameter and density of 10 $\,\unicode{x03BC} \textrm {m}$
and 1000
$\,\unicode{x03BC} \textrm {m}$
and 1000 $\,\rm {kg\,m}^{-3}$
(Lantheus, Montreal, Canada), and at a volume fraction of approximately
$\,\rm {kg\,m}^{-3}$
(Lantheus, Montreal, Canada), and at a volume fraction of approximately $\varPhi \sim 10^{-4}$
(approximately
$\varPhi \sim 10^{-4}$
(approximately $100$
ppm). This loading is negligible relative to both the suspended-bead loading and the effective hydrodynamic volume of the polymer solutions achieved through connectivity and entanglement (not literal geometric filling), and does not affect the collective dynamics of the flow. This level of contrast-agent loading yielded images with particle densities of 0.05 particles per pixel, which is appropriate for PIV-style cross-correlation analyses. The micro-bubbles exhibited a Stokes number of
$100$
ppm). This loading is negligible relative to both the suspended-bead loading and the effective hydrodynamic volume of the polymer solutions achieved through connectivity and entanglement (not literal geometric filling), and does not affect the collective dynamics of the flow. This level of contrast-agent loading yielded images with particle densities of 0.05 particles per pixel, which is appropriate for PIV-style cross-correlation analyses. The micro-bubbles exhibited a Stokes number of $ {Stk}_{{bub}}=(1/9)\rho _{{bub}}u_{{p}}d_{{p}}/\mu _{{cp}}\sim \mathcal{O}(0.01)$
using characteristic values of the bubbles and the experiment. Flow measurements were acquired using a Vantage 128 ultrasound system (Verasonics, Kirkland, USA) paired with an L14-5/38 linear array transducer. The probe was mounted above the test section, which was filled with deionised water and isolated from the suspension by a neoprene membrane. This membrane, selected for its acoustic translucency, helped minimise reflection artefacts at the interface, thereby preserving image quality – particularly in the near-wall region, where reflections would otherwise obscure reliable measurements (Poelma Reference Poelma2017). The transmitting frequency ranged from 7.81 to 9.61 MHz, with eight tilted plane waves being emitted over a 17
$ {Stk}_{{bub}}=(1/9)\rho _{{bub}}u_{{p}}d_{{p}}/\mu _{{cp}}\sim \mathcal{O}(0.01)$
using characteristic values of the bubbles and the experiment. Flow measurements were acquired using a Vantage 128 ultrasound system (Verasonics, Kirkland, USA) paired with an L14-5/38 linear array transducer. The probe was mounted above the test section, which was filled with deionised water and isolated from the suspension by a neoprene membrane. This membrane, selected for its acoustic translucency, helped minimise reflection artefacts at the interface, thereby preserving image quality – particularly in the near-wall region, where reflections would otherwise obscure reliable measurements (Poelma Reference Poelma2017). The transmitting frequency ranged from 7.81 to 9.61 MHz, with eight tilted plane waves being emitted over a 17 $^\circ$
angular spread and with successive plane-wave acquisitions occurring every 110
$^\circ$
angular spread and with successive plane-wave acquisitions occurring every 110 $\unicode{x03BC}$
s. The eight transmissions were coherently summed (Montaldo et al. Reference Montaldo, Tanter, Bercoff, Benech and Fink2009) prior to envelope detection to generate a final high-quality image. The transducer operated at approximately 20 V, which was sufficiently low to avoid acoustic streaming, transducer heating, and contrast-agent bubble rupture. An identical UIV workflow was employed and validated by Najjari et al. (Reference Najjari, Zhang and Rival2021) to investigate a confined vortex ring forming in a suspension at 40 % volume fraction under identical piston kinematics, where the UIV measurements were shown to agree closely with optics-based PIV while exhibiting reduced noise.
$\unicode{x03BC}$
s. The eight transmissions were coherently summed (Montaldo et al. Reference Montaldo, Tanter, Bercoff, Benech and Fink2009) prior to envelope detection to generate a final high-quality image. The transducer operated at approximately 20 V, which was sufficiently low to avoid acoustic streaming, transducer heating, and contrast-agent bubble rupture. An identical UIV workflow was employed and validated by Najjari et al. (Reference Najjari, Zhang and Rival2021) to investigate a confined vortex ring forming in a suspension at 40 % volume fraction under identical piston kinematics, where the UIV measurements were shown to agree closely with optics-based PIV while exhibiting reduced noise.
The field-of-view (FoV) visualised within the flow spanned an area of 38.4 mm by 38.4 mm ( $1.0D\times 1.0D$
), which captured a horizontal and vertical domain of
$1.0D\times 1.0D$
), which captured a horizontal and vertical domain of $0.25D\leq \hat {x}\leq 1.25D$
and
$0.25D\leq \hat {x}\leq 1.25D$
and $0.00D\leq \hat {y}\leq 1.00D$
for all cases. Image acquisition was performed at 500 and 800 frames per second for the respective piston speeds of 0.16 and 0.27 m s−1, resulting in tracer displacements of roughly 5–9 pixels per frame. Images were then post-processed in the form of intensity normalisation intended to eliminate non-uniform brightness, as well as masking unwanted portions of the image. Image quality was quantified using the contrast-to-noise ratio (CNR) of representative tracer images, defined as the absolute difference between median signal and background intensities normalised by the background standard deviation, with signal and background regions identified automatically using Otsu’s thresholding. Across all cases, the CNR remained of order 5 and showed no systematic dependence on loading, Reynolds number or flow medium, consistent with the use of harmonic ultrasound imaging to isolate the microbubble tracer signal and resulting in uniformly low velocity vector outlier fractions (typically 1 %–2 %).
$0.00D\leq \hat {y}\leq 1.00D$
for all cases. Image acquisition was performed at 500 and 800 frames per second for the respective piston speeds of 0.16 and 0.27 m s−1, resulting in tracer displacements of roughly 5–9 pixels per frame. Images were then post-processed in the form of intensity normalisation intended to eliminate non-uniform brightness, as well as masking unwanted portions of the image. Image quality was quantified using the contrast-to-noise ratio (CNR) of representative tracer images, defined as the absolute difference between median signal and background intensities normalised by the background standard deviation, with signal and background regions identified automatically using Otsu’s thresholding. Across all cases, the CNR remained of order 5 and showed no systematic dependence on loading, Reynolds number or flow medium, consistent with the use of harmonic ultrasound imaging to isolate the microbubble tracer signal and resulting in uniformly low velocity vector outlier fractions (typically 1 %–2 %).
Velocity fields were extracted from the collected UIV images using cross-correlation methods via DaVis 8.4.0 (LaVision, Gottingen, Germany). Following the methodology used in Zhang & Rival (Reference Zhang and Rival2020) and Najjari et al. (Reference Najjari, Zhang and Rival2021), a multi-pass PIV algorithm with 50 % window overlap was employed. Two iterations were performed using an initial 32 $\times$
32 pixel interrogation window, followed by three iterations at a final 24
$\times$
32 pixel interrogation window, followed by three iterations at a final 24 $\times$
24 pixel window size, with the displacement field from each pass used to perform predictor-based window offsetting. The PIV algorithm resulted in a spatial resolution of 0.8 mm
$\times$
24 pixel window size, with the displacement field from each pass used to perform predictor-based window offsetting. The PIV algorithm resulted in a spatial resolution of 0.8 mm $\times$
0.8 mm (0.02D
$\times$
0.8 mm (0.02D $\times$
0.02D). This UIV protocol has previously been employed and validated in previous studies involving similar test conditions and loading regimes, and indicated a maximum velocity-field error of
$\times$
0.02D). This UIV protocol has previously been employed and validated in previous studies involving similar test conditions and loading regimes, and indicated a maximum velocity-field error of $5\,\%$
in both suspensions (Najjari et al. Reference Najjari, Zhang and Rival2021) and polymer solutions (Barnes et al. Reference Barnes, Rosi and Rival2025). As such,
$5\,\%$
in both suspensions (Najjari et al. Reference Najjari, Zhang and Rival2021) and polymer solutions (Barnes et al. Reference Barnes, Rosi and Rival2025). As such, $5\,\%$
velocity-field error is propagated throughout the results reported in the current study.
$5\,\%$
velocity-field error is propagated throughout the results reported in the current study.
A total of ten trials were recorded for each loading case and piston-speed combination. The resultant velocity fields were then phase-averaged to eliminate random error within the vorticity fields. Velocity, space and time were normalised using $u_{{p}}$
,
$u_{{p}}$
, $D$
and
$D$
and $D/u_{{p}}$
, respectively. Derived values normalised in this manner are indicated in the Results section using a superscript ‘
$D/u_{{p}}$
, respectively. Derived values normalised in this manner are indicated in the Results section using a superscript ‘ $*$
’. Normalised circulation (
$*$
’. Normalised circulation ( $\varGamma ^*$
) was calculated as the product of normalised mean vorticity (
$\varGamma ^*$
) was calculated as the product of normalised mean vorticity ( $\overline {\omega _s^*}$
) and effective dimensionless area of a spatial node, summed across the entire FoV. The vorticity field
$\overline {\omega _s^*}$
) and effective dimensionless area of a spatial node, summed across the entire FoV. The vorticity field $\omega _s(x^*, y^*)$
, defined on a rectilinear grid, was interpolated onto a radial coordinate system centred at the vortex core, yielding
$\omega _s(x^*, y^*)$
, defined on a rectilinear grid, was interpolated onto a radial coordinate system centred at the vortex core, yielding $\omega _s(r^*)$
. Instances where multiple rectilinear grid points shared the same radial distance values were averaged. The vortex-core location was identified as the vorticity-weighted centroid of the connected high-vorticity region associated with the primary vortex, determined using a percentile-based threshold and enforced positional continuity with time. This approach reduces sensitivity to local shear-layer oscillations, yielding growth rates that are robust across different selections of the available time trace.
$\omega _s(r^*)$
. Instances where multiple rectilinear grid points shared the same radial distance values were averaged. The vortex-core location was identified as the vorticity-weighted centroid of the connected high-vorticity region associated with the primary vortex, determined using a percentile-based threshold and enforced positional continuity with time. This approach reduces sensitivity to local shear-layer oscillations, yielding growth rates that are robust across different selections of the available time trace.
To estimate the vortex-core radius at each time instant, the interpolated vorticity profiles $\omega _s(r^*)$
were fitted to the Lamb–Oseen vortex model in the form
$\omega _s(r^*)$
were fitted to the Lamb–Oseen vortex model in the form
 \begin{align} \overline {\omega _s(r^*)}=\dfrac {\varGamma ^*}{\pi {r_{\textit{core}}^*}^2}e^{-{r^*}^2/{r_{\textit{core}}^*}^2}. \end{align}
At every time instance, $\varGamma ^*$
as determined from the UIV measurements was inserted in the Lamb–Oseen model, which allowed for
$\varGamma ^*$
as determined from the UIV measurements was inserted in the Lamb–Oseen model, which allowed for $r_{\textit{core}}^*$
to be determined by using a least squares fit method. Time traces of circulation and vortex-core radius were fitted against linear scaling laws
$r_{\textit{core}}^*$
to be determined by using a least squares fit method. Time traces of circulation and vortex-core radius were fitted against linear scaling laws $\varGamma ^* \sim a_{\varGamma } t^*$
and
$\varGamma ^* \sim a_{\varGamma } t^*$
and $r_{\textit{core}}^* \sim a_{r_{\textit{core}}} t^*$
, which is reflected in theory developed in Gharib et al. (Reference Gharib, Rambod and Shariff1998) for circulation, as well as vortex-core radius measurements performed by Tinaikar et al. (Reference Tinaikar, Advaith and Basu2018) and Ortega-Chavez et al. (Reference Ortega-Chavez, Gan and Gaskell2023). Due to reflections off of the piston during early vortex formation, and due to the vortex size spanning the entire field of view during late formation, these integral measurements were performed within the interval of
$r_{\textit{core}}^* \sim a_{r_{\textit{core}}} t^*$
, which is reflected in theory developed in Gharib et al. (Reference Gharib, Rambod and Shariff1998) for circulation, as well as vortex-core radius measurements performed by Tinaikar et al. (Reference Tinaikar, Advaith and Basu2018) and Ortega-Chavez et al. (Reference Ortega-Chavez, Gan and Gaskell2023). Due to reflections off of the piston during early vortex formation, and due to the vortex size spanning the entire field of view during late formation, these integral measurements were performed within the interval of $2\leq t^*\leq 3.25$
. Radial profiles of vorticity were also analysed to identify topological self-similar points across cases.
$2\leq t^*\leq 3.25$
. Radial profiles of vorticity were also analysed to identify topological self-similar points across cases.
The convergence, sensitivity and confidence bounds of the ensemble-averaged circulation $\varGamma ^*$
and vortex-core radius
$\varGamma ^*$
and vortex-core radius $r^*_{\textit{core}}$
were evaluated using non-parametric bootstrap resampling with replacement. For each test case, ten trials were randomly sampled with replacement from the available data, and ensemble-averaged quantities were computed to assess sensitivity to both the number and selection of realisations. This analysis yielded 95 % confidence bounds for
$r^*_{\textit{core}}$
were evaluated using non-parametric bootstrap resampling with replacement. For each test case, ten trials were randomly sampled with replacement from the available data, and ensemble-averaged quantities were computed to assess sensitivity to both the number and selection of realisations. This analysis yielded 95 % confidence bounds for $\varGamma ^*$
of no greater than 2 % for polymer solutions and 5 % for suspensions, while
$\varGamma ^*$
of no greater than 2 % for polymer solutions and 5 % for suspensions, while $r^*_{\textit{core}}$
exhibited 95 % confidence bounds of no greater than 2 % and 13 % for polymer solutions and suspensions, respectively. Across all cases, the median convergence error fell within 5 % of the full-ensemble mean within four to five realisations, while the 95 % convergence bounds decreased monotonically and asymptotically approached the mean with increasing ensemble size. These analyses are detailed in Appendix A.
$r^*_{\textit{core}}$
exhibited 95 % confidence bounds of no greater than 2 % and 13 % for polymer solutions and suspensions, respectively. Across all cases, the median convergence error fell within 5 % of the full-ensemble mean within four to five realisations, while the 95 % convergence bounds decreased monotonically and asymptotically approached the mean with increasing ensemble size. These analyses are detailed in Appendix A.
Finally, to investigate the increased stability of vortices in loaded flow media – despite their larger vortex cores – radial profiles of mean turbulent kinetic energy (TKE, $\overline {k^*}$
) within the vortex core are considered.
$\overline {k^*}$
) within the vortex core are considered. $\overline {k^*}$
at each radial location is computed from a time-averaged ensemble involving all test runs using the following equation:
$\overline {k^*}$
at each radial location is computed from a time-averaged ensemble involving all test runs using the following equation:
 \begin{align} \overline {k^*} = \frac {1}{2} \, \overline {\left ((u^{*\prime })^2 + (v^{*\prime })^2 \right )}, \end{align}
where $u^{*\prime }$
and
$u^{*\prime }$
and $v^{*\prime }$
represent components of velocity fluctuation. Strictly speaking, time averaging is not formally appropriate for a non-stationary flow such as a vortex ring. However, within the vortex core – where the flow is approximately steady and the local time derivative is negligible – the approach remains reasonably valid. Accordingly, we report time-averaged quantities only within the core region.
$v^{*\prime }$
represent components of velocity fluctuation. Strictly speaking, time averaging is not formally appropriate for a non-stationary flow such as a vortex ring. However, within the vortex core – where the flow is approximately steady and the local time derivative is negligible – the approach remains reasonably valid. Accordingly, we report time-averaged quantities only within the core region.
3. Results
This section begins with a qualitative assessment of the vortex-ring behaviour across all tested flow media using vorticity fields. Time traces of the dimensionless circulation and vortex-core radius are then presented and discussed, followed by an analysis of their respective growth rates. Finally, radial profiles of mean vorticity and TKE are presented for all media, with respective discussions on their implications for topological self-similarity and vortex stability.
3.1. Vorticity, circulation and core radius: parallels in tilting and diffusion
The toroidal-vorticity ( $\omega _s^*$
) fields across all tested suspensions and polymer solutions are examined to assess the influence of loading factor and Reynolds number on vortex-ring structure and diffusion. Figure 4 presents phase-averaged vorticity fields at
$\omega _s^*$
) fields across all tested suspensions and polymer solutions are examined to assess the influence of loading factor and Reynolds number on vortex-ring structure and diffusion. Figure 4 presents phase-averaged vorticity fields at $t^*=3.25$
for suspensions (red fields) and polymer solutions (blue fields), with different Reynolds numbers and loading factors respectively indicated by the column headers and captions. In all cases, the shear layer rolls up into a coherent vortex core. However, increasing the loading factor leads to a more diffuse, broadened core, while higher Reynolds numbers mitigate this diffusion, preserving tighter core structures. At low loading (first two rows), the shear layer remains thin and forms a tight core; at high loading (last rows), the layer thickens and the core smears outward. These trends are consistent with past observations. Vortex rings in loaded suspensions become diffuse at high volume fractions, an effect that reduces at higher Reynolds numbers (Zhang & Rival Reference Zhang and Rival2020; Barnes et al. Reference Barnes, Zhang and Rival2024). Similarly, shear layers in polymer solutions transition from thin and well defined to smeared with instability coalescence as concentration increases (Barnes et al. Reference Barnes, Rosi and Rival2025). Comparable broadening phenomena are also noted in wall turbulence and transitional pipe flows for suspensions (Richter & Sullivan Reference Richter and Sullivan2014; Hogendoorn & Poelma Reference Hogendoorn and Poelma2018) and in jets and expansions for polymer solutions (Poole & Escudier Reference Poole and Escudier2003; Guimarães et al. Reference Guimarães, Pimentel, Pinho, Da Silva and Pinho2020).
$t^*=3.25$
for suspensions (red fields) and polymer solutions (blue fields), with different Reynolds numbers and loading factors respectively indicated by the column headers and captions. In all cases, the shear layer rolls up into a coherent vortex core. However, increasing the loading factor leads to a more diffuse, broadened core, while higher Reynolds numbers mitigate this diffusion, preserving tighter core structures. At low loading (first two rows), the shear layer remains thin and forms a tight core; at high loading (last rows), the layer thickens and the core smears outward. These trends are consistent with past observations. Vortex rings in loaded suspensions become diffuse at high volume fractions, an effect that reduces at higher Reynolds numbers (Zhang & Rival Reference Zhang and Rival2020; Barnes et al. Reference Barnes, Zhang and Rival2024). Similarly, shear layers in polymer solutions transition from thin and well defined to smeared with instability coalescence as concentration increases (Barnes et al. Reference Barnes, Rosi and Rival2025). Comparable broadening phenomena are also noted in wall turbulence and transitional pipe flows for suspensions (Richter & Sullivan Reference Richter and Sullivan2014; Hogendoorn & Poelma Reference Hogendoorn and Poelma2018) and in jets and expansions for polymer solutions (Poole & Escudier Reference Poole and Escudier2003; Guimarães et al. Reference Guimarães, Pimentel, Pinho, Da Silva and Pinho2020).
Phase-averaged vorticity fields for suspensions (red fields) and polymer solutions (blue fields) at $t^*=3.25$
. The same vorticity fields for suspensions are reported by Barnes et al. (Reference Barnes, Zhang and Rival2024) and are reported here for comparison with the polymer-solution fields. The headers along the top of the figure indicate the carrier-phase circulation-based Reynolds number for the underlying column, while the captions within each field indicate the normalised loading factor (
$t^*=3.25$
. The same vorticity fields for suspensions are reported by Barnes et al. (Reference Barnes, Zhang and Rival2024) and are reported here for comparison with the polymer-solution fields. The headers along the top of the figure indicate the carrier-phase circulation-based Reynolds number for the underlying column, while the captions within each field indicate the normalised loading factor ( $\hat \varPhi \,\textrm{or}\, \hat{c}$
). Increasing the loading factor of either flow medium results in an increasingly diffuse vortex, although less so for the higher-Reynolds-number case. See Supplementary video 1, available at https://doi.org/10.1017/jfm.2026.11572, which animates the vorticity fields from
$\hat \varPhi \,\textrm{or}\, \hat{c}$
). Increasing the loading factor of either flow medium results in an increasingly diffuse vortex, although less so for the higher-Reynolds-number case. See Supplementary video 1, available at https://doi.org/10.1017/jfm.2026.11572, which animates the vorticity fields from $1.8\leq t^*\leq 3.2$
.
$1.8\leq t^*\leq 3.2$
.

What is striking in these vorticity fields is the clear parallels in flow-structure modification across both media. Cases with similar normalised loading exhibit comparable geometric features. The shear-layer thickness – visible as the band of high vorticity projecting from the upstream side of each field of view – consistently transitions from thin and concentrated to wide and diffuse as loading increases. The vortex core undergoes a similar consistent modification, evolving from a sharply defined, highly concentrated eye to a broader and more diffuse structure at higher loadings. Finally, when comparing cases at similar loadings, the shear-layer instabilities evolve in a consistent manner: at low loading and high Re, they appear as distinct, concentrated structures that periodically shed and undulate, whereas at higher loading these structures become washed out, producing a largely non-undulating shear layer with a nearly constant vorticity flux. These parallels suggest that, from a mean-flow perspective, coherent-structure modification is governed primarily by loading-driven collective effects in both media, despite differences in their individual characteristics. However, secondary aspects – most notably turbulence energetics – may still differ and are examined separately below. To better quantify these observations – and support the characterisation of circulation and vortex-core growth described in § 1.2 – we assess time traces of the dimensionless circulation ( $\varGamma ^*$
) and vortex-core radius (
$\varGamma ^*$
) and vortex-core radius ( $r_{\textit{core}}^*$
). Figures 5(a) and 5(b) show
$r_{\textit{core}}^*$
). Figures 5(a) and 5(b) show $\varGamma ^*(t^*)$
for vortex rings in suspensions at low and high Reynolds numbers; panels (e) and (f) present results for polymer solutions. The time traces are coloured progressively darker to indicate increasing loading factors, and shaded envelopes represent 5 % propagated velocity error.
$\varGamma ^*(t^*)$
for vortex rings in suspensions at low and high Reynolds numbers; panels (e) and (f) present results for polymer solutions. The time traces are coloured progressively darker to indicate increasing loading factors, and shaded envelopes represent 5 % propagated velocity error.
Circulation ( $\varGamma ^*$
) and vortex-core radii (
$\varGamma ^*$
) and vortex-core radii ( $r_{\textit{core}}^*$
) for suspensions and xanthan-gum solutions at different loadings,(
$r_{\textit{core}}^*$
) for suspensions and xanthan-gum solutions at different loadings,( $\hat {\varPhi }$
and
$\hat {\varPhi }$
and $\hat {c}$
, respectively). Shaded areas within the circulation and vortex-core plots respectively indicate the propagation of 5 % error within the velocity-field data, or the 95 % confidence intervals of the ensemble average (see Appendix A). Carrier-phase circulation-based Reynolds numbers (
$\hat {c}$
, respectively). Shaded areas within the circulation and vortex-core plots respectively indicate the propagation of 5 % error within the velocity-field data, or the 95 % confidence intervals of the ensemble average (see Appendix A). Carrier-phase circulation-based Reynolds numbers ( $\textit{Re}_{\varGamma , {cp}}$
) appear in the bottom right of each graph. For comparison, dashed curves are overlaid in panels (c,d) to indicate the corresponding low- and high-Reynolds-number cases for
$\textit{Re}_{\varGamma , {cp}}$
) appear in the bottom right of each graph. For comparison, dashed curves are overlaid in panels (c,d) to indicate the corresponding low- and high-Reynolds-number cases for $\hat {c}=0.45$
, while panels (g,h) similarly include dashed curves for the corresponding
$\hat {c}=0.45$
, while panels (g,h) similarly include dashed curves for the corresponding $\hat {\varPhi }=0.5$
cases. Increases in loading have little effect on circulation, but does increase the size and rate of growth of the vortex core.
$\hat {\varPhi }=0.5$
cases. Increases in loading have little effect on circulation, but does increase the size and rate of growth of the vortex core.

It is remarkable that across all media, loading factors and Reynolds numbers, $\varGamma ^*(t^*)$
remains largely similar, with variations within uncertainty. This suggests that loading does not significantly alter net toroidal circulation, implying limited out-of-plane vorticity tilting (i.e.
$\varGamma ^*(t^*)$
remains largely similar, with variations within uncertainty. This suggests that loading does not significantly alter net toroidal circulation, implying limited out-of-plane vorticity tilting (i.e. $\lambda _\varGamma \approx 0$
). The
$\lambda _\varGamma \approx 0$
). The $\varGamma ^*(t^*)$
time traces indicate that the instantaneous loaded-to-unloaded circulation ratio
$\varGamma ^*(t^*)$
time traces indicate that the instantaneous loaded-to-unloaded circulation ratio $(\varGamma ^*/\varGamma _0^*)$
remains close to unity across all test cases (0.94 to 1.19 for suspensions, 0.85–1.02 for polymers). Given the proximity of these extrema to unity, and considering that the ratio of loaded-to-unloaded vortex-core growth-rate factors,
$(\varGamma ^*/\varGamma _0^*)$
remains close to unity across all test cases (0.94 to 1.19 for suspensions, 0.85–1.02 for polymers). Given the proximity of these extrema to unity, and considering that the ratio of loaded-to-unloaded vortex-core growth-rate factors, $(a/a_0)_{r_{\textit{core}}^*}$
, is raised to the fourth power in (1.14), it is reasonable to assume that
$(a/a_0)_{r_{\textit{core}}^*}$
, is raised to the fourth power in (1.14), it is reasonable to assume that $(a/a_0)_{r_{\textit{core}}^*}$
dominates and can serve as a direct measure of
$(a/a_0)_{r_{\textit{core}}^*}$
dominates and can serve as a direct measure of $\lambda _r$
, under the assumption
$\lambda _r$
, under the assumption $\varGamma ^*/\varGamma _0^* \approx 1$
. These findings contrast with the results of Zhang et al. (Reference Zhang and Rival2020), who observed stronger circulation variations using a swirling-strength threshold to isolate the vortex core, likely overemphasising local core contributions. In contrast, our results are consistent with Barnes et al. (Reference Barnes, Rosi and Rival2025), who evaluated circulation across the entire field of view in polymer solutions and likewise found minimal sensitivity to loading.
$\varGamma ^*/\varGamma _0^* \approx 1$
. These findings contrast with the results of Zhang et al. (Reference Zhang and Rival2020), who observed stronger circulation variations using a swirling-strength threshold to isolate the vortex core, likely overemphasising local core contributions. In contrast, our results are consistent with Barnes et al. (Reference Barnes, Rosi and Rival2025), who evaluated circulation across the entire field of view in polymer solutions and likewise found minimal sensitivity to loading.
Figures 5(c), 5(d), 5(g) and 5(h) show similar time traces for $r^*_{\textit{core}}(t^*)$
generated from the Lamb–Oseen vortex-profile fitting procedure described in the Methods section, while the underlying shaded regions denote 95 % confidence intervals of the ensemble average (see Appendix A). Unlike
$r^*_{\textit{core}}(t^*)$
generated from the Lamb–Oseen vortex-profile fitting procedure described in the Methods section, while the underlying shaded regions denote 95 % confidence intervals of the ensemble average (see Appendix A). Unlike $\varGamma ^*$
, the core radius shows a clear dependence on loading: both size and growth rate increase with loading, more strongly at the lower Reynolds number and diminishing at the higher Reynolds number. It is notable that the curves for
$\varGamma ^*$
, the core radius shows a clear dependence on loading: both size and growth rate increase with loading, more strongly at the lower Reynolds number and diminishing at the higher Reynolds number. It is notable that the curves for $\hat {\varPhi }=0.5$
and
$\hat {\varPhi }=0.5$
and $\hat {c}=0.45$
somewhat coincide, reinforcing the parallel trends observed in the vorticity fields and highlighting the dominance of the collective dynamics over individual characteristics in governing the mean-flow behaviour, although not necessarily secondary flow characteristics. Corresponding
$\hat {c}=0.45$
somewhat coincide, reinforcing the parallel trends observed in the vorticity fields and highlighting the dominance of the collective dynamics over individual characteristics in governing the mean-flow behaviour, although not necessarily secondary flow characteristics. Corresponding $\hat {\varPhi }=0.5$
and
$\hat {\varPhi }=0.5$
and $\hat {c}=0.45$
cases are shown as dashed curves in figure 5(c, d, g, h) to facilitate comparison. This distinct sensitivity of
$\hat {c}=0.45$
cases are shown as dashed curves in figure 5(c, d, g, h) to facilitate comparison. This distinct sensitivity of $r^*_{\textit{core}}(t^*)$
to loading, contrasted with the insensitivity of
$r^*_{\textit{core}}(t^*)$
to loading, contrasted with the insensitivity of $\varGamma ^*$
, supports using the core growth rate as a direct measure of
$\varGamma ^*$
, supports using the core growth rate as a direct measure of $\lambda _r$
. It is noted here that
$\lambda _r$
. It is noted here that $\varGamma ^*(t^*)$
for
$\varGamma ^*(t^*)$
for $\hat c = 0.02$
(figure 5
f) undergoes a sharp undulation at approximately
$\hat c = 0.02$
(figure 5
f) undergoes a sharp undulation at approximately $t^*=3.1$
. Given that the respective vortex field (figure 4
h) does not show clear signs of destabilisation, it is believed that this behaviour is a measurement artefact caused by the downstream side of the vortex interacting with the edge of the field of view.
$t^*=3.1$
. Given that the respective vortex field (figure 4
h) does not show clear signs of destabilisation, it is believed that this behaviour is a measurement artefact caused by the downstream side of the vortex interacting with the edge of the field of view.
As per Gharib et al. (Reference Gharib, Rambod and Shariff1998), Tinaikar et al. (Reference Tinaikar, Advaith and Basu2018) and Ortega-Chavez et al. (Reference Ortega-Chavez, Gan and Gaskell2023), linear fits for vortex core and circulation are fitted to the time traces for $\varGamma ^*$
and
$\varGamma ^*$
and $r_{\textit{core}}^*$
shown in figure 5 to extract loaded-to-unloaded growth-rate ratios for circulation
$r_{\textit{core}}^*$
shown in figure 5 to extract loaded-to-unloaded growth-rate ratios for circulation $ ( a/a_0 )_{\varGamma ^*}$
and vortex-core radius
$ ( a/a_0 )_{\varGamma ^*}$
and vortex-core radius $ ( a/a_0 )_{r_{\textit{core}}^*}$
. Figure 6(a) shows that
$ ( a/a_0 )_{r_{\textit{core}}^*}$
. Figure 6(a) shows that $ ( a/a_0 )_{\varGamma ^*}$
is nearly unity and exhibits no clear trend with loading, supporting the earlier finding of circulation insensitivity to loading. By contrast, figure 6(b) shows that
$ ( a/a_0 )_{\varGamma ^*}$
is nearly unity and exhibits no clear trend with loading, supporting the earlier finding of circulation insensitivity to loading. By contrast, figure 6(b) shows that $ ( a/a_0 )_{r_{\textit{core}}^*}$
increases linearly with loading for both suspensions and polymer solutions, roughly following
$ ( a/a_0 )_{r_{\textit{core}}^*}$
increases linearly with loading for both suspensions and polymer solutions, roughly following $1 + \mathcal{O}(1) (\hat \varPhi , \hat c )$
, with
$1 + \mathcal{O}(1) (\hat \varPhi , \hat c )$
, with $\sim$
10 % root-mean-squared (r.m.s.) residual error across all data points. The circulation growth rates reported here appear at odds with Zhang & Rival (Reference Zhang and Rival2020), who showed a much higher circulation increase for dense suspensions. This discrepancy likely arises from their use of a swirling-strength threshold to isolate the core, whereas the present study integrates circulation over the entire field to capture total toroidal vorticity. In contrast, the vortex-core growth trends agree with Zhang & Rival (Reference Zhang and Rival2020) and Barnes et al. (Reference Barnes, Zhang and Rival2024) for suspensions, although neither study explicitly reported growth-rate coefficients. Collectively, the adherence of both the circulation and vortex-core growth-rate coefficients to similar trends – regardless of media type, whether suspensions or polymer solutions – as shown in figure 6, suggests that both media exhibit shared collective dispersion dynamics despite the individual characteristics of their respective dispersions.
$\sim$
10 % root-mean-squared (r.m.s.) residual error across all data points. The circulation growth rates reported here appear at odds with Zhang & Rival (Reference Zhang and Rival2020), who showed a much higher circulation increase for dense suspensions. This discrepancy likely arises from their use of a swirling-strength threshold to isolate the core, whereas the present study integrates circulation over the entire field to capture total toroidal vorticity. In contrast, the vortex-core growth trends agree with Zhang & Rival (Reference Zhang and Rival2020) and Barnes et al. (Reference Barnes, Zhang and Rival2024) for suspensions, although neither study explicitly reported growth-rate coefficients. Collectively, the adherence of both the circulation and vortex-core growth-rate coefficients to similar trends – regardless of media type, whether suspensions or polymer solutions – as shown in figure 6, suggests that both media exhibit shared collective dispersion dynamics despite the individual characteristics of their respective dispersions.
Growth-rate coefficients as a function of loading for (a) circulation and (b) vortex-core radius determined from linear fits of respective time traces, normalised by the zero-loading case. All test cases are labelled per the legend. Error bars represent the fractional unexplained variability in the fitted coefficients. Blue and red shaded regions indicate the loading regimes of xanthan-gum-in-water blood analogues and physiological blood, highlighting that analogues from the literature likely underestimate vortex growth rates in blood. The circulation growth rate shows a weak trend with increased loading, whereas the core growth rate follows a linear relationship with the loading factor of roughly $1 + 1(\hat {\varPhi },\hat {c})$
. The shaded region indicates
$1 + 1(\hat {\varPhi },\hat {c})$
. The shaded region indicates $\pm$
10 % relative deviation from the line, corresponding to the typical r.m.s. residual error of the data.
$\pm$
10 % relative deviation from the line, corresponding to the typical r.m.s. residual error of the data.

The results in figures 5 and 6 allow estimation of $\lambda _\varGamma$
and
$\lambda _\varGamma$
and $\lambda _r$
as functions of loading. In the case of
$\lambda _r$
as functions of loading. In the case of $\lambda _\varGamma$
, the nearly identical trends of
$\lambda _\varGamma$
, the nearly identical trends of $\varGamma ^*$
across all test cases (
$\varGamma ^*$
across all test cases ( $0.85 \leq \varGamma ^*/\varGamma _0^* \leq 1.19$
) and
$0.85 \leq \varGamma ^*/\varGamma _0^* \leq 1.19$
) and $ ( a/a_0 )_{\varGamma ^*}\approx 1$
suggest
$ ( a/a_0 )_{\varGamma ^*}\approx 1$
suggest $\lambda _\varGamma (\hat \varPhi ,\hat c)\approx 0$
, implying that toroidal vorticity remains in plane and is not tilted despite loading. The slight values above unity instead suggest stabilisation and reduced tilting, rather than a real influx from out of plane. In contrast, the clear dependence of
$\lambda _\varGamma (\hat \varPhi ,\hat c)\approx 0$
, implying that toroidal vorticity remains in plane and is not tilted despite loading. The slight values above unity instead suggest stabilisation and reduced tilting, rather than a real influx from out of plane. In contrast, the clear dependence of $r^*_{\textit{core}}$
on loading and the roughly linear increase of
$r^*_{\textit{core}}$
on loading and the roughly linear increase of $ ( a/a_0 )_{r_{\textit{core}}^*}$
imply a non-zero
$ ( a/a_0 )_{r_{\textit{core}}^*}$
imply a non-zero $\lambda _r$
, estimated as
$\lambda _r$
, estimated as $\lambda _r \approx (1+1(\hat \varPhi ,\hat c))^{-4}-1$
, assuming
$\lambda _r \approx (1+1(\hat \varPhi ,\hat c))^{-4}-1$
, assuming $\varGamma ^*/\varGamma _0^*\approx 1$
. We plot this function with
$\varGamma ^*/\varGamma _0^*\approx 1$
. We plot this function with $\lambda _\varGamma =0$
in figure 7. As shown,
$\lambda _\varGamma =0$
in figure 7. As shown, $\lambda _r$
gradually decreases and approaches
$\lambda _r$
gradually decreases and approaches $-1$
as loading increases, reflecting stronger vorticity redistribution from the core to the periphery and reduced core sharpness.
$-1$
as loading increases, reflecting stronger vorticity redistribution from the core to the periphery and reduced core sharpness.
Before closing this section, we emphasise that these results, particularly figures 6(b) and 7, highlight the risk of selecting polymer-solution analogues based only on viscosity matching, as is common in cardiovascular studies (Deplano et al. Reference Deplano, Knapp, Bailly and Bertrand2014; Wu et al. Reference Wu, Aubry, Antaki and Massoudi2020; Yi et al. Reference Yi, Yang, Johnson, Bramlage and Ludwig2022). As shown, conventional polymer analogues – typically dilute or semi-dilute – significantly underrepresent vortex-core spreading compared with physiological blood, which behaves as a concentrated suspension. By comparing $ ( a/a_0 )_{r_{\textit{core}}^*}$
values, analogues likely underestimate core spreading by approximately 50 %, with values around 1.2 for analogues and 2.3 for dense suspensions. Overall, this suggests that conventional analogues attenuate vorticity transfer from vortex cores to the periphery, potentially misrepresenting the key collective dispersion dynamics in separated and turbulent flows under concentrated loading conditions.
$ ( a/a_0 )_{r_{\textit{core}}^*}$
values, analogues likely underestimate core spreading by approximately 50 %, with values around 1.2 for analogues and 2.3 for dense suspensions. Overall, this suggests that conventional analogues attenuate vorticity transfer from vortex cores to the periphery, potentially misrepresenting the key collective dispersion dynamics in separated and turbulent flows under concentrated loading conditions.
Integral ratio between the loading source term and shear-layer feeding rate ( $\lambda _\varGamma$
, solid line) and ratio between loading source term and shear-layer feeding rate near the vortex core (
$\lambda _\varGamma$
, solid line) and ratio between loading source term and shear-layer feeding rate near the vortex core ( $\lambda _r$
, dashed line), as determined by the results.
$\lambda _r$
, dashed line), as determined by the results.

3.2. Topological parallels and differences: vorticity and turbulent kinetic energy profiles
Typical instantaneous profiles of toroidal vorticity are presented in figure 8 to quantify how loading in suspensions and polymer solutions locally alters the vortex core, and to highlight the shared structural response between the two media. In this analysis, the toroidal vorticity is multiplied by the circumference at each radial location to capture the local contribution to circulation, i.e. $2\pi r^* \omega _s^*$
. The top row of figure 8 shows
$2\pi r^* \omega _s^*$
. The top row of figure 8 shows $2\pi r^* \omega _s^*$
for suspensions (red curves) and polymer solutions (blue curves) at corresponding times and Reynolds numbers. The bottom row shows these profiles rescaled following the Lamb–Oseen vortex model (1.11). Since loading does not significantly affect circulation (
$2\pi r^* \omega _s^*$
for suspensions (red curves) and polymer solutions (blue curves) at corresponding times and Reynolds numbers. The bottom row shows these profiles rescaled following the Lamb–Oseen vortex model (1.11). Since loading does not significantly affect circulation ( $\varGamma /\varGamma _0 \approx 1$
), the profiles should align when vorticity is scaled by
$\varGamma /\varGamma _0 \approx 1$
), the profiles should align when vorticity is scaled by $r_{\textit{core}}^2$
and radial distance by
$r_{\textit{core}}^2$
and radial distance by $r_{\textit{core}}^{-1}$
. To achieve this, the abscissa and ordinate are respectively multiplied by
$r_{\textit{core}}^{-1}$
. To achieve this, the abscissa and ordinate are respectively multiplied by $(1 + m(\hat {\varPhi }, \hat {c}))^1$
and
$(1 + m(\hat {\varPhi }, \hat {c}))^1$
and $(1 + m(\hat {\varPhi }, \hat {c}))^{-1}$
, where
$(1 + m(\hat {\varPhi }, \hat {c}))^{-1}$
, where $m = 1$
, effectively mapping loaded profiles onto the space of the unloaded medium. All curves use the same colouring scheme as in figure 5, with shaded regions indicating 5 % propagated velocity-field error.
$m = 1$
, effectively mapping loaded profiles onto the space of the unloaded medium. All curves use the same colouring scheme as in figure 5, with shaded regions indicating 5 % propagated velocity-field error.
Instantaneous dimensionless vorticity profiles measured radially from the vortex core and multiplied by $2\pi r^*$
, estimating each radial position’s contribution to circulation, are shown for suspensions (a–d, red) and polymer solutions (e–h, blue). Columns are arranged by Reynolds number (indicated in headers). The first row shows unscaled profiles; the second row applies Lamb–Oseen scaling using
$2\pi r^*$
, estimating each radial position’s contribution to circulation, are shown for suspensions (a–d, red) and polymer solutions (e–h, blue). Columns are arranged by Reynolds number (indicated in headers). The first row shows unscaled profiles; the second row applies Lamb–Oseen scaling using $1 + m(\hat {\varPhi }, \hat {c})$
, with
$1 + m(\hat {\varPhi }, \hat {c})$
, with $m = 1$
. Across both suspensions and solutions,
$m = 1$
. Across both suspensions and solutions, $\omega ^*$
decays with a similar slope beyond its peak, particularly in turbulent cases. While Lamb–Oseen scaling aligns the peaks of
$\omega ^*$
decays with a similar slope beyond its peak, particularly in turbulent cases. While Lamb–Oseen scaling aligns the peaks of $\omega ^*$
, it increasingly overestimates their magnitude as loading increases.
$\omega ^*$
, it increasingly overestimates their magnitude as loading increases.

The unscaled vorticity profiles (figure 8, top rows) show a consistent trend across cases: each curve rises from zero to a peak near the vortex core and then decays. As loading increases in either suspensions or polymer solutions, the curves flatten and widen, reflecting broader cores and reduced vorticity gradients. This behaviour is consistent with the core expansion seen in the vorticity fields and with the circulation trends in figure 5, indicating that vorticity is increasingly redistributed from the core to the surroundings. These results also agree with Zhang & Rival (Reference Zhang and Rival2020), who reported decreasing maximum vorticity with higher loading in suspensions. Notably, beyond their maxima, the curves share a similar slope across all loadings, suggesting that while loading alters core diffusion, it has limited impact on far-field vorticity diffusion, which remains largely governed by the carrier phase. Although a direct assessment of ${\nabla} ^2\omega$
would be needed to fully confirm identical diffusion rates outside the core, the comparable downstream slopes strongly support this interpretation. Finally, similar to the trends in core size and circulation, the influence of loading diminishes at higher Reynolds numbers, with curves converging more closely at high Reynolds numbers (figure 8
c,g) than at low Reynolds numbers (figure 8
a,e), for both media. This convergence suggests that at higher Reynolds numbers, energy transfer from the vortex core to the periphery becomes increasingly controlled by the turbulent cascade dynamics rather than by loading effects alone. This shift toward turbulence-dominated behaviour with increasing Reynolds number is consistent with observations in sudden expansions involving polymer solutions (Pereira & Pinho Reference Pereira and Pinho2000; Barnes et al. Reference Barnes, Rosi and Rival2025) and in wall-bounded turbulence in suspensions (Picano et al. Reference Picano, Breugem and Brandt2015; Costa et al. Reference Costa, Picano, Brandt and Breugem2018).
${\nabla} ^2\omega$
would be needed to fully confirm identical diffusion rates outside the core, the comparable downstream slopes strongly support this interpretation. Finally, similar to the trends in core size and circulation, the influence of loading diminishes at higher Reynolds numbers, with curves converging more closely at high Reynolds numbers (figure 8
c,g) than at low Reynolds numbers (figure 8
a,e), for both media. This convergence suggests that at higher Reynolds numbers, energy transfer from the vortex core to the periphery becomes increasingly controlled by the turbulent cascade dynamics rather than by loading effects alone. This shift toward turbulence-dominated behaviour with increasing Reynolds number is consistent with observations in sudden expansions involving polymer solutions (Pereira & Pinho Reference Pereira and Pinho2000; Barnes et al. Reference Barnes, Rosi and Rival2025) and in wall-bounded turbulence in suspensions (Picano et al. Reference Picano, Breugem and Brandt2015; Costa et al. Reference Costa, Picano, Brandt and Breugem2018).
The same vorticity profiles rescaled according to the Lamb–Oseen vortex are presented in the bottom row of figure 8. Across all loadings and Reynolds numbers, the scaled profiles reach their maxima near 0.075 and show partial convergence around 0.20. This suggests that the locations of maximum-circulation contribution and the point beyond which vorticity diffusion is determined by the base fluid occur at similar non-dimensional radial distances across cases, indicating some shared self-similar structure. However, this convergence is not exact: differences persist particularly in the core region, with more vorticity being redistributed from the core centre toward its periphery. This results in an overshoot at the maximum-circulation peak in the scaled profiles compared with the unloaded case. In summary, the scaled profiles reveal approximate self-similarity in terms of characteristic points, but the detailed distribution of vorticity within the core remains strongly influenced by loading, becoming broader and less peaked relative to a Lamb–Oseen profile as loading increases.
The enhanced outward transport of vorticity with higher loading and the convergence toward a common outer vorticity gradient align with prior computational studies on suspensions. For example, direct numerical simulations by Druzhinin (Reference Druzhinin1994, Reference Druzhinin1995) demonstrated increased vorticity transfer from the core at higher loadings, attributed to particle concentration waves that experience elevated vorticity near their crests and a corresponding reduction of vorticity within the vortex core, thereby enhancing outward radial transport of vorticity through momentum exchange between particles and the fluid. Simulations presented in Shuai & Kasbaoui (Reference Shuai and Kasbaoui2022) and Shuai et al. (Reference Shuai, Jeswin Dhas, Roy and Kasbaoui2022) confirmed these findings, observing particle concentration rings that evolve into spiral-like instabilities, leading to flattening and widening of the vorticity profile and eventual vortex breakdown. These concentration inhomogeneities are therefore an intrinsic component of particle–vortex interaction and contribute directly to the observed vorticity redistribution.
As mentioned in the Introduction, previous studies – such as Zhang & Rival (Reference Zhang and Rival2020) on suspensions and Barnes et al. (Reference Barnes, Rosi and Rival2025) on polymer solutions – have shown that, despite larger cores, vortex rings and shear layers in loaded media exhibit greater stability than their unloaded counterparts. Specifically, Zhang & Rival (Reference Zhang and Rival2020) found that confined vortex rings in dense suspensions persisted further downstream, while those in unloaded fluids broke down quickly due to wall interactions. Similarly, Barnes et al. (Reference Barnes, Rosi and Rival2025) reported that shear-layer instabilities in polymer solutions persisted longer along the velocity discontinuity line, despite their larger cores. To explain this apparent paradox – greater stability despite broader cores – we examine the TKE, $\overline {k^*}$
, within the vortex core. Figure 9 shows
$\overline {k^*}$
, within the vortex core. Figure 9 shows $\overline {k^*}$
as a function of
$\overline {k^*}$
as a function of $r^*$
for suspensions (a, b) and polymer solutions (c, d) at both Reynolds numbers, using the same colour scheme as figure 8. Values are shown only for
$r^*$
for suspensions (a, b) and polymer solutions (c, d) at both Reynolds numbers, using the same colour scheme as figure 8. Values are shown only for $r^* \lt 0.1$
, corresponding to the core region where time dependence is minimal. Across all cases, higher loading clearly reduces
$r^* \lt 0.1$
, corresponding to the core region where time dependence is minimal. Across all cases, higher loading clearly reduces $\overline {k^*}$
, indicating that loading attenuates turbulence within the core. This turbulence reduction offers a plausible explanation for the observed increased stability: although larger cores are topologically more prone to instability, the suppressed turbulence delays or prevents breakdown. In other words, while an unloaded vortex ring with a tighter core is theoretically more robust to distortions, it remains more vulnerable due to its higher internal turbulence.
$\overline {k^*}$
, indicating that loading attenuates turbulence within the core. This turbulence reduction offers a plausible explanation for the observed increased stability: although larger cores are topologically more prone to instability, the suppressed turbulence delays or prevents breakdown. In other words, while an unloaded vortex ring with a tighter core is theoretically more robust to distortions, it remains more vulnerable due to its higher internal turbulence.
The section concludes by assessing the parallels between suspensions and polymer solutions when compared at similar loading factors, based on both the mean vorticity profiles in figure 8 and the TKE profiles in figure 9. The mean vorticity profiles show generally good agreement between suspensions and polymer solutions at matched loading factors. Specifically, the location and magnitude of the vorticity peaks, as well as the decay beyond the peak, align well between the suspension case at $\hat \varPhi = 0.5$
and the polymer solution at
$\hat \varPhi = 0.5$
and the polymer solution at $\hat c = 0.45$
. Similar agreement is observed at lower loadings (e.g.
$\hat c = 0.45$
. Similar agreement is observed at lower loadings (e.g. $\hat \varPhi = 0.05$
and
$\hat \varPhi = 0.05$
and $\hat c = 0.023$
). This correspondence also holds for the scaled vorticity profiles shown in the lower row of figure 8. The shared mean topological parallels across the two media further indicate a shared collective dynamic behaviour that outweighs the influence of the distinct individual characteristics of the disparate dispersions. This observation is consistent with the shared integral behaviour in circulation and vortex-core size discussed in the previous section. However, while the collective dynamical response common to both flow media appears to govern the mean topological features of the flow, it does not necessarily control all flow characteristics. Specifically, although the TKE profiles in figure 9 display qualitatively similar trends, they do not coincide quantitatively. Polymer solutions consistently show lower
$\hat c = 0.023$
). This correspondence also holds for the scaled vorticity profiles shown in the lower row of figure 8. The shared mean topological parallels across the two media further indicate a shared collective dynamic behaviour that outweighs the influence of the distinct individual characteristics of the disparate dispersions. This observation is consistent with the shared integral behaviour in circulation and vortex-core size discussed in the previous section. However, while the collective dynamical response common to both flow media appears to govern the mean topological features of the flow, it does not necessarily control all flow characteristics. Specifically, although the TKE profiles in figure 9 display qualitatively similar trends, they do not coincide quantitatively. Polymer solutions consistently show lower $\overline {k^*}$
magnitudes than their suspension counterparts at the same loading. Moreover, increasing the Reynolds number leads to a substantial increase in
$\overline {k^*}$
magnitudes than their suspension counterparts at the same loading. Moreover, increasing the Reynolds number leads to a substantial increase in $\overline {k^*}$
for suspensions, while polymer solutions show little change with Reynolds number.
$\overline {k^*}$
for suspensions, while polymer solutions show little change with Reynolds number.
Mean profiles of TKE averaged over all trials and time ( $\overline {k^*}$
), measured radially from the vortex core in non-dimensional terms, for suspensions (a–b, red) and xanthan-gum solutions (c–d, blue). Headers indicate different Reynolds-number cases. For both polymer solutions and suspensions, increases in loading result in a reduction in
$\overline {k^*}$
), measured radially from the vortex core in non-dimensional terms, for suspensions (a–b, red) and xanthan-gum solutions (c–d, blue). Headers indicate different Reynolds-number cases. For both polymer solutions and suspensions, increases in loading result in a reduction in $\overline {k^*}$
. However, an increase in Reynolds number induces different responses in the two flow media: whereas suspensions experience an increase in
$\overline {k^*}$
. However, an increase in Reynolds number induces different responses in the two flow media: whereas suspensions experience an increase in $\overline {k^*}$
for the higher Re case, the polymer solutions exhibit similar values for both Re cases.
$\overline {k^*}$
for the higher Re case, the polymer solutions exhibit similar values for both Re cases.

The divergence in TKE likely arises from fundamental differences in the individual characteristics of the dispersions and underscores the limitations of the shared collective dynamics between the two media. Suspended particles exhibit limited compliance, whereas polymer chains can stretch and recoil in response to velocity gradients. In dilute polymer solutions, this elastic response generates viscoelastic stresses that oppose rapid rotational and extensional motions, effectively reducing the swirling strength of vortical structures on time scales comparable to or shorter than the polymer relaxation time, and diverting TKE into elastic energy stored within the chains. This mechanism is consistent with the observed attenuation of small-scale, high-energy motions and the redistribution of energy toward larger, lower-energy structures reported in turbulent polymer flows, as reflected in energy spectra and Reynolds-stress profiles of canonical configurations (Warholic et al. Reference Warholic, Heist, Katcher and Hanratty2001; Saeed & Elbing Reference Saeed and Elbing2023). In contrast, rigid particles in suspensions interact with the flow primarily through inertia, wake generation and inter-particle interactions. Rather than damping turbulent motions elastically, particles disrupt coherent structures and redistribute TKE across scales via the wake dynamics and vortex shedding, processes that can promote turbulence augmentation without necessarily reducing its overall magnitude (Brandt & Coletti Reference Brandt and Coletti2022; Chiarini & Rosti Reference Chiarini and Rosti2024). Thus, whereas polymer compliance leads to turbulence attenuation through energy storage within the dispersed phase, non-compliant particles primarily redistribute TKE within the flow.
4. Discussion
Given the observed modifications to the integral and topological behaviour of confined vortex rings in both suspensions and polymer solutions, we now return to the central aim of this study: to characterise how a canonical coherent structure – the confined vortex ring – is similarly altered across the loading regimes of these two media, and to use the extent of these similarities as a metric of their shared collective dynamics, despite the differing individual characteristics of their respective dispersions. Importantly, these similarities and differences are not interpreted as a generic consequence of apparent viscosity, but are instead understood through the quantitative agreement – and divergence – of multiple vortex metrics when described using a normalised-loading framework. Furthermore, the comparison presented in this study delineates the limits of the proposed cross-media analogy.
Broadly, the vortex rings in both media exhibited similar structural modification behaviour with increased loading: the vortex core became broader and more diffuse in both media. However, the significance of this observation lies not in the diffusion itself, but in the quantitative alignment of vortex metrics under a unified, normalised-loading framework. A shared collective dynamic behaviour is consistent with analogous findings in prior studies on coherent-structure broadening in dense suspensions (Kiger & Pan Reference Kiger and Pan2002; Berk & Coletti Reference Berk and Coletti2020) and in polymer solutions (Arosemena et al. Reference Arosemena, Andersson and Solsvik2021a ). Similar broadening and diffusion have been observed in jets and sudden-expansion flows involving polymers, where small-scale, concentrated vortical structures transition into larger, more diffuse and more stable forms (Pak, Cho & Choi Reference Pak, Cho and Choi1990; Poole & Escudier Reference Poole and Escudier2003, Reference Poole and Escudier2004; Poole, Escudier & Oliveira Reference Poole, Escudier and Oliveira2005; Guimarães et al. Reference Guimarães, Pimentel, Pinho, Da Silva and Pinho2020, Reference Guimarães, Pinho and Da Silva2025; Barnes et al. Reference Barnes, Rosi and Rival2025). Specific to confined vortex rings, Zhang & Rival (Reference Zhang and Rival2020) and Barnes et al. (Reference Barnes, Zhang and Rival2024) documented enhanced diffusion with loading, confirming the trend found here.
Consistent with the aforementioned examples, the present results are expected to inform studies of unsteady flows dominated by coherent vortical structures, such as turbulent jets, wakes and even local separations in internal flows. In such flows, the large-scale evolution is governed primarily by vorticity transport and the structure of dominant vortical regions, rather than by the steady wall-shear dynamics or fully developed turbulence. Across these flows, the normalised-loading framework proposed here would provide a means of comparing suspension and polymer-solution behaviour and help delineate the limits of polymer analogues as turbulence production becomes significant. In addition, there are qualitative parallels between the behaviour observed in the loaded confined vortex ring studied here and trends reported in fully turbulent flows with increasing loading. In the present experiments, the dominant response involves a transition from a compact, high-energy vortical structure to a broader and more diffuse one, with the polymer solutions exhibiting a higher level of turbulent attenuation relative to the suspensions. In canonical turbulent flows, analogous trends with loading are commonly reflected by changes in the energy spectra from pronounced peaks to broader distributions, together with streamwise Reynolds-stress profiles that evolve from narrow, intense maxima near the centreline or wall (for jets or wall-bounded flows, respectively) to wider and attenuated maxima (Costa et al. Reference Costa, Picano, Brandt and Breugem2016; Guimarães et al. Reference Guimarães, Pimentel, Pinho, Da Silva and Pinho2020; Arosemena et al. Reference Arosemena, Andersson, Andersson and Solsvik2021b ). However, the mechanisms underlying these trends are not identical across the two media. Polymer solutions tend to attenuate small-scale turbulent motions and shift energy toward larger scales, whereas suspensions interact with turbulence at scales comparable to the particle size, redistributing TKE through particle–flow interactions in a manner that transfers energy toward smaller scales depending on particle size and concentration, divergent behaviours that seem analogous to the trends in TKE attenuation observed here.
This study builds upon previous work by quantifying the extent of this shared collective dynamic of these two media using integral measures (circulation and vortex-core growth) and topological behaviour (mean vorticity and TKE profiles) using a unified, normalised-loading framework. By scaling the loading factor relative to its critical value (the onset of the concentrated regime), we demonstrated a strong alignment in vortex modification behaviour across both suspensions and polymer solutions, a result that suggests that the dispersed phase in both flow media share common collective dynamics despite their differing individual characteristics. In terms of integral behaviour, both media maintained toroidal circulation regardless of loading, as confirmed by time traces and loaded-to-unloaded circulation growth-rate ratios (figure 5, 6). In contrast, both appeared to show a linear increase in the vortex-core growth-rate ratio, approximately described by $1 + \mathcal{O}(1)(\hat {\varPhi }, \hat {c})$
, which demonstrates a strong outward transport of vorticity from the core, captured quantitatively via
$1 + \mathcal{O}(1)(\hat {\varPhi }, \hat {c})$
, which demonstrates a strong outward transport of vorticity from the core, captured quantitatively via $\lambda _r$
(figure 7). The consistency of this trend across both media, rather than the precise slope magnitude itself, constitutes strong evidence of shared collective behaviour. Together, these integral results emphasise the shared tendency of both media to promote outward vorticity diffusion while suppressing vortex tilting – despite the differing individual characteristics of their respective dispersions – and point to a common collective behaviour that appears to outweigh the influence of those individual characteristics, insofar as the mean-flow topology is concerned.
$\lambda _r$
(figure 7). The consistency of this trend across both media, rather than the precise slope magnitude itself, constitutes strong evidence of shared collective behaviour. Together, these integral results emphasise the shared tendency of both media to promote outward vorticity diffusion while suppressing vortex tilting – despite the differing individual characteristics of their respective dispersions – and point to a common collective behaviour that appears to outweigh the influence of those individual characteristics, insofar as the mean-flow topology is concerned.
Shared collective dynamics between polymer solutions and suspensions was reflected not only through parallel integral behaviour but through topological similarities as well. Specifically, local-circulation profiles scaled to a Lamb–Oseen vortex revealed that the radial location of maximum-circulation contribution and the approximate radius beyond which diffusion becomes less sensitive to loading are similar across media and Reynolds numbers (figure 8, bottom row). Furthermore, profiles with matched normalised-loading factors showed close agreement across the two flow media, pointing to an underlying self-similarity in the vortex structure, regardless of whether the dispersed phase is solid or chain-like (figure 8, bottom row). These topological and integral parallels support a shift from purely qualitative descriptions toward a quantitative, predictive understanding of the shared collective dynamics across the two flow media, both containing dispersions with disparate individual characteristics. Crucially, we stress that this alignment cannot be inferred from apparent viscosity or equivalent-Reynolds-number arguments alone. Previous work on confined vortex rings in suspensions has shown that matching Reynolds number based on effective-viscosity models fails to reproduce loading-induced vorticity diffusion and core broadening (Zhang & Rival Reference Zhang and Rival2020), indicating that vortex modification is not governed by bulk rheology. Similar limitations of apparent-viscosity-based Reynolds-number matching have been reported in separated and reattaching flows, for both dense suspensions (Rosi et al. Reference Rosi, Barnes, Kaiser and Rival2025) and polymer solutions (Pak et al. Reference Pak, Cho and Choi1990; Pereira & Pinho Reference Pereira and Pinho2000; Poole & Escudier Reference Poole and Escudier2003), where flow structure and reattachment behaviour diverge despite nominally equivalent Reynolds numbers.
Turbulent kinetic energy ( $\overline {k^*}$
) provides a clear limit to the shared collective-dynamics analogy established above. While both media showed attenuation of turbulence with loading, the Reynolds-number dependency diverged: suspensions exhibited a strong increase in
$\overline {k^*}$
) provides a clear limit to the shared collective-dynamics analogy established above. While both media showed attenuation of turbulence with loading, the Reynolds-number dependency diverged: suspensions exhibited a strong increase in $\overline {k^*}$
at higher Reynolds numbers, whereas polymer solutions did not. The behaviour may indicate an effect stemming from the individual characteristics of the dispersions: rigid particles are more prone to re-energising turbulence at high Re, whereas flexible chains (polymers) continue to damp fluctuations via stretching and recoil. This divergence demonstrates that, although integral and topological vortex properties may align under normalised loading, the small-scale dynamics remain sensitive to the individual characteristics of the dispersed phase. Thus, while the parallel integral and topological modifications of the vortex ring suggest strong shared collective dynamics between the two media, they do not imply complete equivalence of the flow-field dynamics, as the individual characteristics of the dispersions still exert some influence. Furthermore, while our results demonstrate shared collective dynamics between suspensions and polymer solutions – evidenced by strong parallels in coherent-structure modification that culminated in partial collapse under normalised loading – caution is warranted. Only three loading factors per medium were tested, and each medium used a single formulation (monodisperse suspension; xanthan-gum solution). This limits the generality of the study’s findings and points to the need for further investigation across broader classes of suspensions and polymers to fully ascertain the extent of the shared collective dynamics between the two media.
$\overline {k^*}$
at higher Reynolds numbers, whereas polymer solutions did not. The behaviour may indicate an effect stemming from the individual characteristics of the dispersions: rigid particles are more prone to re-energising turbulence at high Re, whereas flexible chains (polymers) continue to damp fluctuations via stretching and recoil. This divergence demonstrates that, although integral and topological vortex properties may align under normalised loading, the small-scale dynamics remain sensitive to the individual characteristics of the dispersed phase. Thus, while the parallel integral and topological modifications of the vortex ring suggest strong shared collective dynamics between the two media, they do not imply complete equivalence of the flow-field dynamics, as the individual characteristics of the dispersions still exert some influence. Furthermore, while our results demonstrate shared collective dynamics between suspensions and polymer solutions – evidenced by strong parallels in coherent-structure modification that culminated in partial collapse under normalised loading – caution is warranted. Only three loading factors per medium were tested, and each medium used a single formulation (monodisperse suspension; xanthan-gum solution). This limits the generality of the study’s findings and points to the need for further investigation across broader classes of suspensions and polymers to fully ascertain the extent of the shared collective dynamics between the two media.
Accordingly, the normalised-loading framework is supported as a basis for comparing mean coherent-structure modification, but it does not align all observables; turbulence metrics tied to small-scale dynamics remain dispersion specific. Nonetheless, these results show that polymer solutions can, to some extent, replicate suspension flow features – particularly core broadening and vorticity diffusion – but only if their loading regime is appropriately matched. In cardiovascular research, where polymer solutions are often chosen to match blood rheology, our results question the validity of using dilute or semi-dilute analogues to represent physiological blood, which is a dense suspension. As shown in figure 4(g,h) versus figure 4(m,n), due to concentration-regime mismatching, blood analogues may fail to capture the enhanced core spreading seen in physiological blood, and especially in smaller arterioles. Quantitatively, vortex-core spreading rates are nearly double in dense suspensions (figure 6 b), suggesting roughly a 50 % underestimation of loading effects by conventional blood analogues (figure 7). While the diameter ratio of our test particles exceeds that of physiological blood and thus limits direct physiological extrapolation, this difference does not alter the central conclusion that regime matching is necessary to reproduce the key vortex dynamics. Accordingly, fidelity should be assessed beyond viscosity matching, using canonical-flow benchmarks and shared datasets.
5. Conclusions and outlook
Through experimental characterisation of confined vortex rings across a loading spectrum ranging from dilute to concentrated – using a monodisperse, neutrally buoyant suspension and a xanthan-gum-in-water polymer solution – this study demonstrates clear parallels in coherent-structure modification between the two media when interpreted through a loading factor that is normalised by each medium’s respective critical loading. These quantified parallels emerge despite the disparate individual characteristics of the two media – semi-rigid particles in suspensions and flexible chains in polymer solutions – indicating shared loading-driven collective dynamics that can, under appropriate conditions, outweigh the influence of those individual characteristics, particularly with regard to the mean-flow topology.
The shared collective dynamics between the two flow media were demonstrated through both integral measures and topological markers of the vortex ring across a broad loading spectrum. In terms of integral vortex behaviour, circulation was largely independent of loading in both media, while the ratio of loaded-to-unloaded vortex-core growth rates appeared to follow a linear trend in both media, described by $1 + \mathcal{O}(1)(\hat {\varPhi }, \hat {c})$
, where
$1 + \mathcal{O}(1)(\hat {\varPhi }, \hat {c})$
, where $\hat {\varPhi }$
and
$\hat {\varPhi }$
and $\hat {c}$
denote the suspension volume fraction and polymer concentration, respectively, normalised by critical values. An analysis of the vorticity transport equation linked these behaviours to in-plane and out-of-plane vorticity motions, suggesting that loading in either medium does not promote vortex tilting but instead induces a nonlinear increase in outward vorticity transport from the core. This same linear trend successfully scaled local-circulation profiles based on a Lamb–Oseen vortex, revealing in both media that the radial locations of (i) maximum-circulation contribution and (ii) the approximate point beyond which vorticity diffusion effects became less sensitive to loading both converged toward similar non-dimensional positions of
$\hat {c}$
denote the suspension volume fraction and polymer concentration, respectively, normalised by critical values. An analysis of the vorticity transport equation linked these behaviours to in-plane and out-of-plane vorticity motions, suggesting that loading in either medium does not promote vortex tilting but instead induces a nonlinear increase in outward vorticity transport from the core. This same linear trend successfully scaled local-circulation profiles based on a Lamb–Oseen vortex, revealing in both media that the radial locations of (i) maximum-circulation contribution and (ii) the approximate point beyond which vorticity diffusion effects became less sensitive to loading both converged toward similar non-dimensional positions of $r^*(1 + m(\hat {\varPhi }, \hat {c}))^{-1} \approx 0.075$
and
$r^*(1 + m(\hat {\varPhi }, \hat {c}))^{-1} \approx 0.075$
and $0.2$
, respectively.
$0.2$
, respectively.
While these integral and topological similarities indicate a strong degree of loading-driven convergence between the two media, important limitations in flow-field equivalence also emerged, indicating the continued influence of each medium’s individual dispersion characteristics. Specifically, TKE profiles ( $\overline {k^*}$
) diverged in their Reynolds-number dependence: although
$\overline {k^*}$
) diverged in their Reynolds-number dependence: although $\overline {k^*}$
decreased with loading in both media, it increased with Reynolds number for suspensions but remained largely unchanged in polymer solutions. This divergence likely stems from individual characteristics of the dispersions: the limited compliance of suspended particles compared with the enhanced damping from stretching and recoiling polymer chains.
$\overline {k^*}$
decreased with loading in both media, it increased with Reynolds number for suspensions but remained largely unchanged in polymer solutions. This divergence likely stems from individual characteristics of the dispersions: the limited compliance of suspended particles compared with the enhanced damping from stretching and recoiling polymer chains.
The results show that a sufficiently loaded polymer solution can replicate key mean coherent features of a dense suspension – particularly vortex-core broadening and enhanced vorticity diffusion – offering a simpler experimental alternative for probing collective multiphase dynamics, but do not provide a universal substitute, particularly for turbulence energetics. The findings further highlight the importance of matching concentration regimes between polymer analogues and target suspensions to ensure comparable coherent-structure modification, with implications for applications such as cardiovascular flows.
While the present conclusions are drawn from experiments on a confined vortex ring, their applicability is best understood in terms of the underlying physics rather than the specific flow geometry. In particular, the observed similarities and divergences are most relevant to unsteady, vorticity-dominated flows in which coherent structures govern momentum transport. The results reveal qualitative parallels with turbulent flows, including spectral broadening and redistribution of Reynolds stresses. However, we emphasise that quantitative extrapolation to fully developed turbulence remains an open question and motivates future studies using the proposed normalised-loading framework.
Finally, although this study marks a significant step toward understanding the collective dynamics of polymer solutions and suspensions within a unified loading framework, its findings must be viewed in light of its limited scope. Specifically, only three loading cases were tested for a single monodisperse, neutrally buoyant suspension and a single polymer solution (xanthan gum in water). Furthermore, the critical loading factors ( $\varPhi ^{**}$
,
$\varPhi ^{**}$
, $c^{**}$
) were taken from the literature rather than measured directly for the tested systems. In addition, the observed linear trend in the vortex-core growth rate warrants further investigation to establish its mechanistic origin. Future work should explore a broader range of loading conditions and assess the framework’s generality across diverse suspension and polymer systems while measuring
$c^{**}$
) were taken from the literature rather than measured directly for the tested systems. In addition, the observed linear trend in the vortex-core growth rate warrants further investigation to establish its mechanistic origin. Future work should explore a broader range of loading conditions and assess the framework’s generality across diverse suspension and polymer systems while measuring $\varPhi ^{**}$
and
$\varPhi ^{**}$
and $c^{**}$
directly.
$c^{**}$
directly.
Supplementary movie
Supplementary movie is available at https://doi.org/10.1017/jfm.2026.11572.
Acknowledgements
M.B. acknowledges the support of the Queen’s University School of Graduate Studies and Postdoctoral Affairs (SGSPA) through the Duncan and Ullra Carmichael Fellowship.
Funding
This work was supported by the Natural Sciences and Engineering Research Council of Canada (NSERC) under funding reference number ALLRP-569171-21.
Declaration of interests
The authors report no conflict of interest.
Appendix A. Sensitivity, convergence and confidence intervals of ensemble-averaged quantities
This appendix summarises the sensitivity and convergence analyses used to assess the robustness of ensemble-averaged circulation and vortex-core radius measurements. For each case, ten realisations were randomly resampled with replacement from the available data, and ensemble-averaged values of circulation, $\overline {\varGamma ^*}_{\textit{tot}}$
, and vortex-core radius,
$\overline {\varGamma ^*}_{\textit{tot}}$
, and vortex-core radius, $\overline {r^*_{{core,tot}}}$
, were computed. The convergence errors,
$\overline {r^*_{{core,tot}}}$
, were computed. The convergence errors, $\Delta \overline {\varGamma ^*}$
and
$\Delta \overline {\varGamma ^*}$
and $\Delta \overline {r^*_{\textit{core}}}$
, were then evaluated as a function of the number of realisations included in the ensemble, relative to the full-ensemble mean. This resampling procedure was repeated 200 times for each case. The resulting distributions of ensemble-averaged quantities were compared with the experimental full-ensemble mean to quantify sensitivity to sample selection and to estimate uncertainty through the associated 5 %–95 % confidence intervals. As the upper and lower confidence bounds were of comparable magnitude for all cases considered, only the 95 % bounds are reported here for clarity. Tables 1 and 2, which summarise these estimates, are provided separately for suspensions and polymer solutions, respectively.
$\Delta \overline {r^*_{\textit{core}}}$
, were then evaluated as a function of the number of realisations included in the ensemble, relative to the full-ensemble mean. This resampling procedure was repeated 200 times for each case. The resulting distributions of ensemble-averaged quantities were compared with the experimental full-ensemble mean to quantify sensitivity to sample selection and to estimate uncertainty through the associated 5 %–95 % confidence intervals. As the upper and lower confidence bounds were of comparable magnitude for all cases considered, only the 95 % bounds are reported here for clarity. Tables 1 and 2, which summarise these estimates, are provided separately for suspensions and polymer solutions, respectively.
Bootstrap uncertainty estimates (95 % confidence bound) for suspension cases, based on 200 realisations of resampling ten trials with replacement. Reported values correspond to the uncertainty of the ensemble-averaged circulation $\overline {\varGamma ^*}$
and vortex-core radius
$\overline {\varGamma ^*}$
and vortex-core radius $\overline {r^*_{\textit{core}}}$
.
$\overline {r^*_{\textit{core}}}$
.

Bootstrap uncertainty estimates (95 % confidence bound) for polymer-solution cases, based on 200 realisations of resampling ten trials with replacement. Reported values correspond to the uncertainty of the ensemble-averaged circulation $\overline {\varGamma ^*}$
and vortex-core radius
$\overline {\varGamma ^*}$
and vortex-core radius $\overline {r^*_{\textit{core}}}$
.
$\overline {r^*_{\textit{core}}}$
.

Convergence error with increasing trials in ensemble-averaged circulation ( $\Delta \overline {\varGamma ^*}/\overline {\varGamma ^*}_{\textit{tot}}$
) and vortex-core radius (
$\Delta \overline {\varGamma ^*}/\overline {\varGamma ^*}_{\textit{tot}}$
) and vortex-core radius ( $\Delta \overline {r^*_{\textit{core}}}/\overline {r^*_{\textit{core}}}_{{,tot}}$
) for suspensions and xanthan-gum solutions at different loadings (
$\Delta \overline {r^*_{\textit{core}}}/\overline {r^*_{\textit{core}}}_{{,tot}}$
) for suspensions and xanthan-gum solutions at different loadings ( $\hat {\varPhi }$
and
$\hat {\varPhi }$
and $\hat {c}$
, respectively). Solid curves show the median convergence error; dashed curves show the 95 % bound for the slowest converging case. Carrier-phase circulation-based Reynolds numbers (
$\hat {c}$
, respectively). Solid curves show the median convergence error; dashed curves show the 95 % bound for the slowest converging case. Carrier-phase circulation-based Reynolds numbers ( $\textit{Re}_{\varGamma ,{cp}}$
) appear in the top right of each panel.
$\textit{Re}_{\varGamma ,{cp}}$
) appear in the top right of each panel.

The confidence bounds for $\overline {\varGamma ^*}$
were consistently small across all cases, typically 1 % to 2 % for polymer solutions and 3 % to 4 % for suspensions, while
$\overline {\varGamma ^*}$
were consistently small across all cases, typically 1 % to 2 % for polymer solutions and 3 % to 4 % for suspensions, while $\overline {r^*_{\textit{core}}}$
exhibited larger, but still moderate, sensitivity of approximately 1 %–3 % for polymer solutions and 2 %–13 % for suspensions. Importantly, these bounds remain sufficiently narrow that they do not lead to significant overlap or ambiguity in the temporal trends of
$\overline {r^*_{\textit{core}}}$
exhibited larger, but still moderate, sensitivity of approximately 1 %–3 % for polymer solutions and 2 %–13 % for suspensions. Importantly, these bounds remain sufficiently narrow that they do not lead to significant overlap or ambiguity in the temporal trends of $\varGamma ^*(t)$
or
$\varGamma ^*(t)$
or $r^*_{\textit{core}}(t)$
reported in the main text. Figure 10 presents the convergence behaviour
$r^*_{\textit{core}}(t)$
reported in the main text. Figure 10 presents the convergence behaviour $\overline {\varGamma ^*}$
and
$\overline {\varGamma ^*}$
and $\overline {r^*_{\textit{core}}}$
in terms of percentage deviation from the full-ensemble mean. The convergence analysis demonstrates that the median relative error with respect to the full-ensemble mean falls below 5 % within 4–5 realisations for all cases. For completeness, the convergence error of the 95 % upper confidence bound of the most slowly converging case is shown. Although the upper bound converges more gradually, it nonetheless decreases monotonically with increasing number of trials and asymptotically approaches the ensemble mean. The behaviour confirms that the reported ensemble averages represent convergent physical quantities rather than artefacts of signal degradation or outlier contamination.
$\overline {r^*_{\textit{core}}}$
in terms of percentage deviation from the full-ensemble mean. The convergence analysis demonstrates that the median relative error with respect to the full-ensemble mean falls below 5 % within 4–5 realisations for all cases. For completeness, the convergence error of the 95 % upper confidence bound of the most slowly converging case is shown. Although the upper bound converges more gradually, it nonetheless decreases monotonically with increasing number of trials and asymptotically approaches the ensemble mean. The behaviour confirms that the reported ensemble averages represent convergent physical quantities rather than artefacts of signal degradation or outlier contamination.
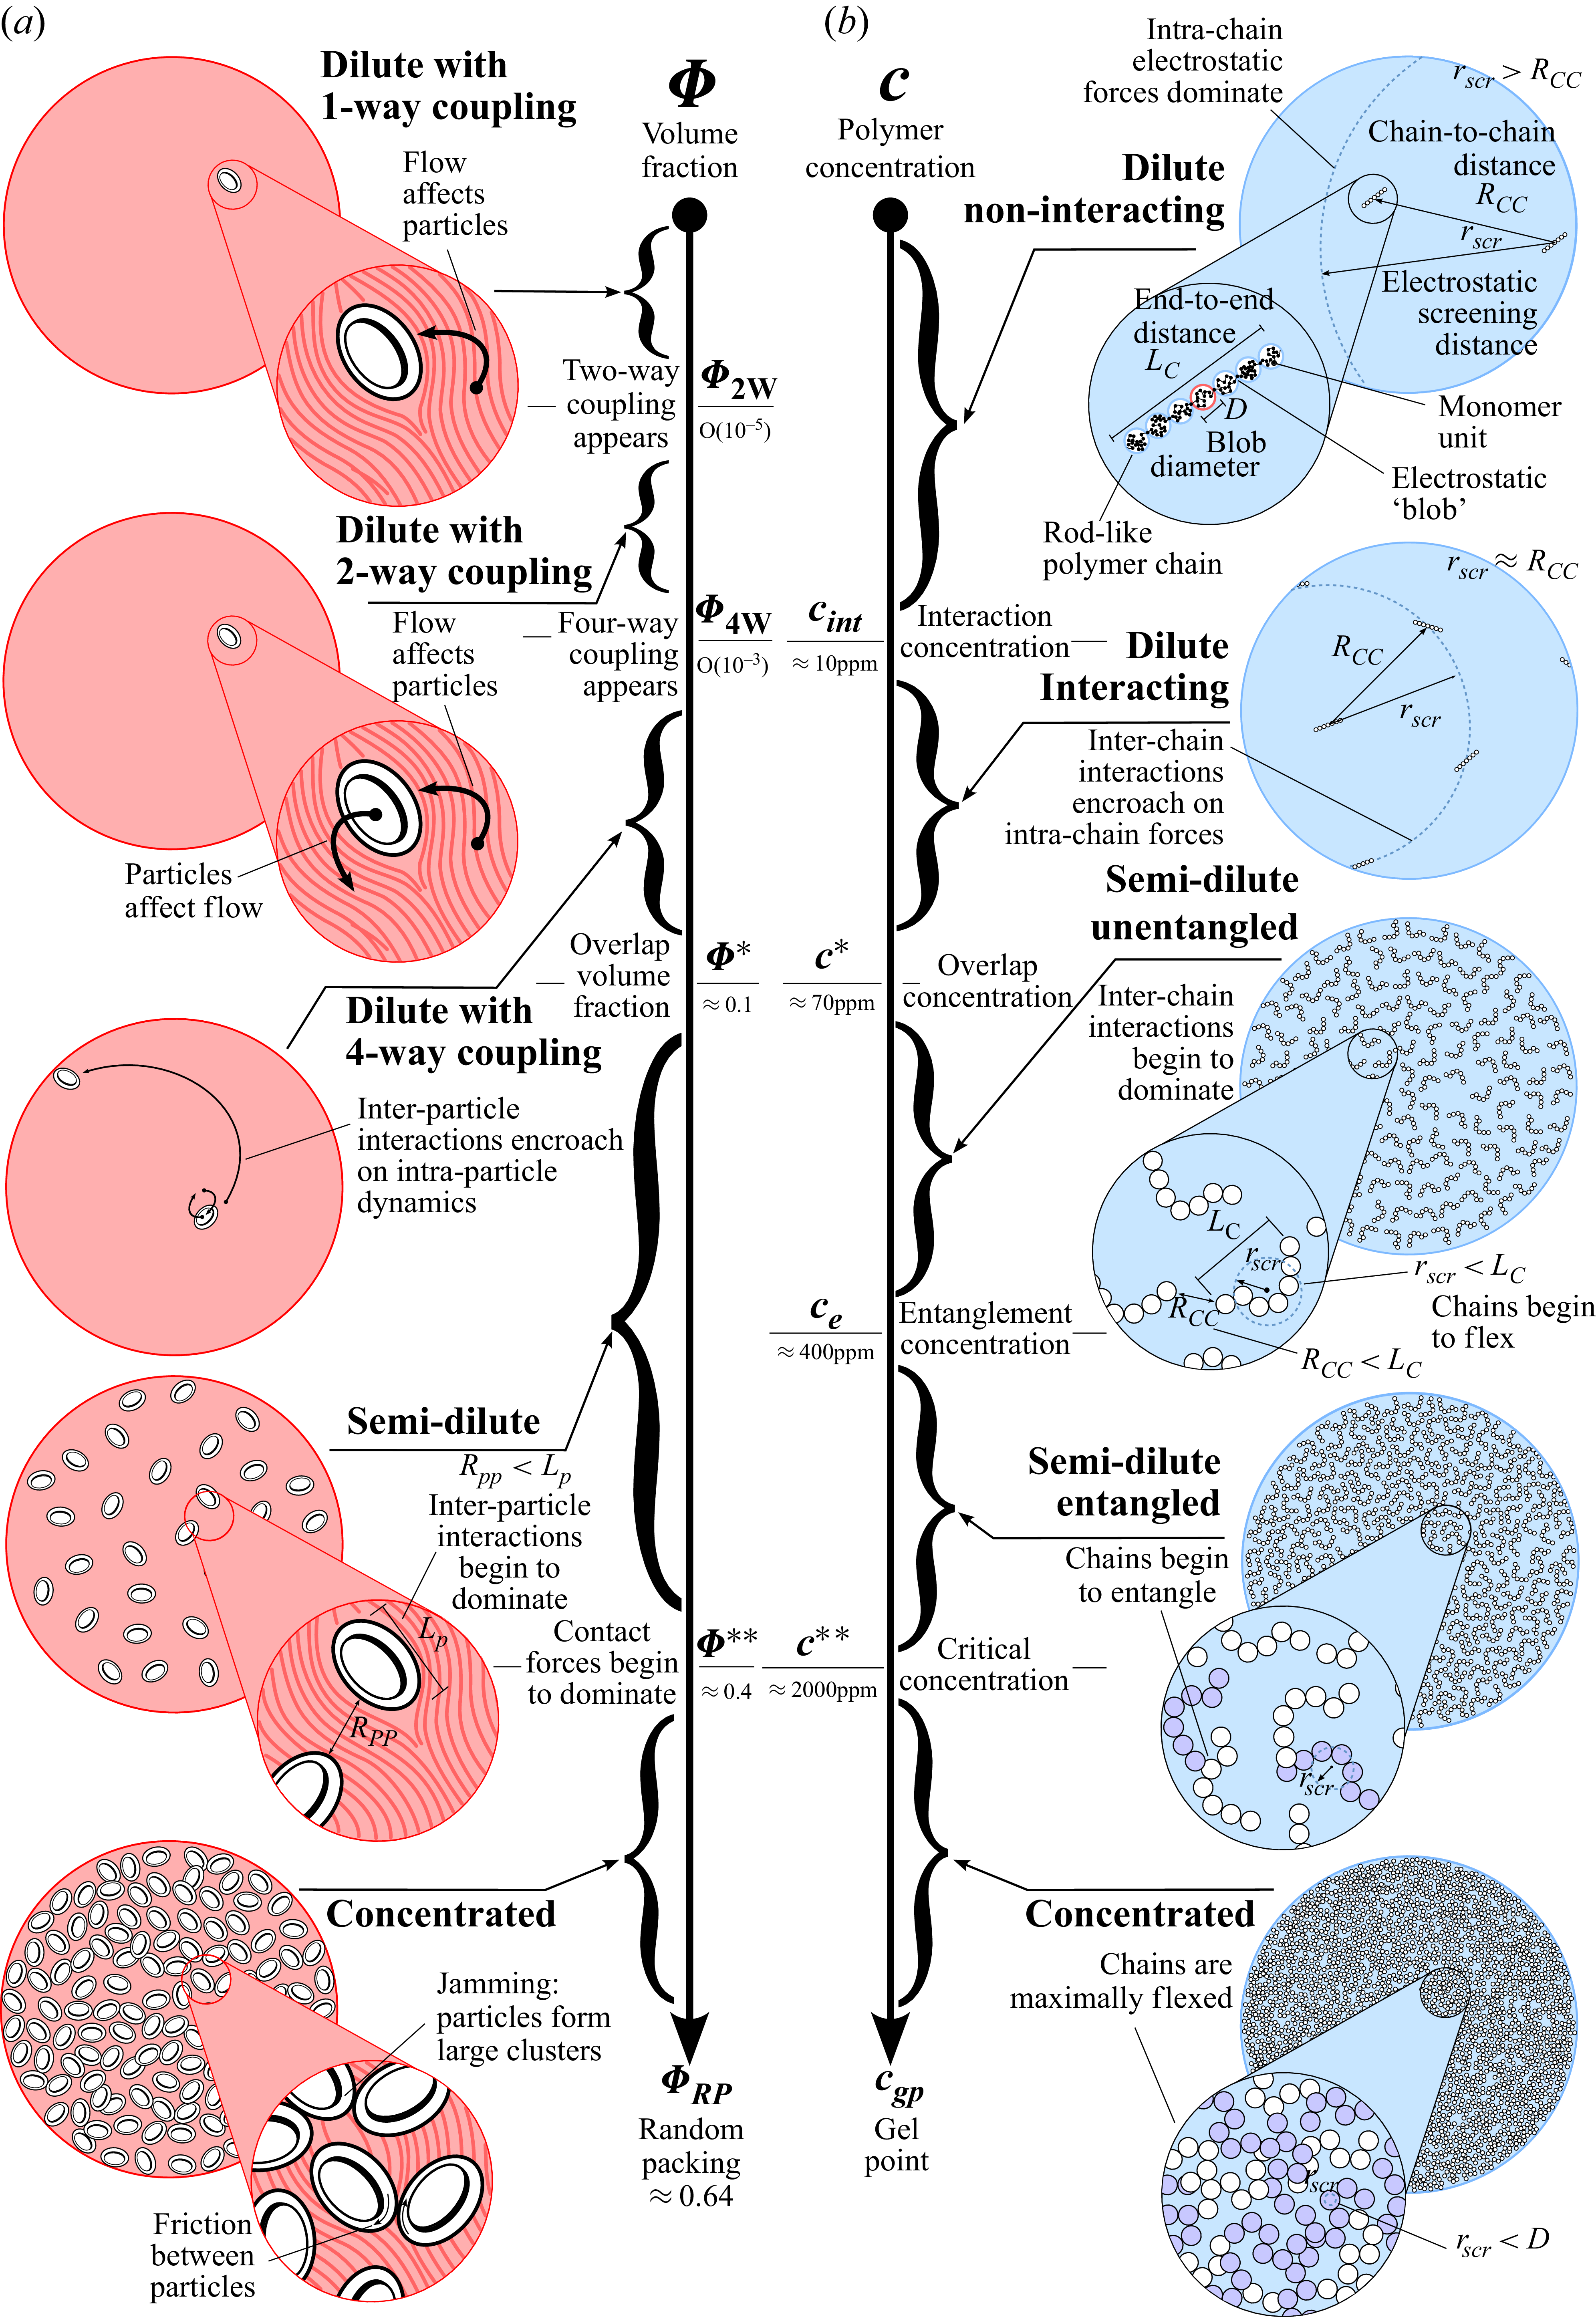
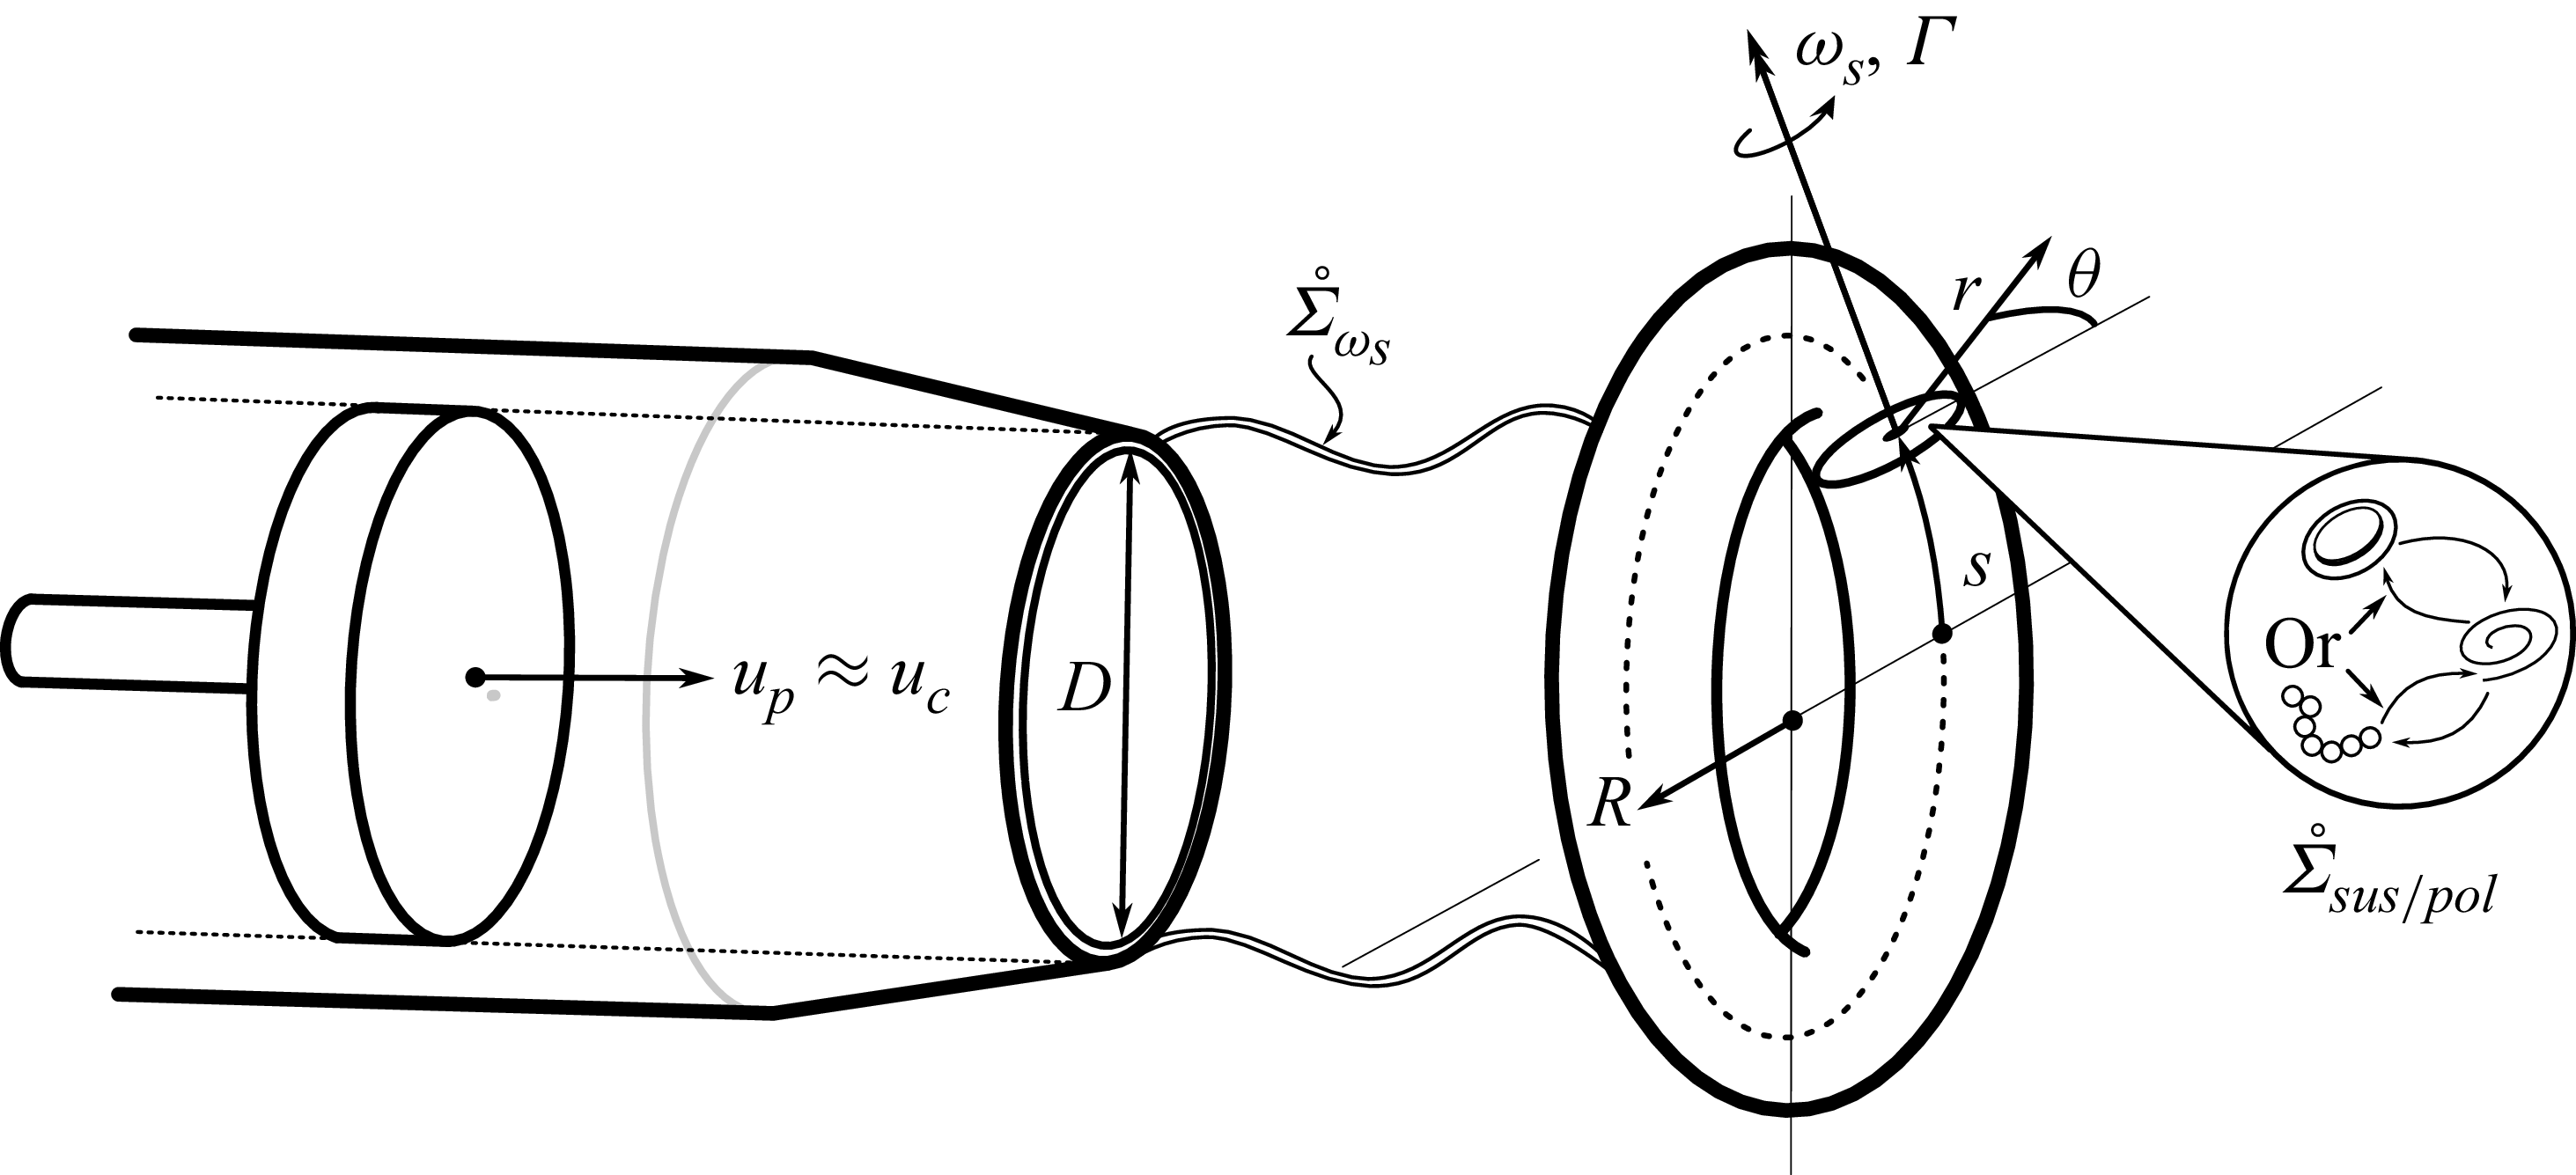
 D
D up
up up≈uc
up≈uc R≈(1/2)D
 (s,r,θ)
 ωs
ωs Σ˙ωs
Σ˙ωs Σ˙sus/pol
 Γ
Γ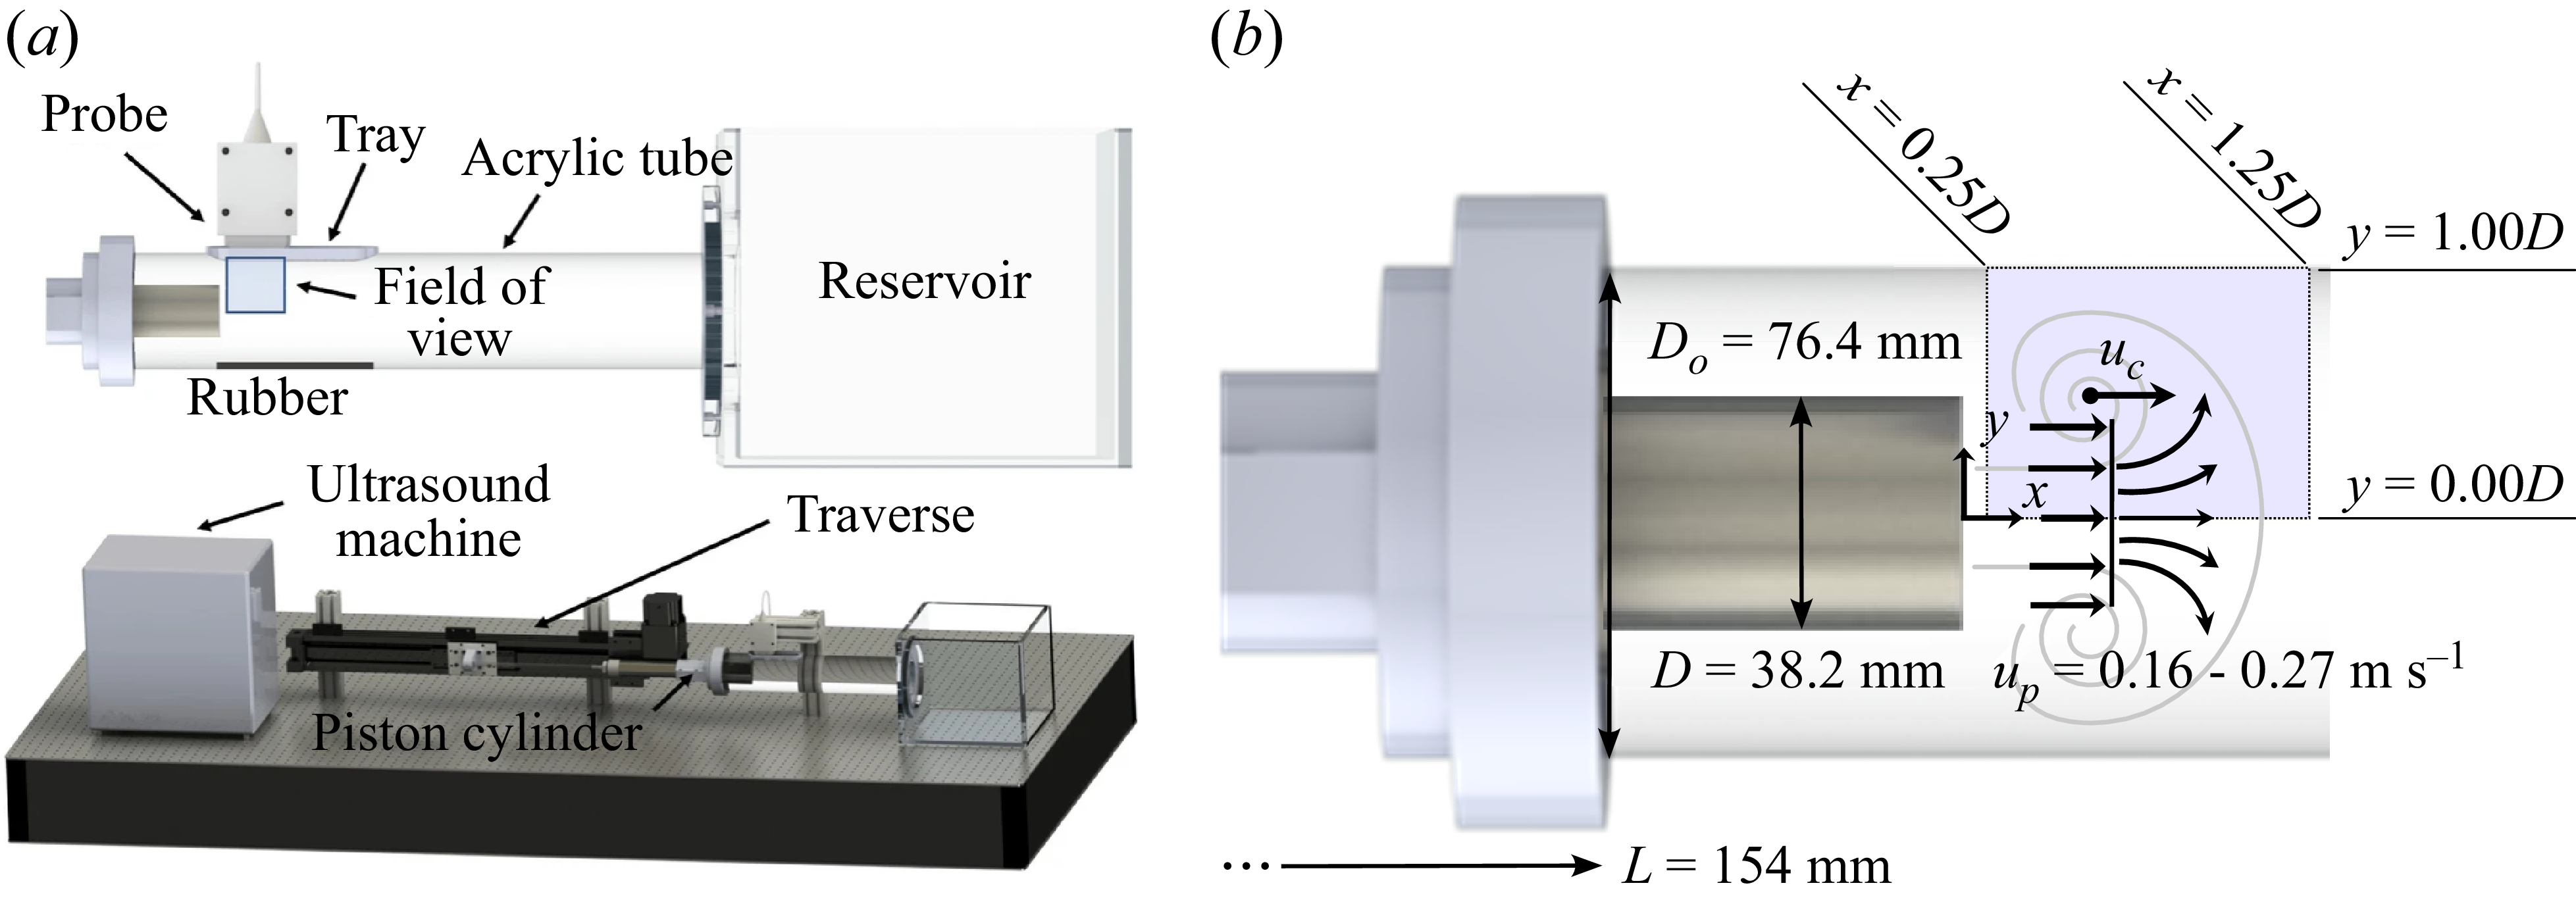
 D
D L
L up
up uc
uc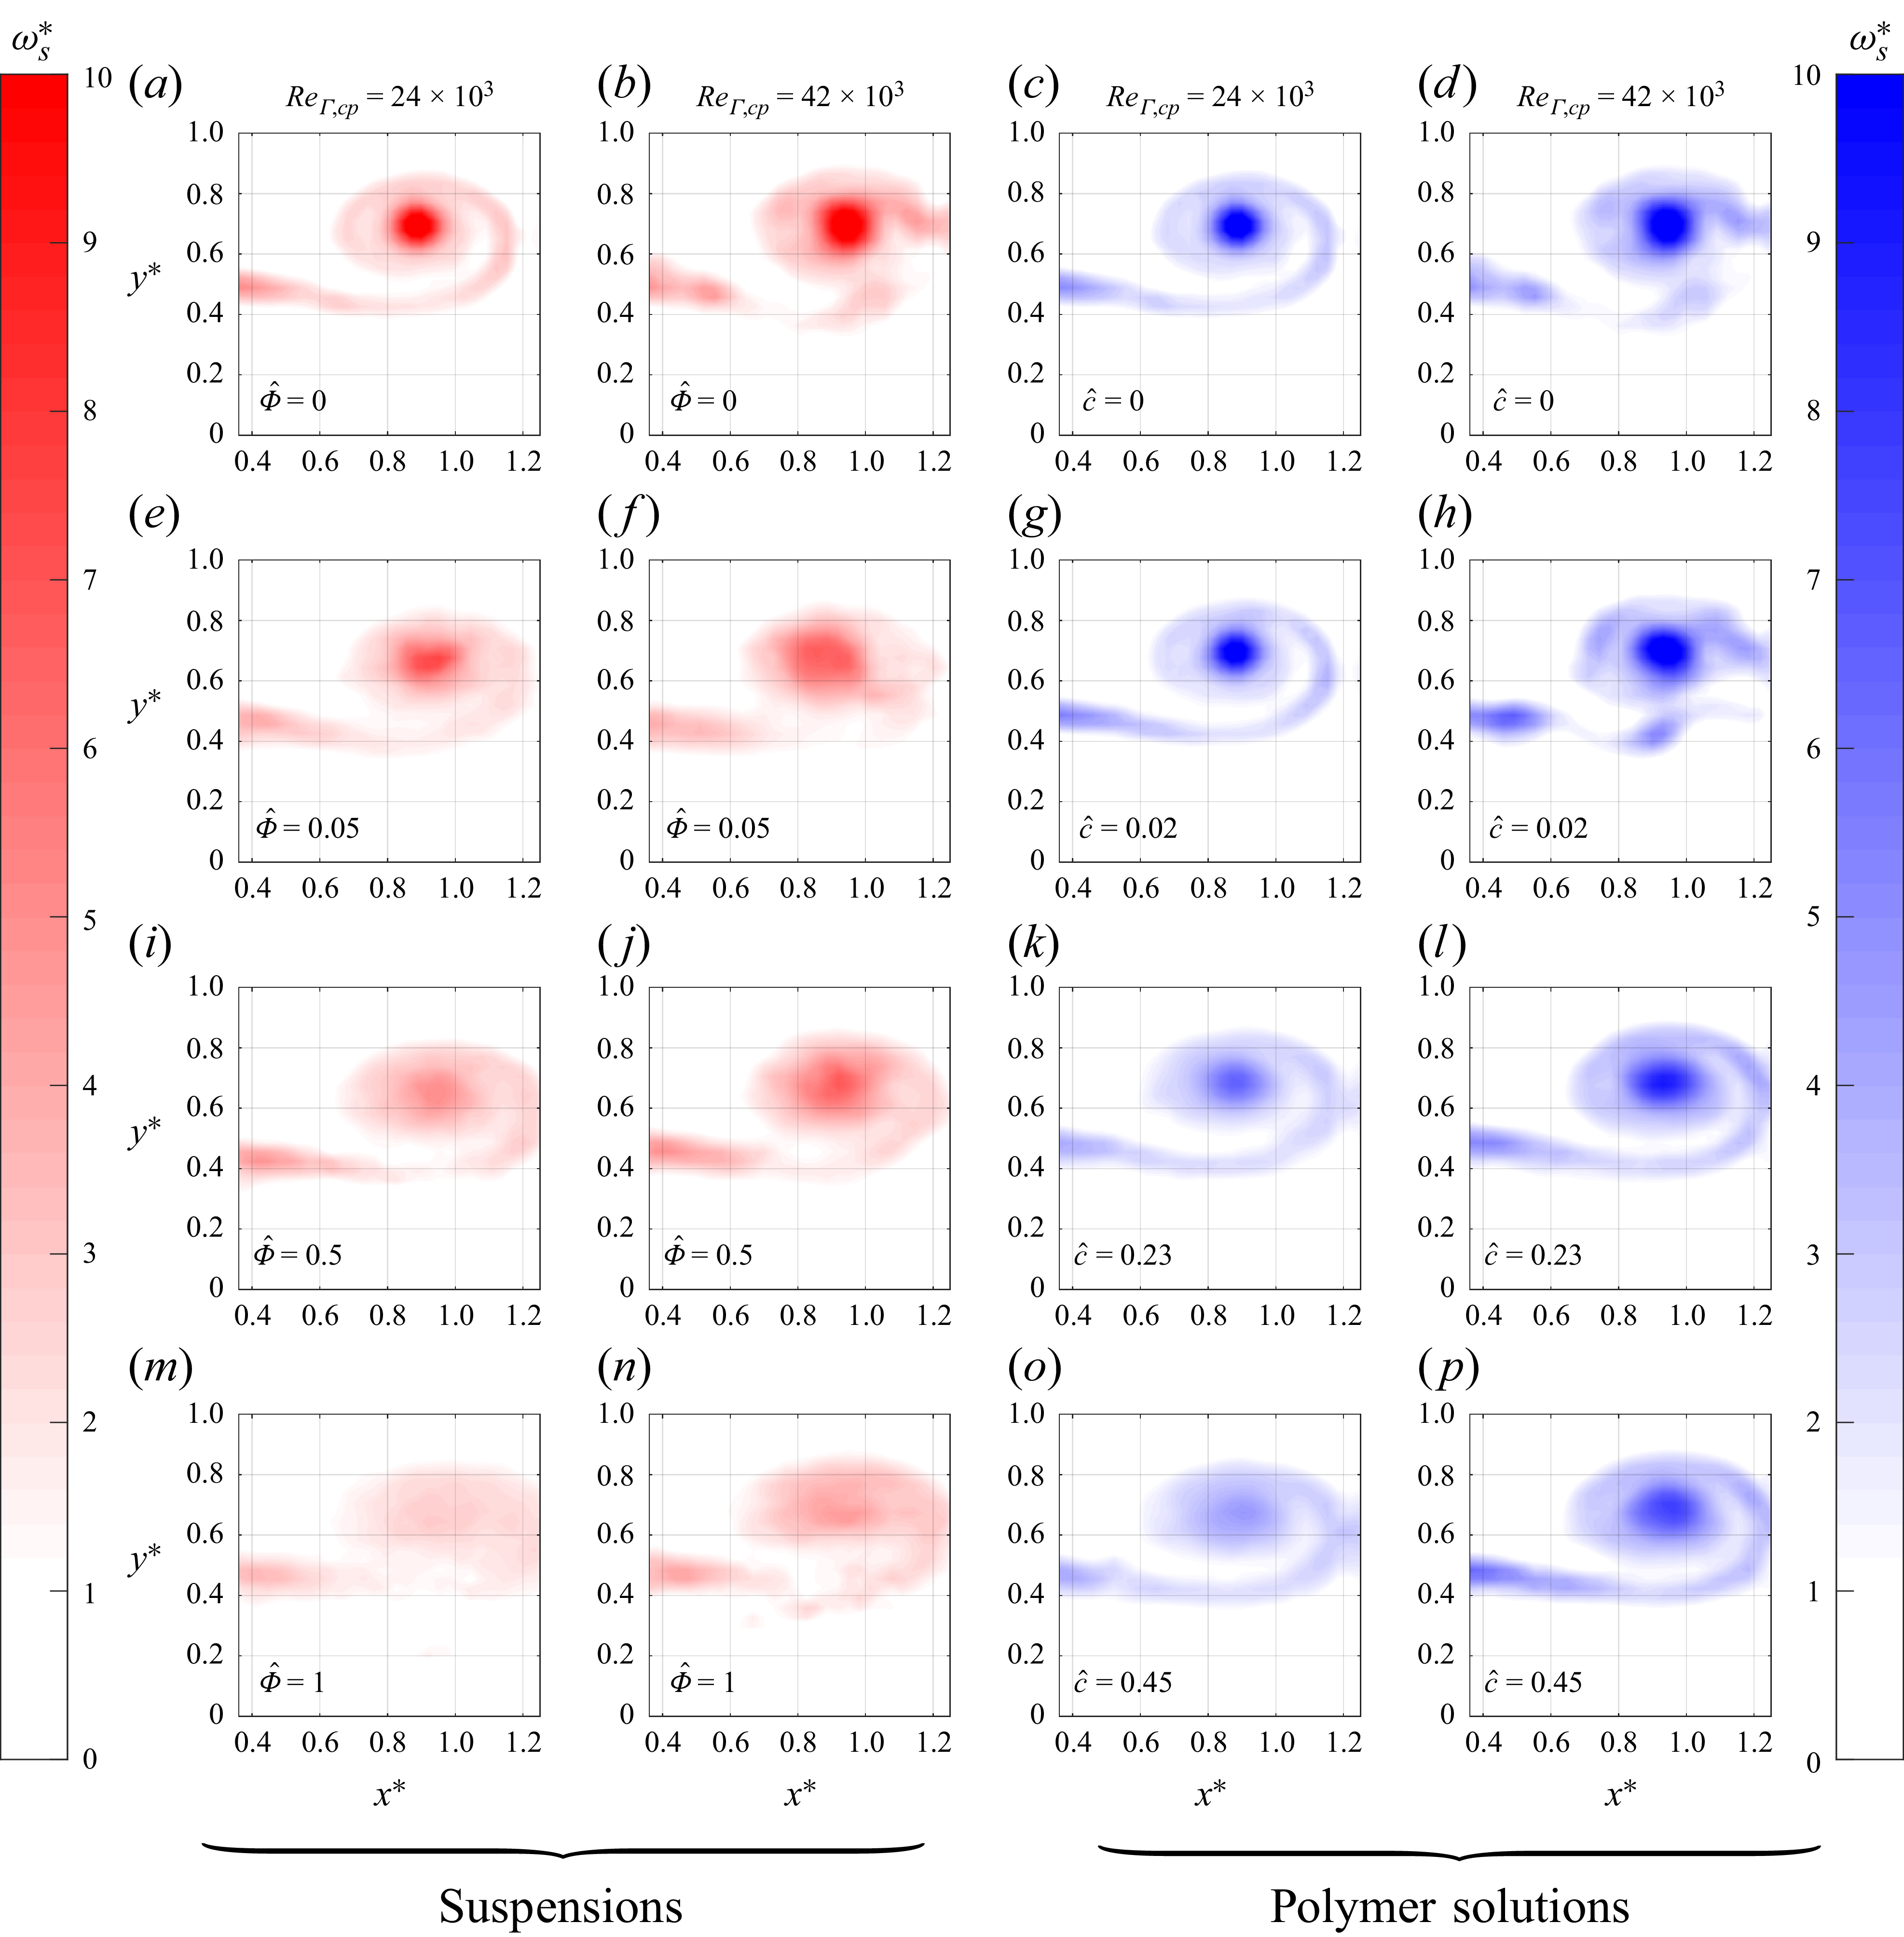
 t∗=3.25
 Φ^orc^
 1.8≤t∗≤3.2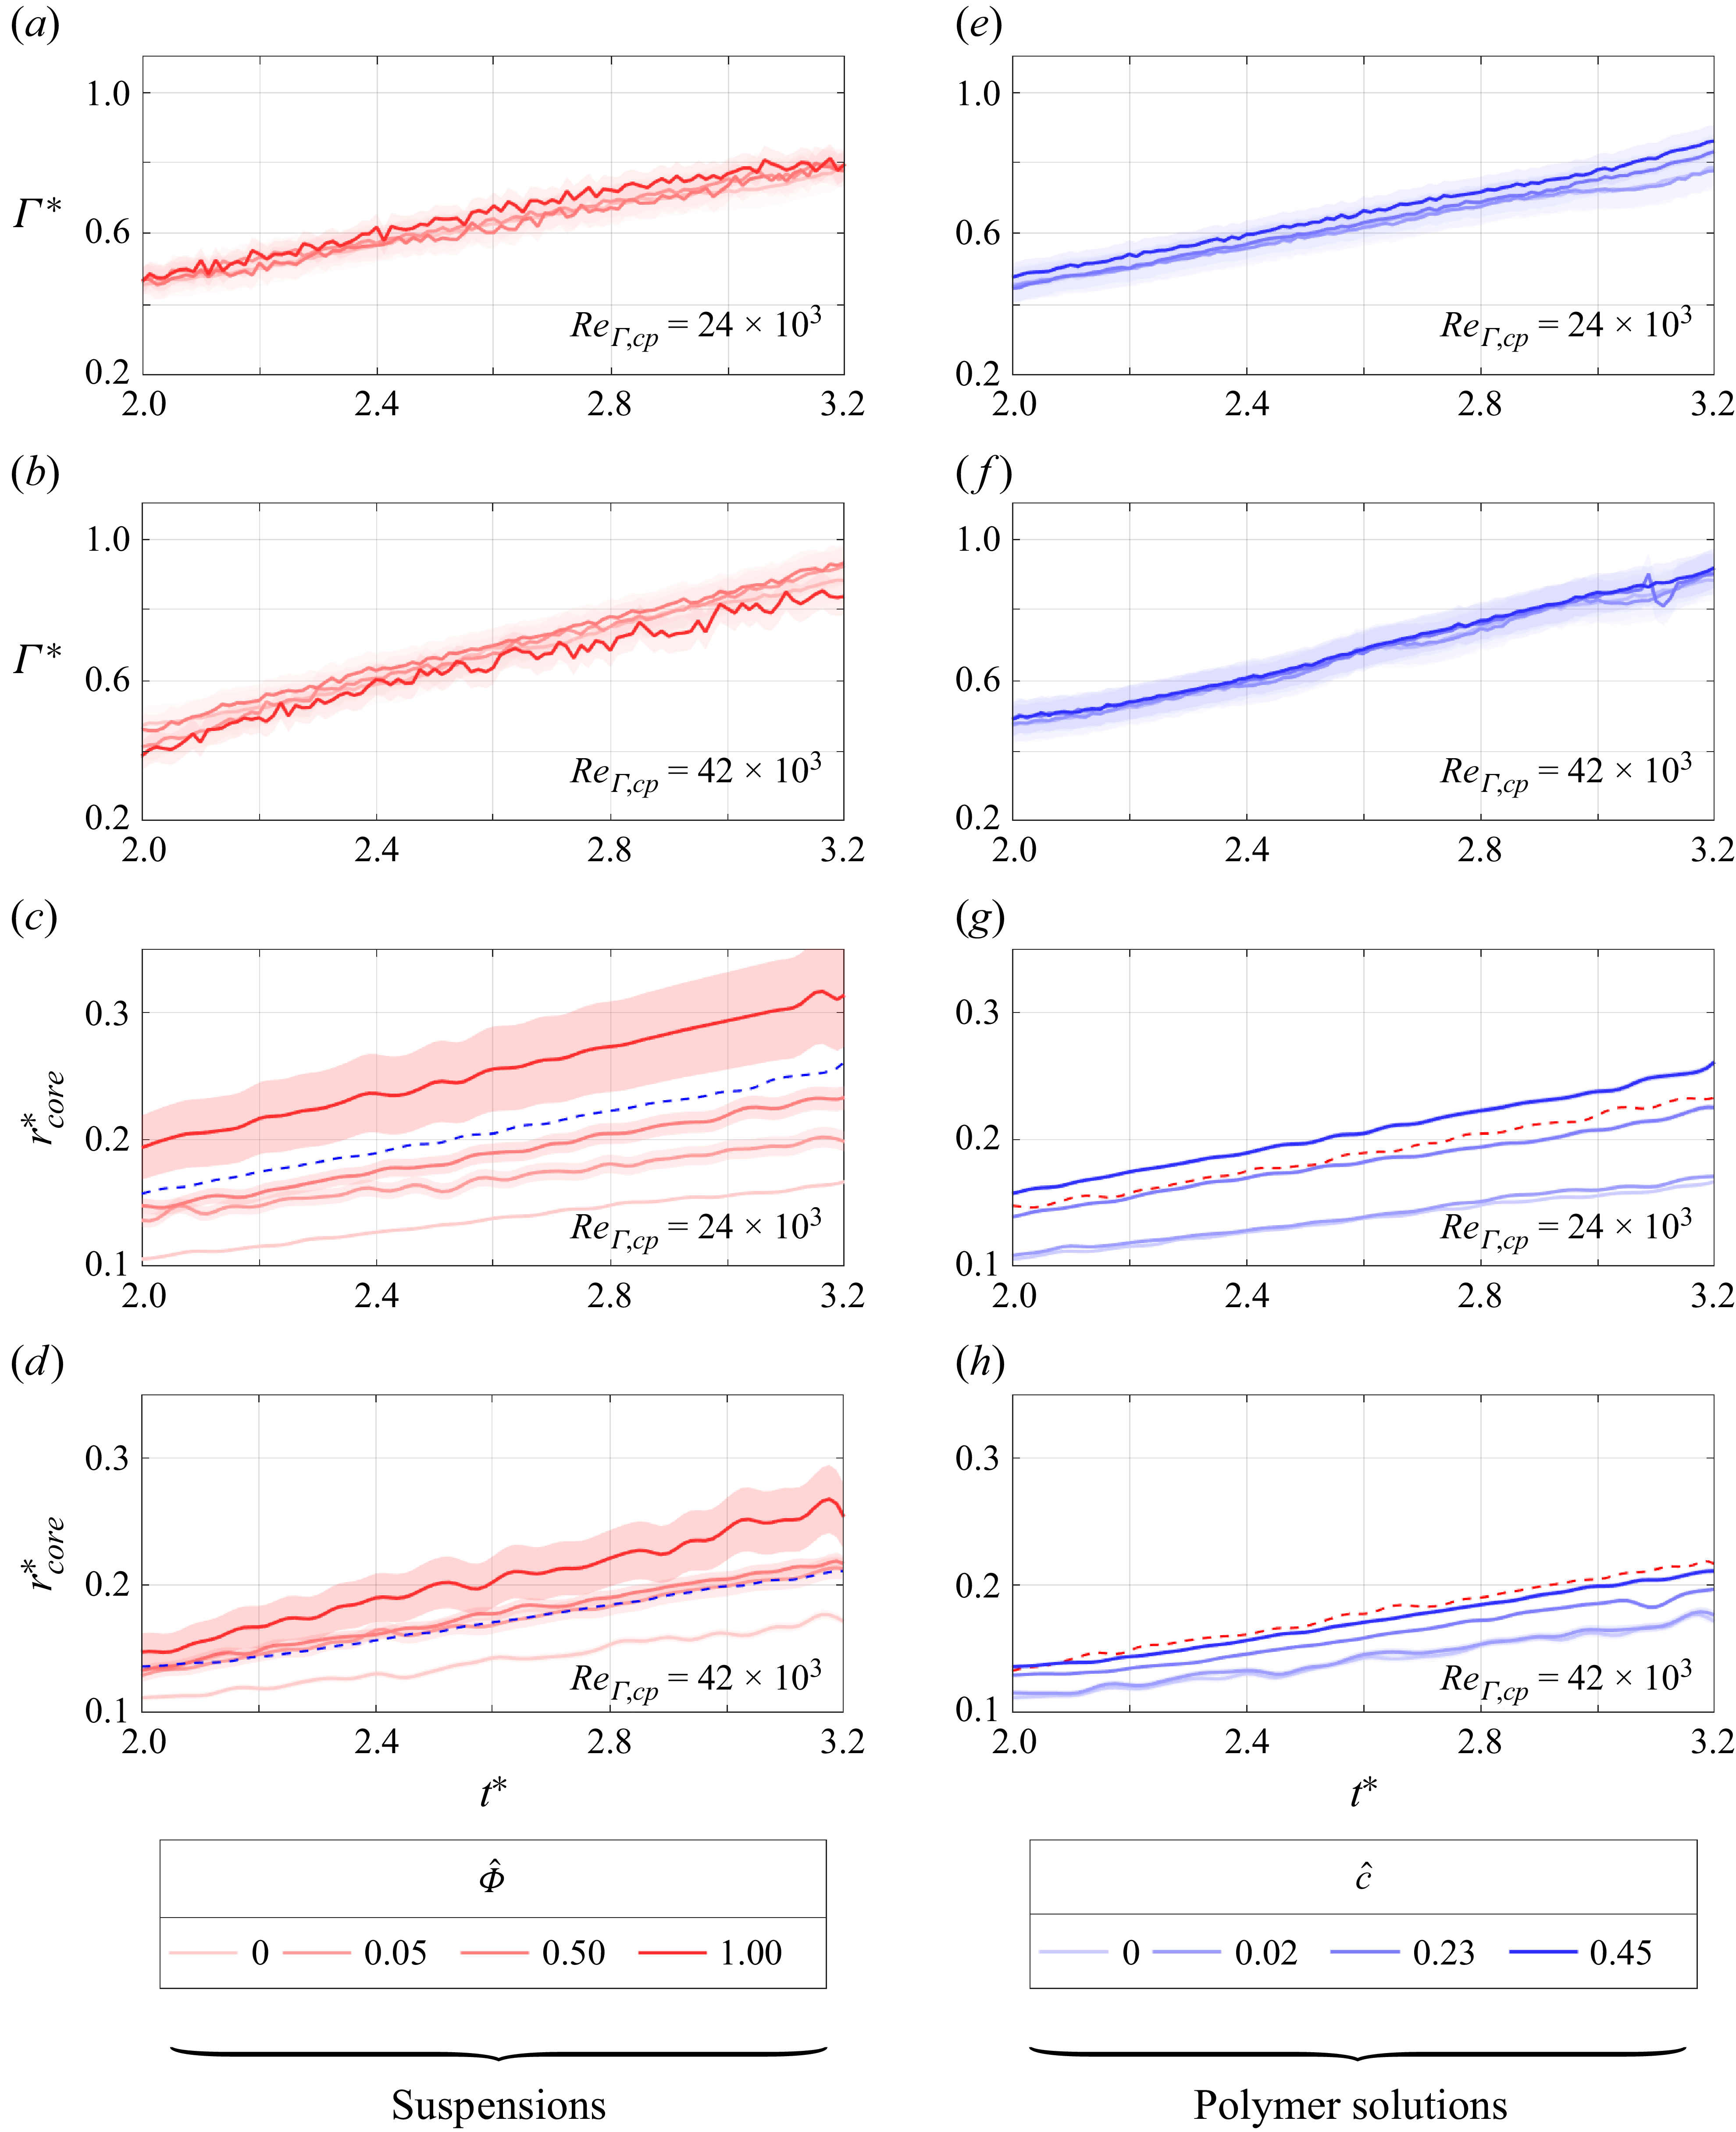
 Γ∗
Γ∗ rcore∗
 Φ^
Φ^ c^
c^ ReΓ,cp
 c^=0.45
 Φ^=0.5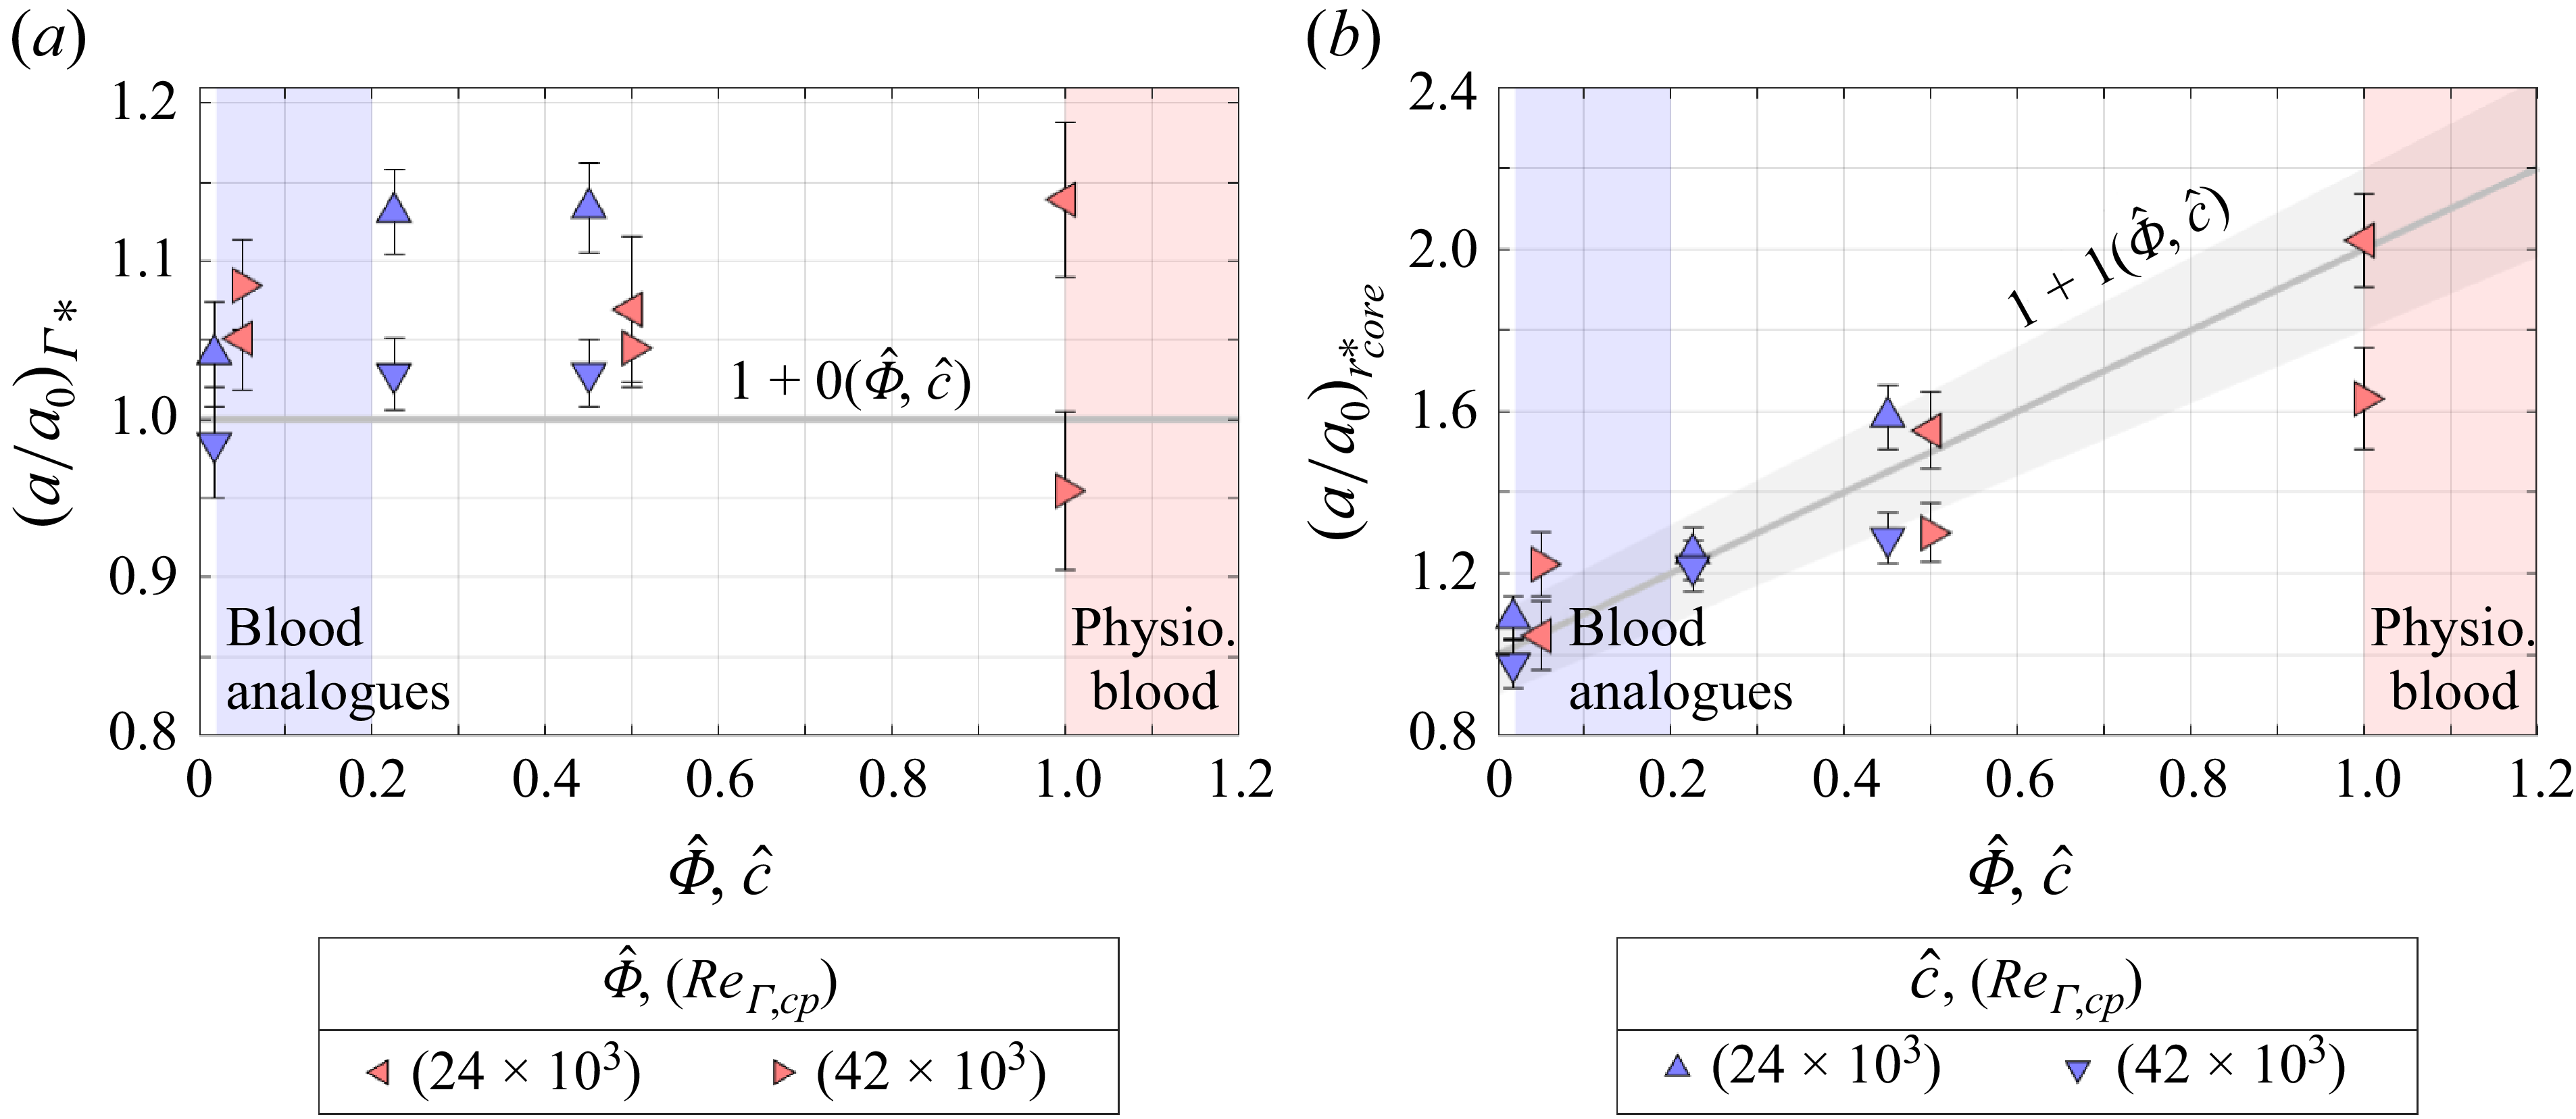
 1+1(Φ^,c^)
 ±
±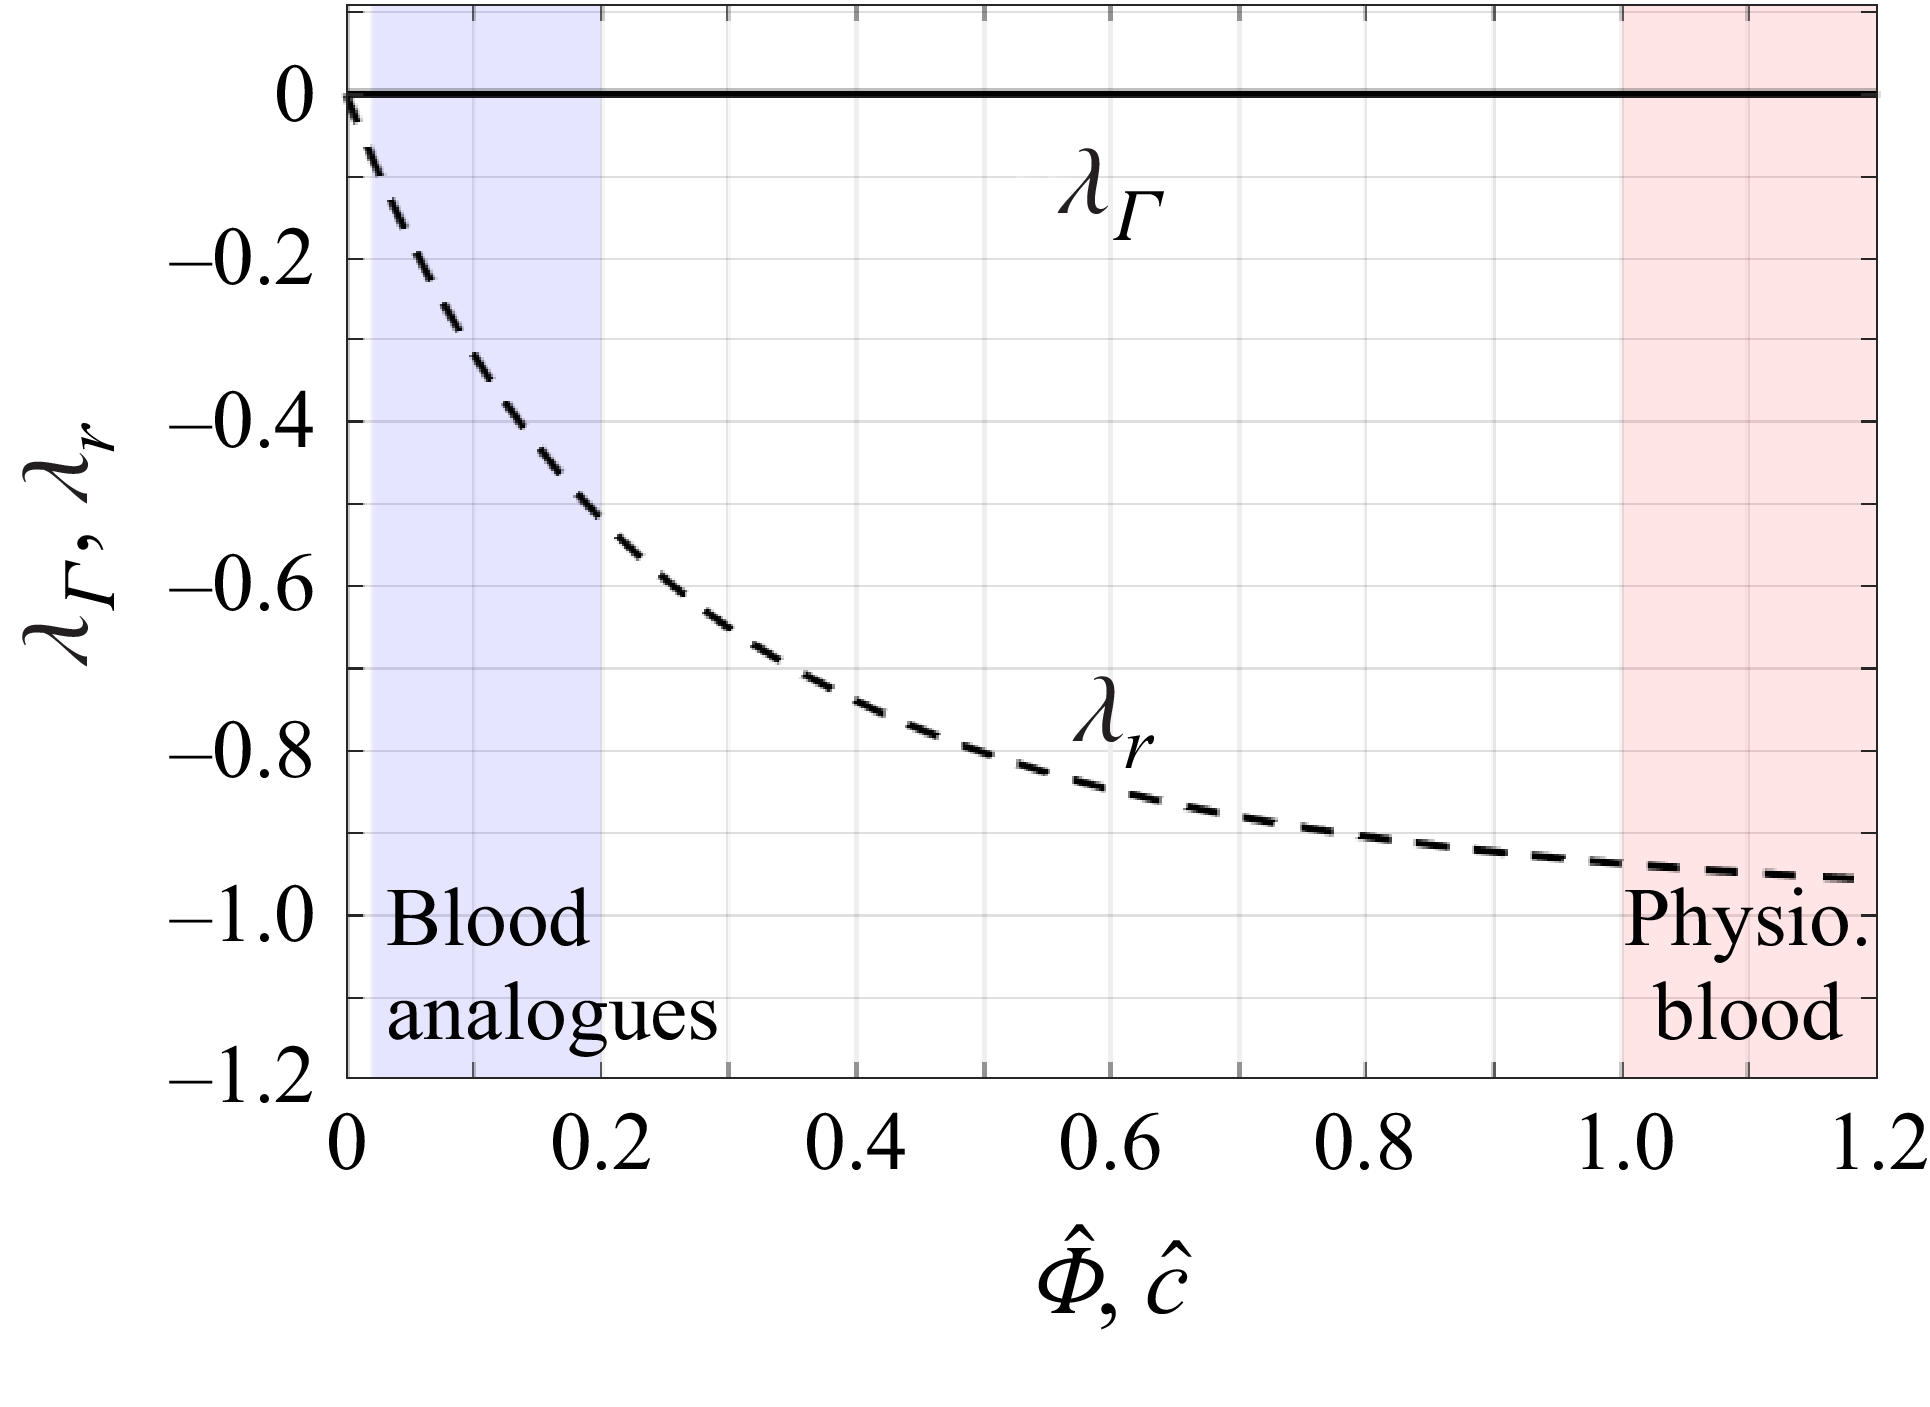
 λΓ
λΓ λr
λr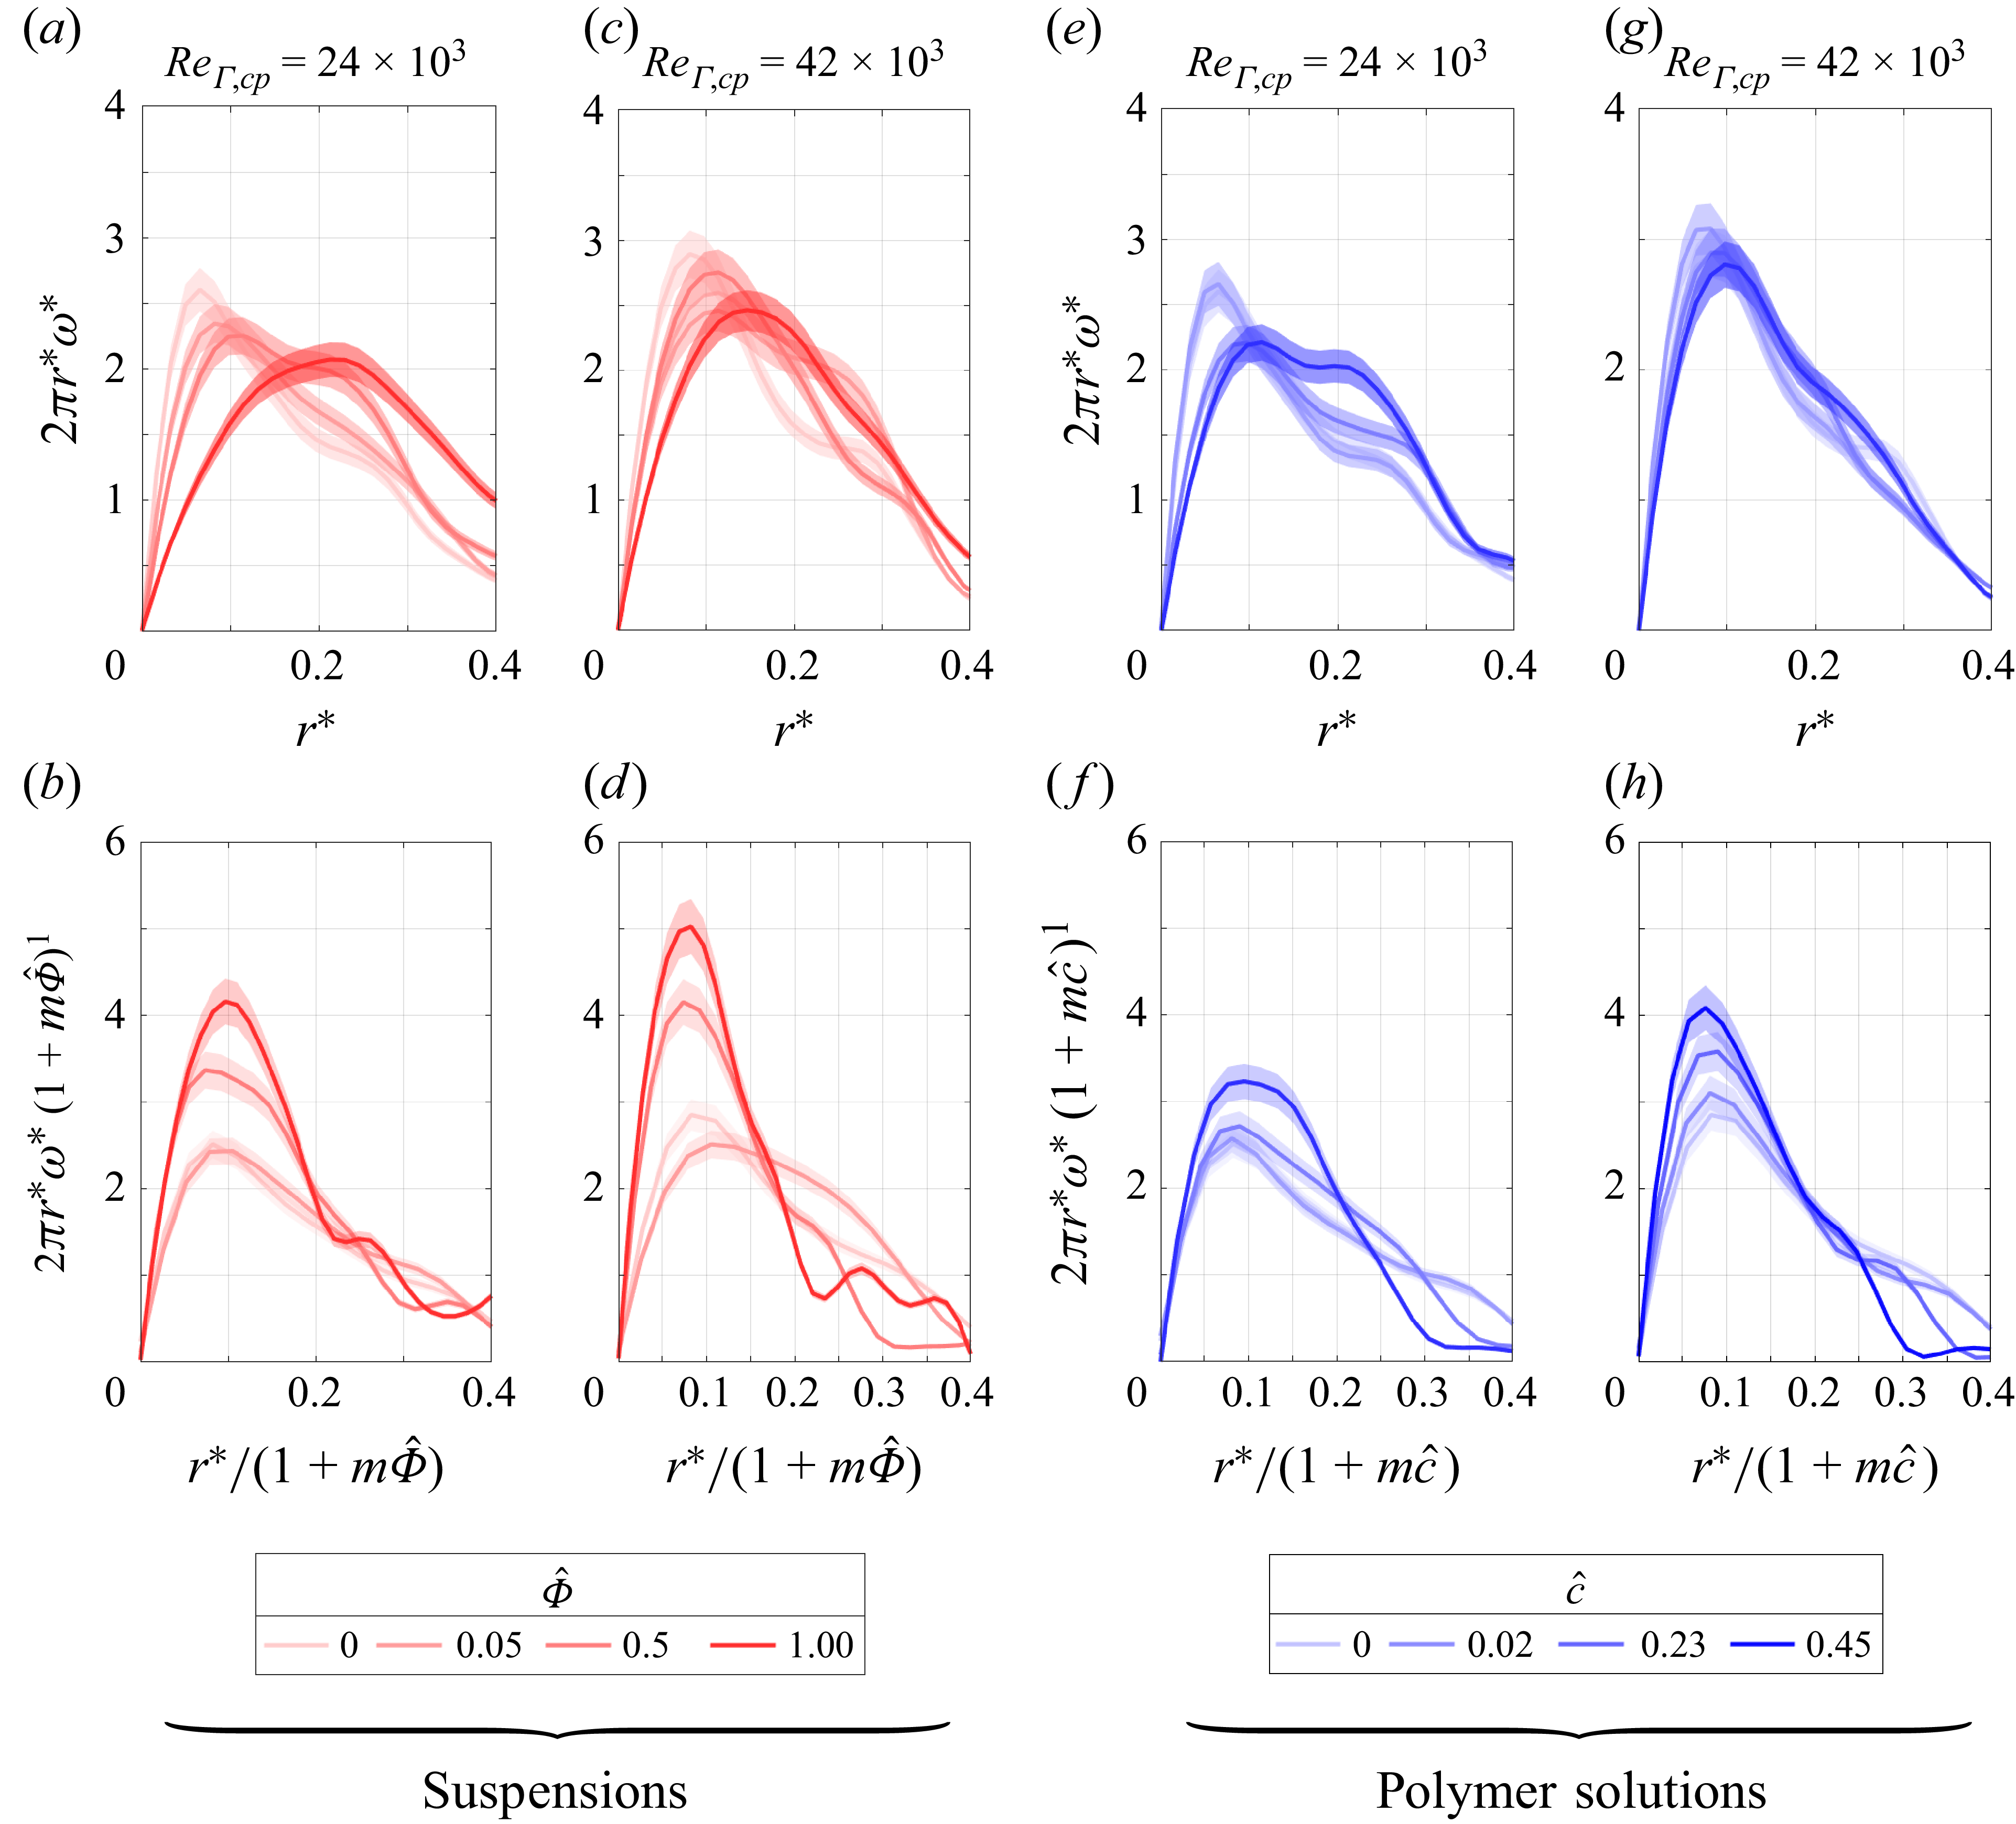
 2πr∗
2πr∗ 1+m(Φ^,c^)
 m=1
m=1 ω∗
ω∗ ω∗
ω∗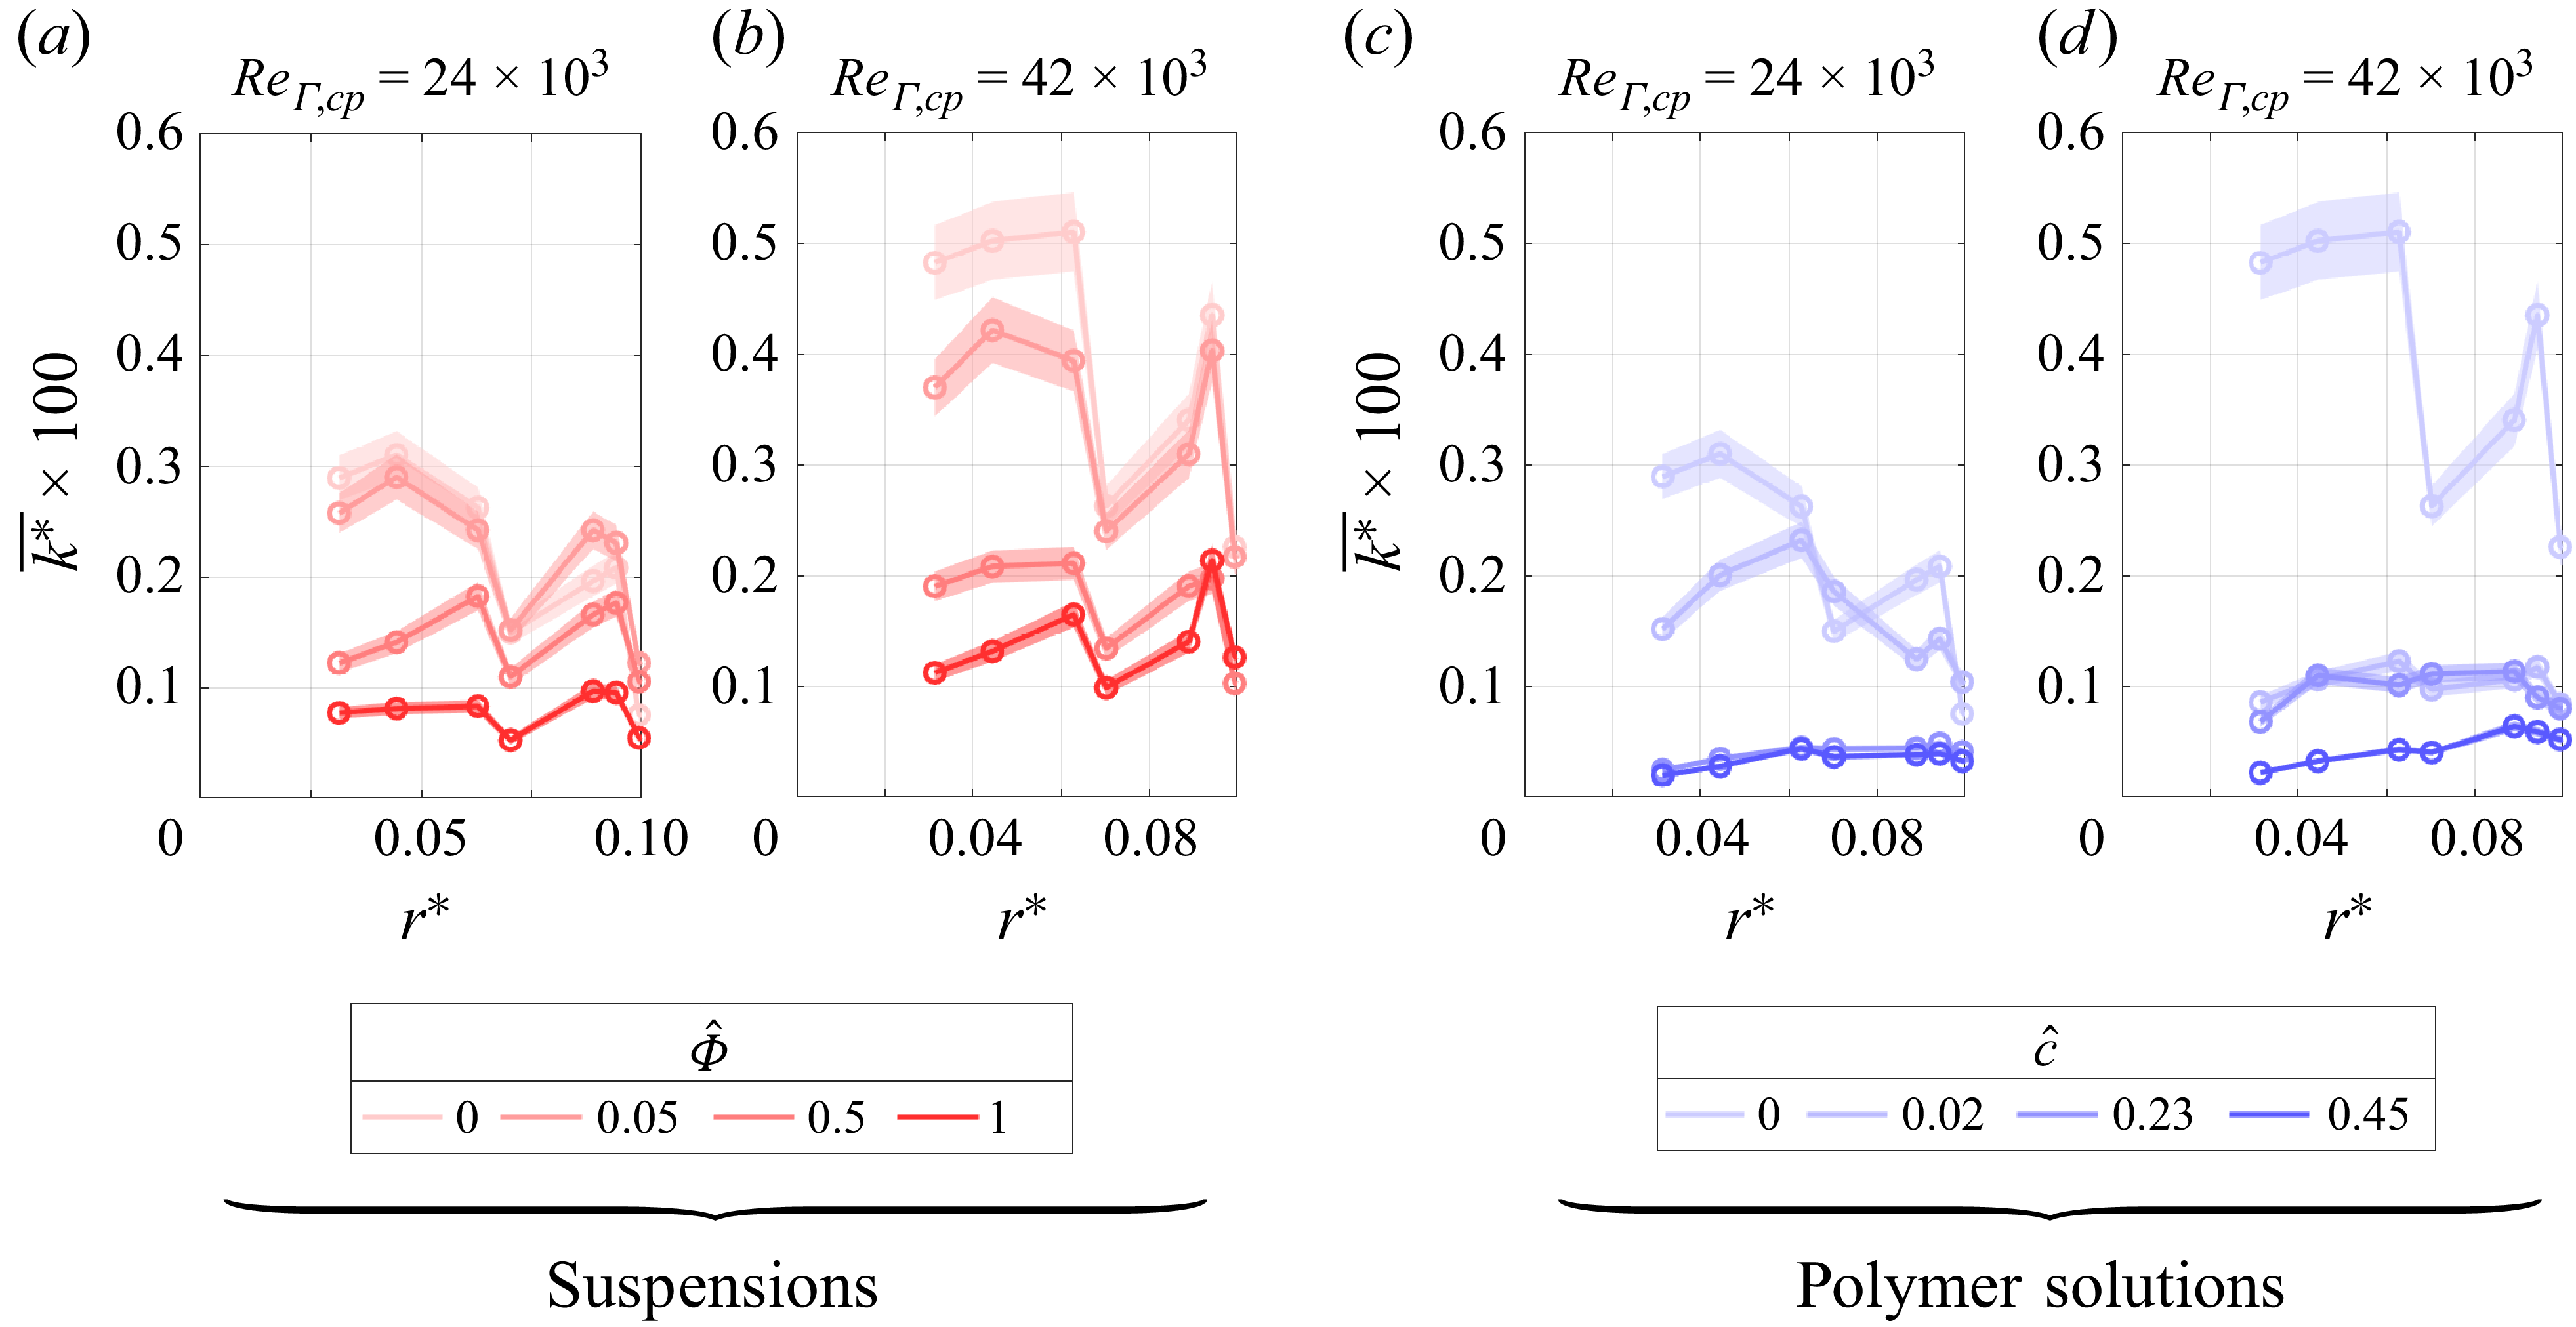
 k∗¯
k∗¯ k∗¯
k∗¯ k∗¯
k∗¯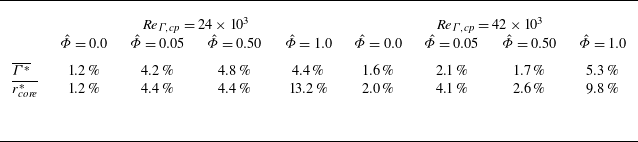
 Γ∗¯
Γ∗¯ rcore∗¯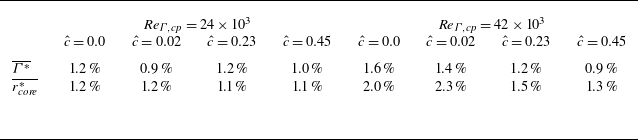
 Γ∗¯
Γ∗¯ rcore∗¯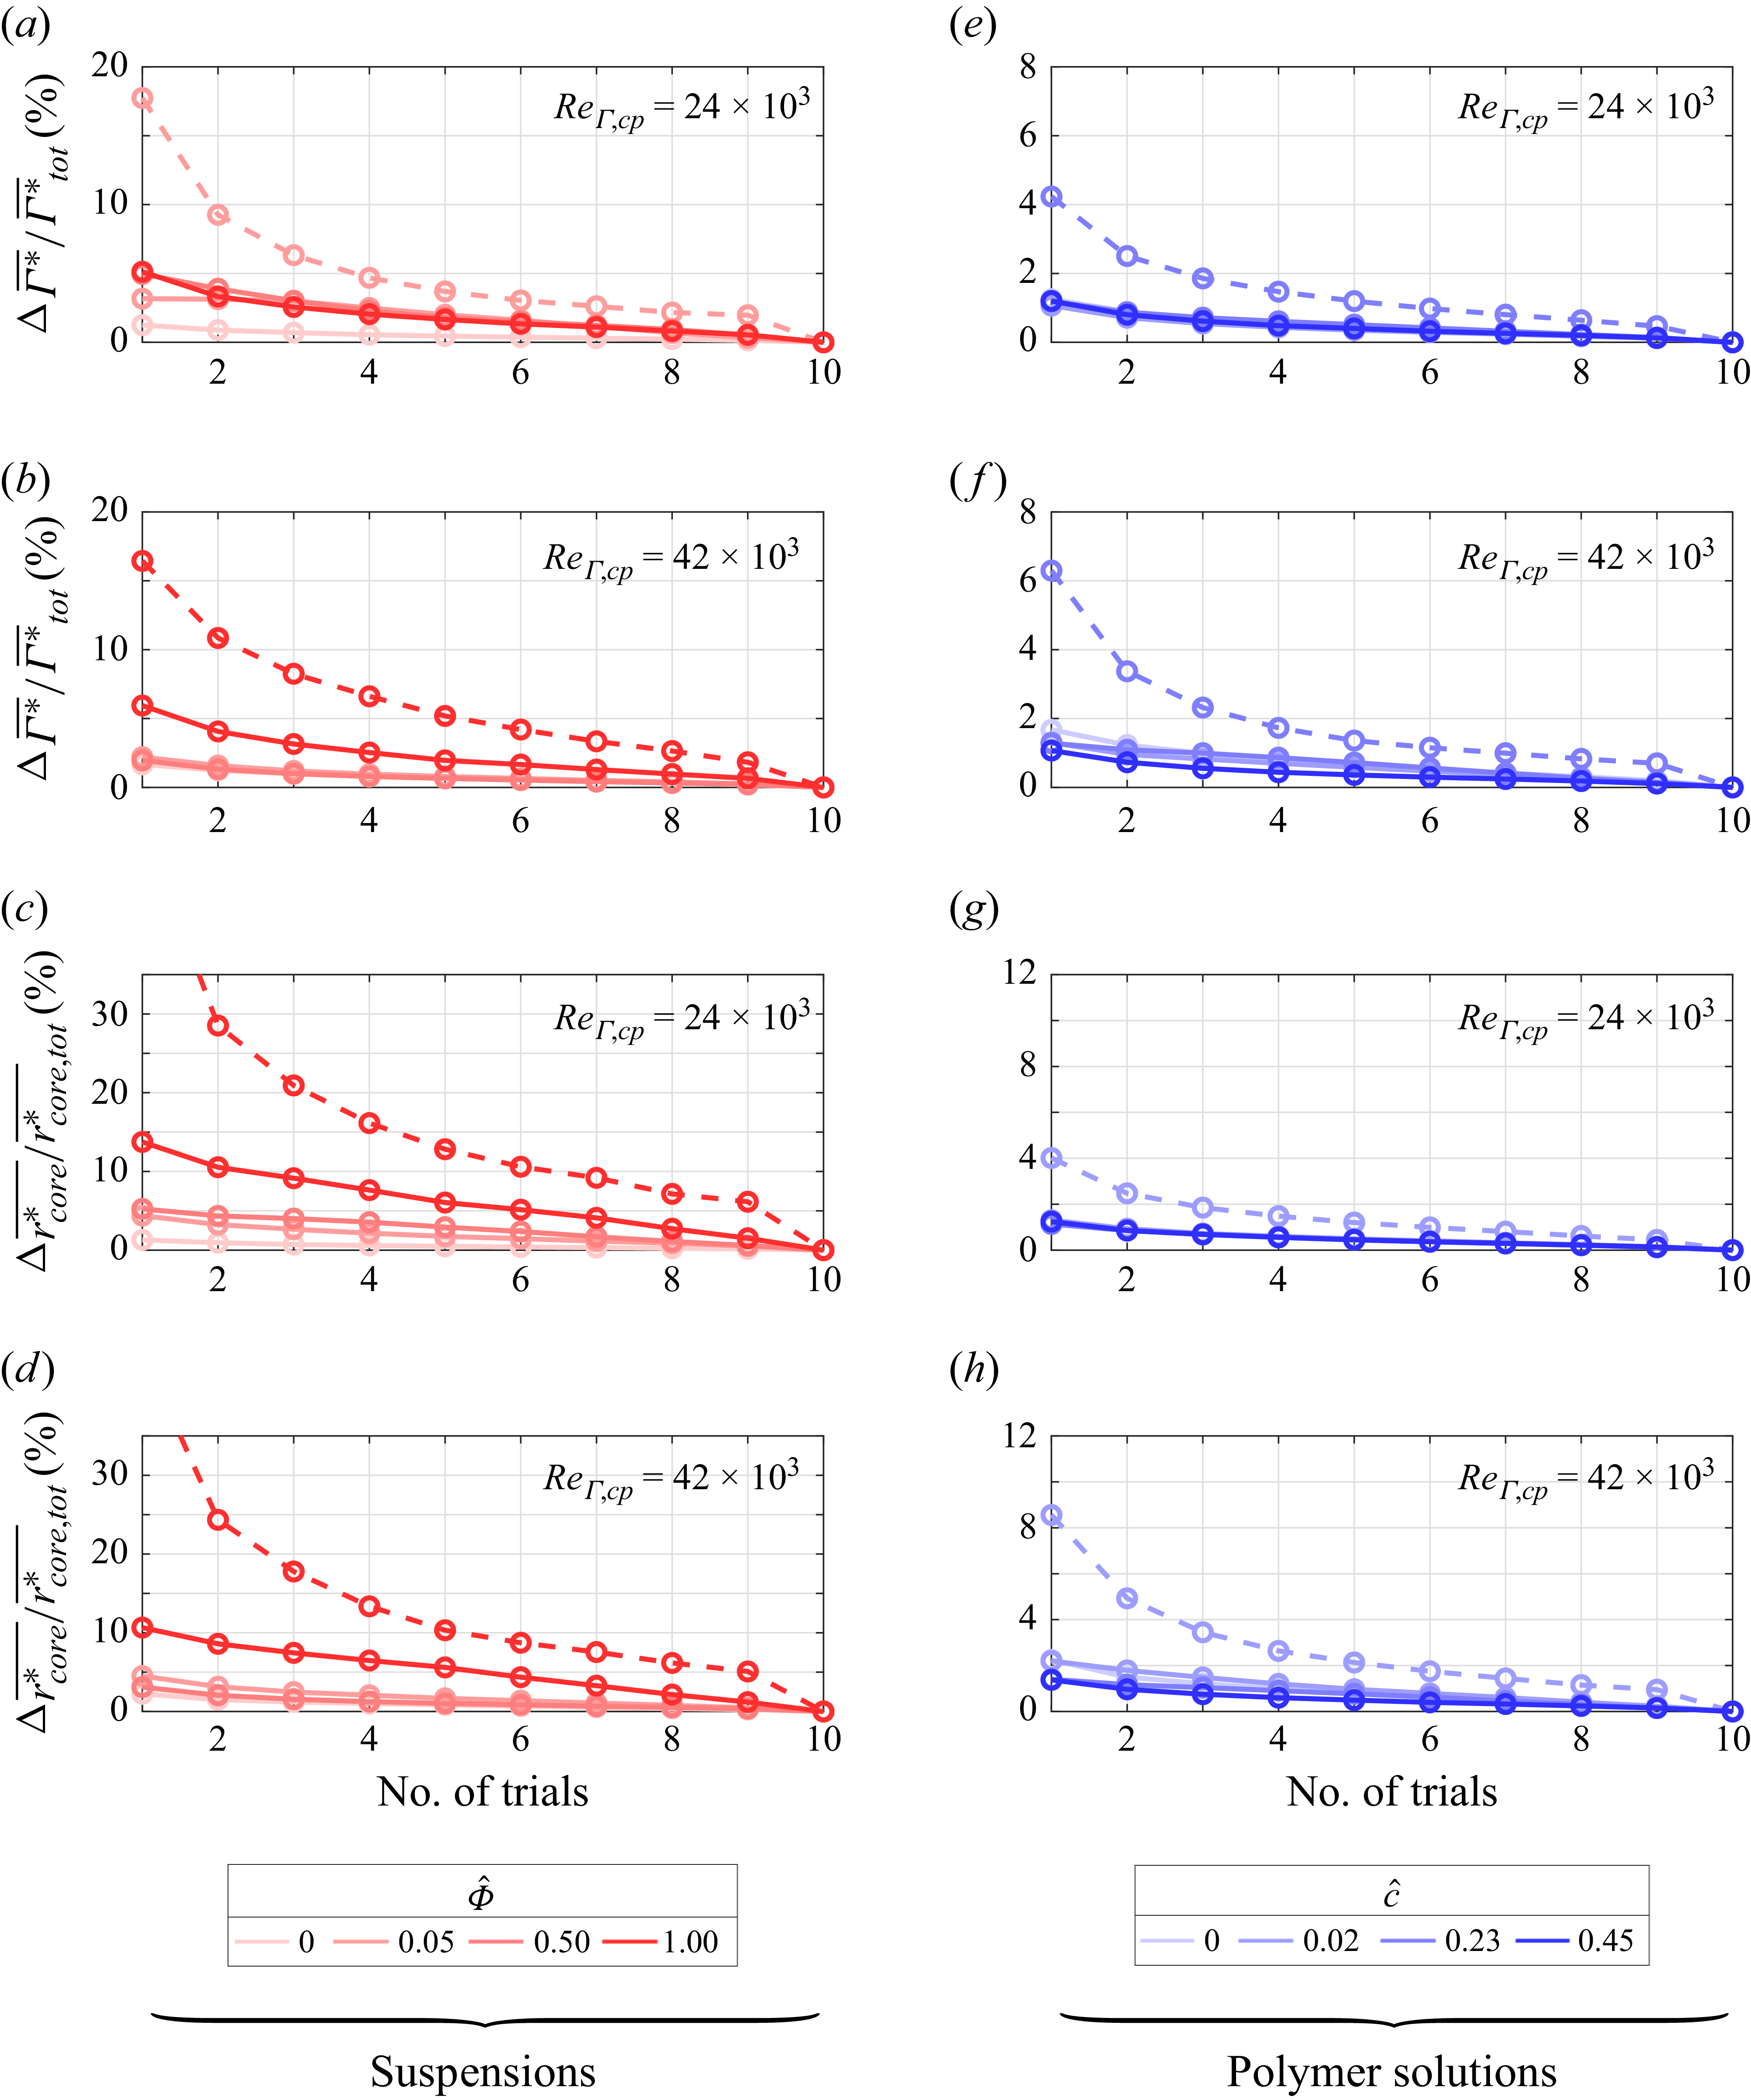
 ΔΓ∗¯/Γ∗¯tot
 Δrcore∗¯/rcore∗¯,tot
 Φ^
Φ^ c^
c^ ReΓ,cp


 Open access

