



The prevalence of obesity is increasing worldwide, and it is now classified as a disease( Reference Upadhyay, Farr and Perakakis 1 ). Obesity is a major public health problem and has clinical implications in increasing the prevalence of comorbid conditions such as hypertension, hyperglycaemia, dyslipidaemia, insulin resistance and inflammation( Reference Finer 2 ). National Health and Morbidity Survey 2015 reported that 5·6 million Malaysian adults aged 18 and above were overweight and 3·3 million were obese( 3 ). According to Tan et al. ( Reference Tan, Dunn and Samad 4 ), the treatment of obesity and its primary comorbidities are estimated to cost the Malaysian health care system approximately US$162 million per year. Therefore, the recent challenge is to develop an effective and sustainable weight loss intervention programme to combat high prevalence of obesity in the Malaysian population.
Previous evidence has illustrated that a moderate weight loss of 5–10 % in body weight( Reference Brown, Buscemi and Milsom 5 , Reference Wing, Lang and Wadden 6 ), particularly in visceral adipose tissue( Reference Goodpaster, Kelley and Wing 7 – Reference Kwon, Kim and Kim 9 ), showed beneficial effects in insulin sensitivity, glycaemic control and CVD risk. However, over the years, strategies to combat obesity remained ineffective, particularly in long-term weight loss programmes( Reference Bombak 10 ). Past studies have investigated interventions based on various dietary patterns by varying the dietary macronutrient composition( Reference Sacks, Bray and Carey 11 , Reference Goss, Goree and Ellis 12 ). Other strategies that have been used to facilitate weight management include reduction in energy density, portion control through meal replacement and improved diet quality( Reference Rolls, Roe and Beach 13 – Reference Davis, Coleman and Kiel 16 ). A key strategy for weight management that can be applied across dietary patterns is to reduce energy density of meals. Clinical trials show that reducing energy density is effective for weight loss and weight loss maintenance( Reference Ello-Martin, Roe and Ledikwe 17 , Reference Ledikwe, Rolls and Smiciklas-Wright 18 ).
A high-protein diet is potentially effective in promoting satiety, reducing energy intake, inducing weight loss and maintaining lean muscle tissue( Reference Clifton 19 , Reference Astrup, Raben and Geiker 20 ). A high-protein diet with 25–30 % of total energy (TE) from protein showed greater reduction in weight and waist circumference (WC) and greater improvement in glycaemic control and cardio-metabolic profile in Asian Indians, Iranian and Australian populations( Reference Gulati, Misra and Tiwari 21 – Reference Farnsworth, Luscombe and Noakes 23 ). A study by Gulati et al. ( Reference Gulati, Misra and Tiwari 21 ) indicated that protein-enriched meal replacement resulted in significant weight loss, improved insulin sensitivity and reduction in inflammatory parameters in overweight and obese Asian Indians. However, it is unknown whether commercial products (meal replacements) lead to a better understanding of portion control of habitual meals beyond the intervention period( Reference Rolls 24 ). Therefore, it is essential to identify an effective food-based dietary strategy which is cost-effective, culturally sensitive and practical under real-life situations for long-term weight control.
General recommendations based on dietary guidelines, for example, recommended nutrient intake or RDA, are often ineffective and end in unsuccessful weight management programmes as there is no one-size-fits-all diet that is more effective than others. A recent review by Koliaki et al. ( Reference Koliaki, Spinos and Spinou 25 ) reported that a dietary regimen to manage obesity should be safe, efficacious, nutritionally adequate, culturally sensitive, cost-effective, adoptable and should ensure long-term maintenance of weight loss. Setting a realistic weight loss goal and following a balanced dietary plan tailored according to an individual’s needs and food preferences are key to facilitating sustainable weight loss and reduction in metabolic risk in obese individuals. Ethnic diversity in Malaysia is unique (Bumiputera – 69·1 %, Chinese – 23 %, Indians – 6·9 % and others – 1 %)( 26 ). According to a recent study, Malaysians of different ethnic background continue to practise traditional meal patterns, habitually( Reference Abdullah, Teo and Foo 27 ). Individualised dietary intervention according to cultural preferences could be more effective in establishing the individual’s adherence to the intervention diet and promote successful and sustainable weight management.
This study is nested in a broader study investigating the association of SNP in fat mass and obesity-associated (FTO) gene with obesity traits and their interaction with dietary factors in Malaysian adults of three different ethnic groups. We found significant interaction between FTO rs9930506 with dietary protein and vitamin E on high-sensitivity C-reactive protein (hsCRP) levels( Reference Mitra, Tan and Amini 28 ). Strong association of FTO gene and obesity-related traits have been consistently observed in studies involving various populations worldwide( Reference Dina, Meyre and Gallina 29 – Reference Ri, Badiu and Cucu 31 ). There is evidence of significant inverse association between dietary vitamin E and hsCRP levels in some populations( Reference Devaraj, Tang and Adams-Huet 32 , Reference Scheurig, Thorand and Fischer 33 ). Therefore, in the present study, we introduced a Hipcref (high-protein, energy-restricted, high-vitamin E and high-fibre) diet to increase percentage energy from protein and included food sources that contributed to ≥15 mg/d of vitamin E for better metabolic outcome.
The aim of this study was to assess the effect of a Hipcref diet (an energy deficit of 1255–2092 kJ/d, 30 % energy from protein, 30 % energy from fat, 40 % energy from carbohydrate, vitamin E ≥15 mg/d and fibre ≥25 g/d) on obesity-related anthropometric and blood biochemical parameters (e.g. fasting glucose, fasting insulin, homoeostatic model assessment-insulin resistance (HOMA-IR), hsCRP and lipid levels), in overweight and obese Malaysian adults, compared with the control diet group. The control diet group received generalised dietary advice on weight loss according to the Malaysian Dietary Guidelines (MDG) 2010 (<6276 kJ/d with a macronutrient composition of approximately 10–15 % energy from protein, 20–30 % energy from fat and 55–70 % energy from carbohydrate). The intervention group received individual diet charts based on their personal preferences, likes/dislikes, traditional customs and meal times. Each individual chart, prescribed, calculated values of energy, macronutrient, vitamin E and fibre intake per d. All participants were responsible for obtaining their own food ingredients and preparing their own meals.
Methods
Ethical approval
This study was conducted according to the guidelines laid down in the Declaration of Helsinki, and all procedures involving human subjects were reviewed and approved by the University of Nottingham in Malaysia Science and Engineering Research Ethics Committee. This study was registered under the Medical Research and Ethics Committee of National Medical Research Registry (Research ID-25110), Ministry of Health Malaysia. Written informed consent was requested and obtained from all willing participants.
Participant selection
This study is nested in a broader study investigating the effect of gene–diet interaction on obesity-related traits. Detailed information on the study design and method has been described in our previous publication( Reference Mitra, Tan and Amini 28 ). Briefly, a total of 178 Malaysian adults (Malaysian Chinese, Malays and Indians) aged 18 years and above were recruited to investigate gene–diet interactions on obesity-related traits. Participants were recruited at random through advertisements and flyers distributed at University of Nottingham Malaysia (UNM) campus, supermarkets and schools in the vicinity of UNM. Interested participants completed a health and lifestyle questionnaire, which included questions on ethnic background, past diseases, family history of past diseases, physical activity level and substance abuse. Smoking status and alcohol consumption were reported as (i) never, (ii) former and (iii) current. Individuals diagnosed with CVD, diabetes, cancer, hypertension, renal diseases, endocrine disorders such as hypothyroidism were excluded. Individuals on medications for cholesterolaemia, hypoglycaemia and psychiatric disorders were excluded. Pregnant and lactating women were also excluded from the study. Interested individuals attended initial screening to determine whether or not the participant met the inclusion and exclusion criteria.
In the present randomised dietary intervention study, only overweight and obese Malaysian adults (Malaysian Chinese, Malays and Indians) aged 18 years and above with a BMI ≥23 kg/m2 were recruited from the parent study. Six waves of recruitment (cohorts) had staggered start dates between March 2015 and October 2017, as illustrated in online Supplementary Fig. S1. A total of 128 participants who met the inclusion criteria were selected to participate in the present intervention study.
Study design
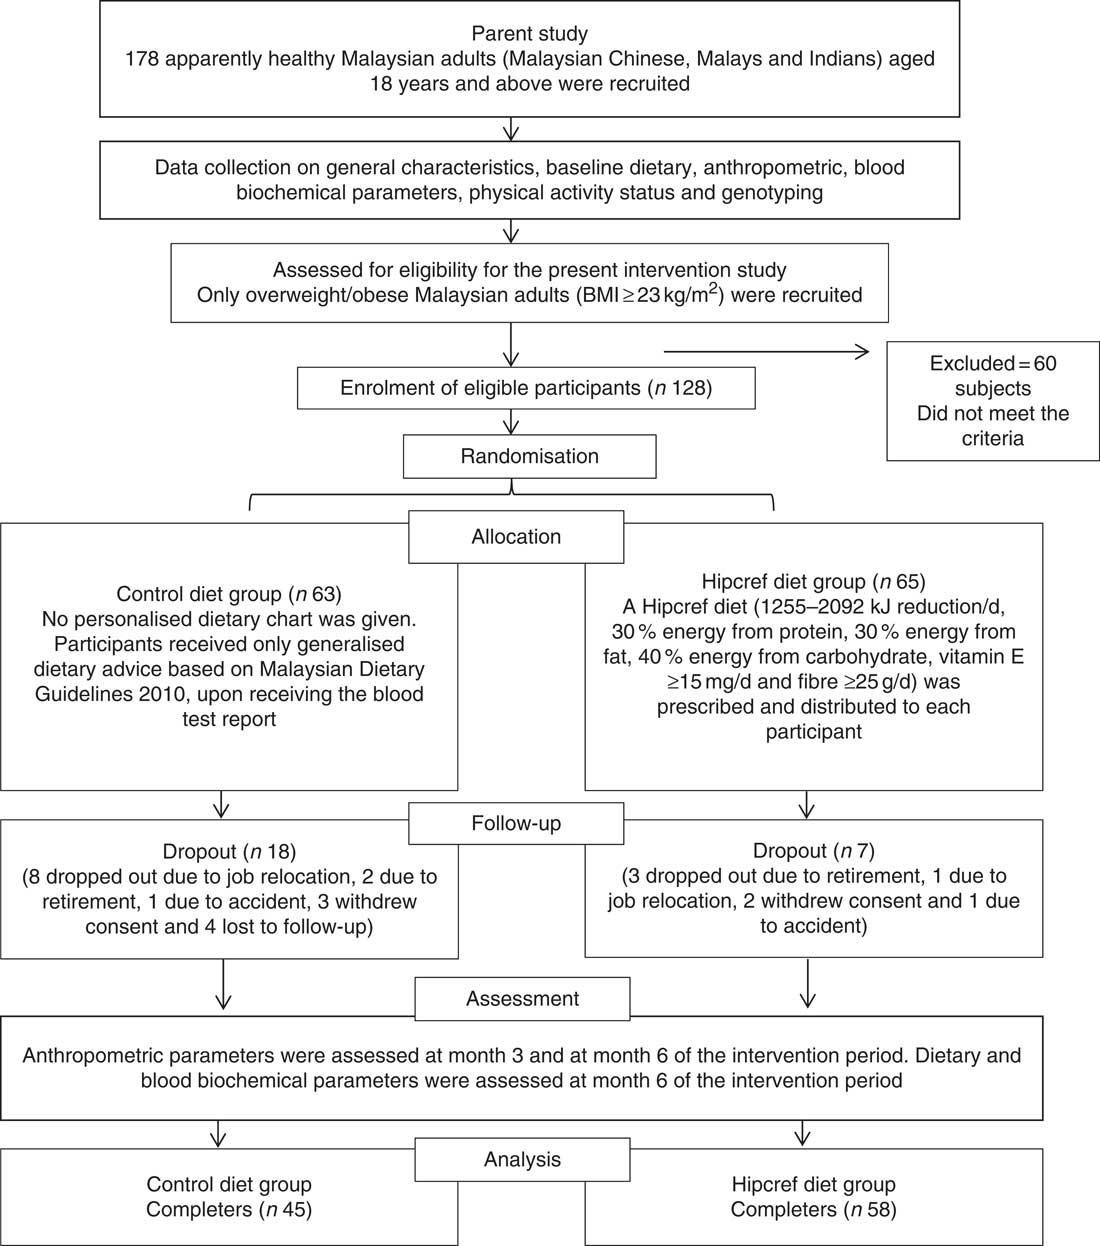
This study was designed as a 6-month randomised, controlled and parallel-arm study to assess the effect of the Hipcref diet on anthropometric and cardio-metabolic parameters in overweight and obese Malaysian adults compared with the control diet group. Participants were categorised into two based on (a) sex (female and male) and (b) by ethnicity (Malaysian Chinese, Malays and Indians), using block randomisation technique. The randomised list was provided to the study team who added eligible participants sequentially to two groups, the intervention group and the control group. Therefore, 128 participants were randomly assigned to one of the two treatments: Hipcref diet group (n 65) or control diet group (n 63).
High-protein, energy-restricted, high vitamin E and fibre diet (intervention diet)
Mode of delivery
At baseline, diet intake was assessed as reported earlier. Attention was paid to details of personal preferences (vegetarian, non-vegetarian), likes/dislikes, food customs and meal times and documented. Based on the baseline energy intake, a reduction of 1255–2092 kJ/d of TE intake (depending on the range of energy intake) was computed. The composition of the macronutrients of the revised diet provided 30 % of energy from protein, 30 % of energy from fat and 40 % energy from carbohydrate. In all, 30 % energy content of protein energy of the revised energy intake was converted to protein intake in g/d. This quantity was then translated to protein-rich food sources. An example menu for a typical day was planned and charted. The food sources that were entered in the menu plan were matched with the individual’s likes, dislikes and personal preferences. Chicken, pork, egg and fish such as salmon, mackerel, sardines, tuna, anchovy, but not red meat, were charted for the non-vegetarian participants. Plant-based foods (including soya bean and products, tofu, chickpea and yellow/red lentils) and dairy products (including low-fat/skimmed milk, low-fat plain yogurt and soft cream cheese) were charted for the vegetarian participants. For instance, (a) in case of non-vegetarian preference, steamed chicken breast, 120 g (approximately 29 g of protein), was advised. Individuals were requested to consume at least three servings of the latter per d. In case of (b) vegetarian preference, steamed tofu, 200 g (approximately 16 g of protein), was advised. Participants were requested to consume at least five to six servings of the latter per d. Dietary counselling was provided to Hipcref participants on examples of prescribed portion sizes with the aid of photographs. The total protein in grams on the prescribed diet charts ranged from 73·1 to 98·5 g (4163–5326 kJ/d; 28–31 % of energy from protein).
A similar approach was taken with respect to fat intake. The fats and oils used to cook meals were recorded in the structured questionnaire for all individuals. The number of family members the food was cooked for was recorded as well. Daily use of cooking oil/butter/margarine was quantified for the participant in the prescribed chart. The quantity of oil/butter/margarine per d prescribed to the individual was multiplied by the number of family members times 30 to arrive at a total quantity of cooking medium per month to be used for the whole family. The participants were advised to adhere to the above quantity of fats and oils and not go beyond the prescribed quantity.
Same approach was taken with respect to formulation of energy from carbohydrate. The computed carbohydrate energy content were converted to carbohydrate intake in g/d. This quantity was then translated to high-fibre, complex carbohydrate-rich foods and entered in the individual diet charts and menu plans.
Prescription of vitamin E ≥15 mg/d and fibre ≥25 g/d
Food sources such as vegetable oil (including sunflower oil, palm oil and rapeseed oil), nuts (including almonds, peanuts, hazelnuts and walnuts), seeds (including sunflower seeds) and green leafy vegetables (including broccoli and spinach) were included into the Hipcref diet to increase participant’s vitamin E intake. Previous studies have reported on a favourable metabolic profile with a high-fibre diet( Reference Jung and Choi 34 , Reference Kabir, Oppert and Vidal 35 ). Therefore, we included fibre intake of ≥25 g/d in the prescribed diet chart as per MDG 2010( 36 ). We included leafy green vegetables (broccoli, spinach, carrots, etc.), legumes (chickpeas, peas, lentils, etc.), fruits (apple, pear, guava, etc.), muesli, whole grain cereals and oat products to increase soluble and non-soluble dietary fibre to the Hipcref diet.
The entire consultation programme was revised and modified once a month throughout the intervention period to maximise participant adherence to the programme and to minimise monotony. Participants were responsible for obtaining their own food ingredients and preparing their own meals, following the guidelines laid down in the prescribed chart. The meal times on the prescribed chart did not deviate from the baseline diet survey of each individual. Healthier recipe options were listed in the prescribed chart (online Supplementary Table S1) given to each individual on the Hipcref diet. Participants were advised to choose healthier meal preparation techniques, such as steaming, boiling, grilling and baking. Consumption of raw salad was advised. When dining out, individuals were advised to avoid sambal (chilli and palm sugar paste in oil), oily gravy, etc. to reduce TE intake.
Control diet
Mode of delivery
Participants allocated to the control diet group (n 63) did not receive an individualised prescribed diet chart. Generalised dietary advice on weight loss was provided to them based on the MDG 2010( 36 ). MDG 2010 consists of a food pyramid to promote healthy eating and active lifestyle among the Malaysian population. Control diet participants were advised to reduce their TE intake and consume no more than 6276 kJ of energy per d (the energy intake recommended for sedentary activity)( 36 ). This quantity of TE intake per d was translated to food-based dietary counselling as follows: four servings of cereals and grains (30 g of carbohydrate per serving), two servings of fruits, three servings of vegetables, one serving of fish (14 g of protein per serving), 1/2 serving of meat/poultry (14 g of protein per serving), 1/2 serving of legumes (7 g of protein per serving) and one serving of milk and dairy products (7 g of protein per serving) per d( 36 ). Participants were also advised to consume low-fat food and less sugar and salt in general( 36 ). These food portions provided approximately 10–15 % energy from protein, 20–30 % energy from fat and 55–70 % energy from carbohydrate( 36 ). Participants were responsible for obtaining their own food ingredients and preparing their own meals.
All participants were registered on WhatsApp and Facebook to convey necessary messages to them from the research team at the shortest possible time. The majority of the study participants were categorised as physically inactive at baseline (90·8–98·4 %; Table 3). All participants were asked to maintain their usual levels of physical activity and to refrain from drinking and smoking during the intervention period. Throughout the 6-month intervention period, monthly meetings took place at UNM or at a designated venue to monitor the changes in body composition and provide dietary counselling.
Measurement of anthropometric parameters
Measurements of anthropometric parameters were taken at baseline, month 3 and month 6 of the intervention period. Height of the individual (barefoot) was measured with a standard height rod. Body composition including weight, fat mass (kg), skeletal muscle mass (kg), fat-free mass (kg) and percentage body fat (%) were measured using a body composition analyser DSM-BIA InBody 230 (InBody Co., Ltd.). BMI was arrived at using the formula, weight in kg divided by the height in metre square (kg/m2). Overweight and obesity was defined as BMI 23–27·4 kg/m2 and BMI ≥27·5 kg/m2, respectively( 37 ). WC was measured at the midpoint between lower margin of palpable rib and the top of iliac crest. Hip circumference was measured at the widest portion of the buttocks( 38 ). Waist:hip ratio (WHR) was calculated using the ratio of the circumference of the waist to the hip. Systolic and diastolic blood pressure was measured using a digital blood pressure monitor, following the recommendation from American Heart Association (AHA)( Reference Pickering, Hall and Appel 39 ).
Dietary assessment
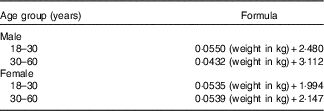
Dietary data were collected and assessed at baseline and month 6 of the intervention period. Energy, macro- and micronutrient intake were assessed by an interviewer-administered validated FFQ. Twenty-four hour recalls were conducted on all participants to capture and include food items habitually consumed on weekdays and weekends( 40 ). Food items included in the validated FFQ( Reference Loy, Marhazlina and Nor Azwany 41 ) were then modified to include items popular to all three ethnic groups collected from the 24 h recalls. This FFQ consisted of 156 food items which were listed according to twelve categories (grain, meat and poultry, fish and seafood, egg and eggs products, legumes, milk and milk products, vegetables, fruits, drinks, confectionary, bread spread and flavourings). Detailed information related to the brands of purchased food items, methods of cooking, fat and oil consumption and supplementation intake were included to capture macro- and micronutrient intake as accurately as possible. For each item, participants indicated the frequency of consumption for the past week (never, once a week, 2–4 times a week, 5–6 times a week, once per d, 2–3 times/d, 4–5 times/d). The number of standard portions consumed per sitting was recorded with the aid of photographs of standard portion sizes( Reference Suzana 42 ). Total daily intake of macro- and micronutrients was calculated by multiplying the energy and nutrient content of unit portion of each food item by the number of portions consumed per sitting, times a factor representing the frequency of consumption for the past week and finally summed across all food items to give an estimate of the total daily energy, macro- and micronutrient intake per day. The per day consumption data were entered into an energy and nutrient assessment software, Dietplan7 (Forestfield Software Ltd) to compute energy, macro- and micronutrient intake. All food items not found in the Dietplan7 database were keyed in from ‘Nutrient Composition of Malaysian Foods’( Reference Tee 43 ). The intake of macronutrients including SFA, MUFA, PUFA and trans-fatty acids (TFA) were expressed as a percentage of TE consumed. TE:BMR ratio <1·2 was used to identify under-reporters of energy intake( Reference Goldberg, Black and Jebb 44 ). In the present study, none of the participants was found to be under-reporting. Therefore, all participants were included for data analysis. BMR for adult Malaysians was predicted from the equations based on age group, sex and body weight (kg)( Reference Ismail, Chee and Roslee 45 ) (Table 1).
Predictive formulae for the estimation of BMR of Malaysian adults according to age, sex and body weight
Physical activity
Physical activity data were collected through an interviewer-administered structured questionnaire at baseline and month 6 of the intervention period. The questionnaire included a list of physical activities with corresponding metabolic equivalent (MET) values( Reference Ainsworth, Haskell and Whitt 46 ). Details of activities asked included (1) the type and intensity of the activity (e.g. jogging, brisk walking, running etc.); (2) the time and duration (min) of each activity performed per d and (3) the number of days each activity was performed in a week. The reported physical activity was then categorised into light, moderate and vigorous intensity physical activity which was defined as <3 MET, 3–6 MET and >6 MET, respectively, according to Ainsworth et al. ( Reference Ainsworth, Haskell and Whitt 46 ). The total time (min) spent on sedentary, moderate and vigorous intensity physical activity in a week was computed for each participant. According to the Ministry of Health Malaysia, individuals who accumulate at least 150 min/week of moderate intensity physical activity or 60 min/week of vigorous intensity physical activity are considered as physically active, else they are considered as physically inactive( 36 ). Accordingly, participants of the present study were then categorised into two groups for statistical analysis: physically active and physically inactive.
Blood collection and biochemical analysis
Fasting blood samples were collected from each participant early in the morning between 07.00 and 10.00 hours, following an overnight fast, at baseline and month 6 of the intervention period. Fasting venous blood was drawn by an experienced phlebotomist from the antecubital vein into vacutainer tubes containing fluoride oxalate for plasma glucose analysis and vacutainer tube with clot activator and gel for serum separation (Becton Dickinson) for serum lipids (including total cholesterol, TAG and HDL-cholesterol), serum insulin and hsCRP analyses. All the aforementioned biochemical analyses were assessed using Abbott Architect CI8200 Automatic System according to manufacturer’s instructions. HOMA-IR was calculated as the product of fasting plasma glucose (mmol/l) and fasting serum insulin (µU/ml) divided by 22·5 according to homoeostatic model assessment( Reference Wallace, Levy and Matthews 47 ). LDL-cholesterol was calculated from values of total cholesterol, HDL-cholesterol and TAG using the Friedewald formula: LDL-cholesterol=total cholesterol–((TAG/5)+ HDL-cholesterol)( Reference Friedewald, Levy and Fredrickson 48 ).
Measure of dietary adherence
Dietary adherence was assessed as the difference between participant’s respective macronutrient goal as per the assigned diet and their reported dietary intake at the end of the 6-month intervention period. For participants assigned to the intervention diet group, dietary adherence was calculated as the difference between the reported and recommended distribution of percentage energy from protein:fat:carbohydrate, which was 30:30:40, using the ‘Mahalanobis distance equation’( Reference Alhassan, Kim and Bersamin 49 ). The equation used to calculate distance from the recommended goal was
 $$\sqrt {{{\left( {\left( {X_{{{\rm PRO}}} {\minus}30} \right)^{2} {\plus}\left( {X_{{{\rm FAT}}} {\minus}30} \right)^{2} {\plus}\left( {X_{{{\rm CHO}}} {\minus}40} \right)^{2} } \right)} \over 3}} $$
where X PRO, X FAT and X CHO were defined as participant’s reported percentage energy from protein, fat and carbohydrate, respectively. For participants assigned to the control diet group, dietary adherence was calculated as the difference between the reported and recommended distribution of percentage energy from protein:fat:carbohydrate, which was 15:30:55.
 $$\sqrt {{{\left( {\left( {X_{{{\rm PRO}}} {\minus}15} \right)^{2} {\plus}\left( {X_{{{\rm FAT}}} {\minus}30} \right)^{2} {\plus}\left( {X_{{{\rm CHO}}} {\minus}55} \right)^{2} } \right)} \over 3}} $$
The adherence score measured a degree of deviation from the recommended macronutrient goal. Thus, a lower score indicated better adherence and a higher score indicated poorer adherence.
Power and sample size calculation
Sample size was computed using the formula n=(2sd 2(Z 1–α2+Z 1–β )2)/d 2, according to Charan & Biswas( Reference Charan and Biswas 50 ). The primary outcome measure is ‘change in body weight’. Assuming an expectation of 10 % reduction in body weight post-intervention, an effect size (d) of 7·6 (76–68·4=7·6 kg; with an sd of 11·2( Reference Ambak, Mohamad Nor and Puteh 51 )) was calculated. To detect this difference with a significance level of 95 % (1–α2=1·96) and power of 80 % (1–β=0·84), thirty-four participants were required in each arm of the study. Assuming an attrition rate of 20 %, forty-one participants were required in each arm of the study. Thus, the computed sample size is 82.
Data analysis
Statistical analysis was performed using the statistical package for social sciences (IBM SPSS statistic, version 22). Data were expressed as means with their standard errors or number (percentage). Log transformation was performed to transform non-normally distributed data into normally distributed data. The current study was designed to test an approach applicable to primary care and hence the analysis was conducted on an intention-to-treat (ITT) basis rather than on compliance to treatment (per protocol). The latest data on anthropometric, blood biochemical and dietary parameters from all participants (completers and non-completers) was computed for statistical analysis. The independent t test and χ 2 test were performed to assess the differences between the Hipcref diet group and control diet group at baseline on continuous variables and categorical variables, respectively.
A two-way mixed ANOVA was performed to assess the effect of treatment group×time in anthropometric parameters at baseline, month 3 and month 6 between the Hipcref diet group and control diet group on an ‘ITT’ basis. Adjustment for covariates such as age, sex, physical activity status, smoking status and alcohol consumption was applied. With a significant F test, post hoc pairwise comparison was performed to assess the differences within the treatment groups at different time points. A two-way mixed ANOVA was performed to assess the changes in blood biochemical and dietary parameters at baseline and at month 6 between the Hipcref diet group and control diet group. Adjustment for covariates such as age, sex, physical activity status, smoking status and alcohol consumption was applied. A statistical probability level of P<0·05 (two-sided) was considered significant.
Results
A total of 128 participants (84 % women) completed the baseline assessment. They were randomly assigned to the Hipcref diet group (n 65; female=54 and male=11) or the control diet group (n 63; female=54 and male=9). Of the initial 128 participants, seven participants dropped out from the Hipcref diet group and eighteen participants dropped out from the control diet group due to job relocation (n 9), retirement (n 5), accident (n 2), volunteer withdrawal of consent (n 5) and four were lost to follow up (Fig. 1). Therefore, the study was completed with 103 participants: Hipcref diet group=58 participants (female=47 and male=11); control diet group=45 participants (female=41 and male=4). There was no significant difference in the general characteristics between the completers and dropouts in the Hipcref diet group (Table 2). However, we found that dropouts in the control diet group had significantly lower age (P=0·017), higher body weight (P=0·001), higher BMI (P=0·003) and comprised of higher number of smokers compared with the completers.
Flow chart of the intervention study: enrolment, random allocation, follow-up, withdrawal and assessment of the study participants. Hipcref, high-protein, energy-restricted, high vitamin E and fibre.
Differences in the general characteristics between the completers and dropouts in the high-protein, energy-restricted, high-vitamin E and -fibre (Hipcref) diet group and control diet group (Numbers and percentages; mean values with their standard errors)
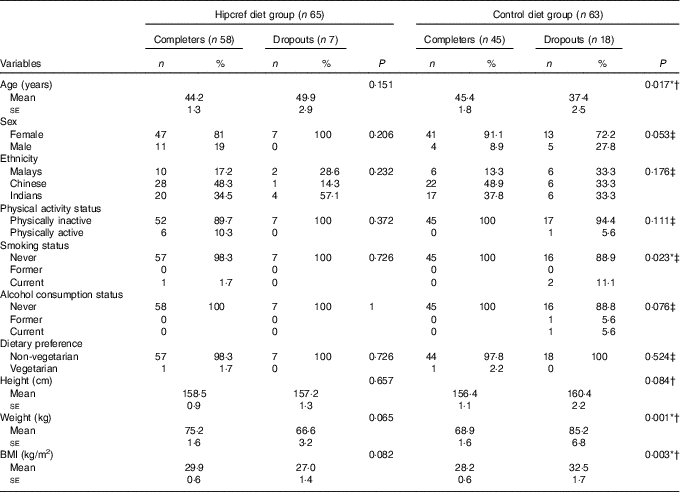
* P<0·05 was considered as significant.
† P value based on the independent t test.
‡ P value based on the χ 2 test.
The statistical analysis on the comparisons of the general characteristics between the Hipcref diet group and control diet group was conducted on an ITT basis (Table 3). The sex distribution was not significantly different in both the Hipcref diet group and control diet group, females (83 v. 86 %) and males (17 v. 14 %) (P=0·681). The mean age (years) in the two arms of the study did not differ statistically (Hipcref diet group: 44·8 (se 1·3) years and control diet group: 43·1 (se 1·5) years; P=0·266). There was no significant difference in the distribution of the three ethnic groups in the two arms of the study (P=0·996). No difference in physical activity status (P=0·057), smoking status (P=0·219) and alcohol consumption status (P=0·351) as well. No significant difference was found in height (P=0·480), body weight (P=0·530) and BMI (P=0·757) between the two groups. No significant difference was found in the frequency of non-vegetarians and vegetarians between the Hipcref diet group (98·5 and 1·5 %, respectively) and control diet group (98·4 and 1·6 %, respectively) (P=0·982).
General characteristics between the high-protein, energy-restricted, high-vitamin E and -fibre (Hipcref) diet group and control diet group on an intention-to-treat analysis (Numbers and percentages; mean values with their standard errors)
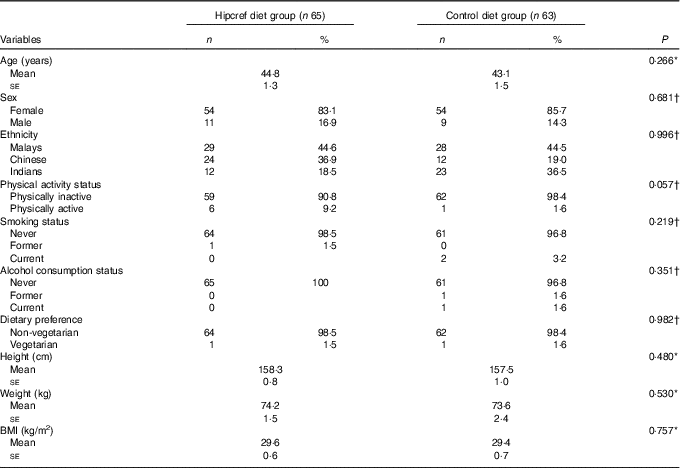
* P value based on the independent t test.
† P value based on the χ 2 test.
Anthropometric parameters at baseline, month 3 and month 6 comparing high-protein, energy-restricted, high-vitamin E and -fibre diet group and control diet group
A two-way mixed ANOVA (Table 4) revealed significant treatment group×time effect on body weight (P<0·001), BMI (P<0·001), WC (P<0·001), WHR (P=0·001), fat mass (P<0·001), fat-free mass (P=0·010) and percentage body fat (P<0·001), even after adjusting for covariates, age, sex, physical activity, smoking and alcohol consumption. Further, pairwise comparisons revealed that the Hipcref diet group had significant reduction in body weight, BMI, WC, fat mass and percentage body fat at month 3 and month 6 compared with the baseline values (P<0·05). However, pairwise comparisons revealed that the control diet group showed significant increase in body weight and BMI at month 3 and month 6 compared with the baseline values (P<0·05). Moreover, the control diet group showed significant increase in WC, WHR and fat mass at month 6 compared with the baseline values (P<0·05).
Anthropometric parameters at month 3 and month 6 compared with baseline in the high-protein, energy-restricted, high-vitamin E and -fibre (Hipcref) diet group (n 65) and control diet group (n 63)Footnote ‡Footnote § (Mean values with their standard errors)

WC, waist circumference; WHR, waist:hip ratio.
* Significant at P<0·05; differences from baseline at month 3, and the same at month 6.
† Significant at P<0·05; differences between baseline and month 6.
‡ Covariates, age, sex, physical activity, smoking and alcohol consumption were adjusted for.
§ Further, pairwise comparisons were performed to assess the difference at month 3 and month 6 compared with baseline values within the treatment group.
|| A two-way mixed ANOVA was performed to assess the effect of treatment group×time in anthropometric parameters at month 3 and month 6 between the Hipcref diet group and the control diet group.
¶ P<0·05 was considered significant.
Mean differences in responses in blood pressure and blood biochemical parameters at baseline and month 6 between high-protein, energy-restricted, high-vitamin E and -fibre diet group and control diet group
A two-way mixed ANOVA revealed that the Hipcref diet group had significantly higher reduction in fasting insulin (P<0·001), HOMA-IR (P<0·001) and hsCRP levels (P=0·020) compared with the control diet group at month 6, even after adjusting for covariates, age, sex, physical activity, smoking and alcohol consumption (Table 5). No significant difference was found in blood pressure, fasting glucose and blood lipid levels between the two groups (P>0·05).
Responses in blood pressure and blood biochemical parameters at month 6 compared with baseline in the high-protein, energy-restricted, high-vitamin E and -fibre (Hipcref) diet group (n 65) and control diet group (n 63)Footnote †Footnote ‡ (Mean values with their standard errors)

HOMA-IR, homoeostatic model assessment-insulin resistance; hsCRP, high-sensitivity C-reactive protein.
* P<0·05 was considered as significant.
† A two-way mixed ANOVA was performed to assess the effect of treatment group×time in blood pressure and blood biochemical parameters between the Hipcref diet group and control diet group.
‡ Covariates, age, sex, physical activity, smoking and alcohol consumption were adjusted for.
Mean differences in responses in dietary parameters at baseline and month 6 between high-protein, energy-restricted, high-vitamin E and -fibre diet group and control diet group
Results from a two-way mixed ANOVA revealed that the Hipcref diet group consumed significantly higher percentage energy from protein (P<0·001), percentage energy from PUFA (P=0·009), energy-adjusted vitamin E (mg) (P<0·001), energy-adjusted fibre (g) (P<0·001) and had lower intake of TE (P<0·001), percentage energy from fat (P=0·001) and percentage energy from carbohydrate (P=0·007) compared with the control diet group at month 6, even after adjusting for covariates, age, sex, physical activity, smoking and alcohol consumption (Table 6).
Responses in dietary parameters at month 6 compared with baseline in the high-protein, energy-restricted, high-vitamin E and -fibre (Hipcref) diet group (n 65) and control diet group (n 63)Footnote †Footnote ‡ (Mean values with their standard errors)
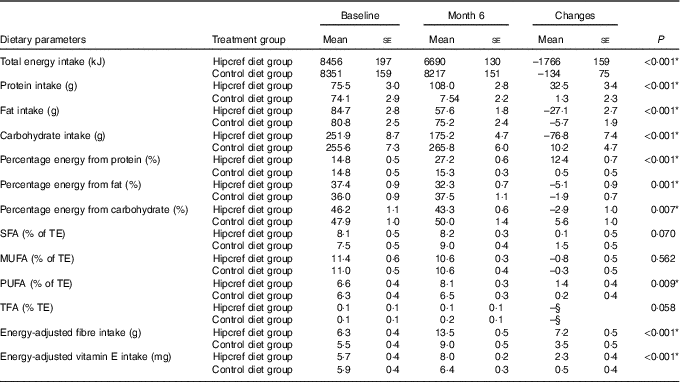
TFA, trans-fatty acids, TE, total energy.
* P<0·05 was considered as significant.
† A two-way mixed ANOVA was performed to assess the effect of treatment group×time in blood pressure and blood biochemical parameters between the Hipcref diet group and control diet group.
‡ Covariates, age, sex, physical activity, smoking and alcohol consumption were adjusted for.
§ No change.
Dietary adherence score comparing high-protein, energy-restricted, high-vitamin E and -fibre diet group and control diet group
The adherence score for both the Hipcref diet group and the control diet group is presented in Table 7. No significant difference was found in the dietary adherence score between the two groups on a per protocol basis (P=0·489). However, significant difference in adherence score was found between the two groups on an ITT basis. The control diet group had significantly higher score (7·4 (se 0·8)) compared with the Hipcref diet group (4·6 (se 0·4)) (P=0·002), suggesting poor dietary adherence compared with the Hipcref diet group.
Adherence score between the high-protein, energy-restricted, high-vitamin E and -fibre (Hipcref) diet group and control diet group (Mean values with their standard errors)

* P<0·05 was considered as significant.
† The independent t test was performed to assess the difference in adherence score between the Hipcref diet group and control diet group.
Discussion
Despite the large number of weight loss intervention programmes, long-term maintenance of weight loss has been unsuccessful in populations, and regain of lost weight is a common phenomenon( 52 , Reference Dombrowski, Knittle and Avenell 53 ). The majority of earlier weight loss intervention studies targeted energy restriction and reduced carbohydrate or fat intake( Reference Strychar 54 ). In the present study, we aimed to develop a dietary strategy for weight management which is easy to adhere to. The prescribed diet was based on habitual food intake and hence was affordable. To the best of our knowledge, this is the first study conducted in overweight and obese Malaysian adults that investigates the effectiveness of a 6-month individualised, energy-restricted diet with high-protein, high-vitamin E and high-fibre intake. The aim of this study was to investigate the effects of the Hipcref diet on body composition and blood biochemical parameters compared with the generalised dietary instruction for weight loss, at the end of the intervention period. As far as we know, our approach is new for the Malaysian population.
Our findings revealed that overweight and obese Malaysian adults following the Hipcref diet had greater reduction in obesity-related anthropometric parameters (BMI, WC, WHR, fat mass and percentage body fat) and better metabolic health outcomes (fasting insulin, HOMA-IR and hsCRP levels) compared with the generalised dietary instruction on weight loss. Participants following the Hipcref diet had successfully reduced 3·5 kg of body weight and lost 2·3 % of body fat in 6 months, which translated to a reduction of 0·6 kg of body weight and 0·4 % of body fat per month. The beneficial effect of the Hipcref diet on obesity-related anthropometric parameters (e.g. BMI, WC, fat mass and percentage body fat) was observed at month 3 and was maintained at month 6. Insulin sensitivity improved significantly in the participants following the Hipcref diet as reflected in the reduced fasting insulin levels and reduced HOMA-IR. Baseline fasting blood glucose levels in the Hipcref diet group were below the diagnostic cut-off (5·6 mmol/l)( 55 ) defining the metabolic syndrome, and did not reduce after intervention, suggesting that the intervention diet resulted in weight loss and improvement in insulin sensitivity without leading to hypoglycaemia.
Individuals following MDG 2010 dietary guidelines (control diet group) showed opposite effects. They had significant increase in obesity-related anthropometric parameters (e.g. BMI, WC, fat mass and percentage body fat), HOMA-IR and hsCRP levels after 6 months. These results suggest that traditional dietary counselling for weight management based on MDG 2010, National Coordinating Committee for Food and Nutrition (NCCFN)( Reference Mustapha, Omar and Mihat 56 ) (no more than 6276 kJ/d with a macronutrient composition – approximately 10–15 % energy from protein, 20–30 % energy from fat and 55–70 % energy from carbohydrate) seem to be ineffective in promoting weight loss in overweight and obese Malaysian adults.
High attrition rate in control diet group
Our findings revealed that the Hipcref diet group had better adherence score compared with the control diet group (Table 7). There was relatively higher attrition rate in the control diet group. This may be because of demotivation in the latter individuals to pursue the programme due to failure to lose weight. Our results revealed that the dropouts in the control diet group were younger, had significantly higher BMI and comprised higher number of smokers compared with the completers (Table 2).
Intervention diet – energy restriction
Our findings revealed significant reduction in TE intake in individuals following the Hipcref diet (an average reduction of 422 kcal/d). Portion control is key to managing weight; however, requesting people simply to ‘eat less’ may not be the best approach. Smaller portions of high-energy-dense food may disproportionately increase energy intake compared with consumption of low-energy foods( Reference Rolls 24 ). Liquid meal replacements and solid pre-portioned foods for weight loss and weight loss maintenance may have been successful in weight loss( Reference Heymsfield, Van Mierlo and van der Knaap 14 ), but it is doubtful whether such artificial diets lead to better understanding of individual portions during meal times post-intervention. Under real-life situations, consumers do not retain the motivation to continue with such foods that do not relate to the cereals, fruits, vegetables, egg or meat that they eat habitually. As part of the intervention process, counselling was provided to the Hipcref diet group on choosing portions that were charted to the participants, using household utensils (scales, plates, cups and spoons) and portion size photographs. We envisaged that this support would lead to improved understanding of the portions consumed and the corresponding energetic value.
With respect to blood biochemical parameters, our results revealed significant reduction in hsCRP and HOMA-IR with the Hipcref diet. hsCRP is known to be the best systemic marker for inflammation and it is a strong independent predictor of future cardiovascular events( Reference Devaraj, Singh and Jialal 57 ). It has been demonstrated that increase in hsCRP levels was highly associated with increased adipose tissue. Adipose tissue is involved in the regulation and production of inflammatory cytokines that induce the production of hsCRP( Reference Maachi, Piéroni and Bruckert 58 ). Therefore, a reduction in the excess body fat stores can significantly reduce the inflammatory state( Reference Petelin, Bizjak and Cernelic-Bizjak 59 ). A systematic review reported that reduction in hsCRP levels may be due to the consequence of weight loss following a moderate reduction in energy intake( Reference Selvin, Paynter and Erlinger 60 ). Previous studies have reported that energy restriction was a significant factor in improving glycaemic control and insulin sensitivity with weight loss( Reference Wing, Blair and Bononi 61 ). In our participants, favourable effect on the above biochemical parameters in individuals on the Hipcref diet may due to the energy restriction and reduction in body fat mass.
Intervention diet – higher intake of protein
High-protein diets promote weight loss, reduce abdominal obesity, reduce TAG levels, and improve glucose metabolism( Reference Pesta and Samuel 62 – Reference Gannon, Nuttall and Saeed 65 ). We envisaged that higher protein intake could prevent loss of muscle mass as the participants lost weight through energy reduction. Johnston et al. ( Reference Johnston, Sears and Perry 66 ) reported that a high-protein diet with modest energy restriction was effective in reducing HOMA-IR in healthy adults compared with a lower-protein, standard diet, in the US population. Conflicting theories have been reported by other studies. Wycherley et al. ( Reference Wycherley, Moran and Clifton 67 ) reported that high-protein and standard-protein diets resulted in similar weight loss and reduction in HOMA-IR. These investigators concluded that reduction in body weight was the factor in improving insulin sensitivity compared with the quantity of dietary protein.
Several studies have investigated the effect of high-protein diets on hsCRP( Reference Gulati, Misra and Tiwari 21 , Reference Azadbakht, Izadi and Surkan 22 , Reference Noakes, Keogh and Foster 68 ). Gulati et al. ( Reference Gulati, Misra and Tiwari 21 ) reported that a high-protein diet (29 % PRO, 24 % FAT and 47 % CHO) was found to be effective in reducing hsCRP levels compared with the control diet group (15 % PRO, 25 % FAT and 60 % CHO) in an Indian population. Contrary to that, Azadbakht et al. ( Reference Azadbakht, Izadi and Surkan 22 ) and Noakes et al. ( Reference Noakes, Keogh and Foster 68 ) reported that hsCRP level reduced, with weight loss independent of dietary protein content, in an Iranian population.
In our participants, perhaps the positive impact on insulin sensitivity was due to the combined effect of both energy restriction and high protein intake.
Macronutrient intake and intervention diet
Participants in the Hipcref diet group had significantly lower consumption of TE intake, percentage energy from fat and percentage energy from carbohydrate and significantly higher intake of percentage energy from protein, PUFA and fibre compared with the control diet group after 6 months of dietary intervention.
Despite widespread consensus that a reduced intake of saturated fat lowers CVD risk, the optimal type of macronutrient (protein, unsaturated fat or carbohydrate) that should replace saturated fat is uncertain( Reference Briggs, Petersen and Kris-Etherton 69 ). Many past studies have focused on fat consumption and the metabolic syndrome( Reference Freire, Cardoso and Gimeno 70 , Reference Riccardi, Giacco and Rivellese 71 ). In particular, the consumption of saturated fat was believed to influence insulin resistance and CVD by increasing serum LDL-cholesterol levels( Reference DiNicolantonio, Lucan and O’Keefe 72 ). In recent years, there has been an increasing interest in the effect of carbohydrate on metabolic disease. In the past, it was not considered a concern if 55–65 % of the TE was sourced from carbohydrate-rich foods. However, recently there is concern that excessive intake of carbohydrates, particularly refined carbohydrates, may contribute to metabolic diseases( Reference Siri-Tarino, Sun and Hu 73 ). High-carbohydrate consumption has been reported to increase serum TAG and lower HDL-cholesterol and lead to the metabolic syndrome( Reference Ma, Li and Chiriboga 74 ). Further, excess carbohydrates are converted to TAG, and the correlation between elevated serum TAG levels and CVD cannot be disputed( Reference Nordestgaard and Varbo 75 ). Lower consumption of carbohydrate and increased consumption of protein may, in fact, be the most effective way to reduce serum TAG levels.
In our study, in the Hipcref diet group, we observed a reduction in total cholesterol and LDL-cholesterol levels from baseline although these reductions did not reach statistical significance. No change in TAG levels from baseline was found in the participants following the Hipcref diet, and the TAG levels were lower than the diagnostic cut-off defining the metabolic syndrome (1·7 mmol/l( 55 )). There was a small reduction in HDL-cholesterol level in the Hipcref diet group, this difference from baseline did not reach statistical significance and was above the diagnostic cut off defining the metabolic syndrome (1·03 mmol/l for male; 1·29 mol/l for female( 55 )). These results may be explained by the food sources selected for the Hipcref diet participants. The food sources to increase protein intake in the present study were mainly animal proteins. Animal food sources are known to increase saturated fat intake. A systematic review reported that soya protein (with isoflavones) or other plant proteins (pea and lupine protein, wheat gluten) had greater decrease in total cholesterol and LDL-cholesterol levels compared with animal-sourced protein( Reference Chalvon-Demersay, Azzout-Marniche and Arfsten 76 ). Diets that induce negative energy balance continue to be the cornerstone of weight management. However, long-term volitional reduction in energy intake is challenging. With transformation of Malaysia’s economy in the recent decades, the food consumption pattern of the population has shifted from that of a traditional cereal- and legume-based one to that which is rich in meat and meat products( Reference Soon and Siong Tee 77 ). Animal products not only provide high-quality protein but also are important sources of essential micronutrients (Fe, Zn and vitamin A). To maximise outcome, our Hipcref diet sourced protein mainly from food of animal origin, for example, milk and milk products, egg, fish and chicken, but not red meat.
Two major goals of dietary recommendations are to lower blood pressure and improve serum lipids, two of the primary determinants of CVD risk. Early research documented that the DASH diets (carbohydrate-rich diet that emphasises fruits, vegetables, and low-fat dairy products) reduced blood pressure in study subjects( Reference Conlin 78 ). In addition to lowering blood pressure, the DASH diet lowered total cholesterol and LDL-cholesterol levels( Reference Sacks, Svetkey and Vollmer 79 ). It is uncertain whether partial replacement of carbohydrate with either unsaturated fat or protein can improve blood pressure and lipid profile( Reference Sacks, Svetkey and Vollmer 79 ). In OmniHeart randomised trial, a diet that partially replaced carbohydrates with protein, about half from plant sources, lowered blood pressure, LDL-cholesterol levels, and TAG levels as well as HDL-cholesterol levels among adults with prehypertension or stage 1 hypertension( Reference Appel, Sacks and Carey 80 ). A diet that partially replaced carbohydrates with unsaturated fat, predominantly monounsaturated fat, lowered blood pressure and TAG levels and increased HDL-cholesterol levels but had no significant effect on LDL-cholesterol levels.
The Hipcref diet contributed to 32 % energy from fat of which 8 % of TE was from SFA, 11 % of TE from MUFA, 8 % of TE from PUFA and 0·1 % of TE from TFA. These changes from the baseline were within the favourable range of the recommended guidelines( 36 ). The Hipcref diet was successful in increasing the PUFA intake from 6 % of TE to 8 % of TE, which is on the higher range of the recommendation (4–8 % of TE)( 36 ). We report that moderate energy restriction (average reduction of 1766 kJ/d), carbohydrate restriction (43 % energy from carbohydrate; 175 g/d) and higher protein intake (an average of 27 % energy from protein; 108 g/d), with fat intake within the NCCFN guidelines have been successful in managing weight in our Malaysian adult participants.
Intervention diet – ≥15 mg/d vitamin E
Dietary micronutrients, especially with anti-inflammatory and anti-oxidant properties are known to have beneficial effects on cardiovascular outcome( Reference Pham-Huy, He and Pham-Huy 81 ). Vitamin E is a micronutrient with anti-oxidant and immune-modulating properties, which can reduce oxidative stress and inflammation( Reference Singh and Jialal 82 ). A study by Devaraj et al. ( Reference Devaraj, Leonard and Traber 83 ) demonstrated that the combination of α- and γ-tocopherol supplementation showed beneficial effect on markers of inflammation in patients suffering from the metabolic syndrome, suggesting the potential of vitamin E in ameliorating oxidative stress and inflammation in such patients. A significant inverse association of vitamin E and hsCRP has been demonstrated in other studies( Reference Devaraj, Tang and Adams-Huet 32 , Reference Scheurig, Thorand and Fischer 33 ). In our study, the intake of vitamin E in both the Hipcref diet group and control diet group met the Malaysian dietary recommendations (7·5 mg/d for women and 10 mg/d for men). However, reduction in hsCRP levels was only observed in the Hipcref diet group.
Previous studies demonstrated that vitamin E supplementation (900 mg/d for 4 months) reduced oxidative stress and improved insulin action in healthy and non-insulin-dependent diabetic patients( Reference Paolisso, D’Amore and Giugliano 84 ). Manning et al. ( Reference Manning, Sutherland and Walker 85 ) reported that overweight individuals supplemented with high-dose vitamin E (800 IU of vitamin E/d for 3 months and 1200 IU for further 3 months) improved insulin action and decreased plasma fasting insulin and glucose levels by reducing cellular oxidative stress, altering membrane properties and decreasing inflammatory activity. Therefore, the beneficial effect of the Hipcref diet on metabolic parameters in our study participants may be due to higher vitamin E intake.
Intervention diet – ≥25 g/d dietary fibre
A review of studies examining the effects of fibre on body weight found that higher dietary fibre intake was associated with increased satiety and decreased hunger( Reference Howarth, Saltzman and Roberts 86 ). Large prospective cohort studies consistently reported significant associations between high dietary fibre intake (>25 g/d in women and >38 g/d in men) and reduced risk of developing type 2 diabetes (T2D) (20–30 % of reduced risk)( Reference Weickert and Pfeiffer 87 ). The proposed mechanisms for this relationship remain unclear, but the type of fibre may play a role. In the gut, certain soluble fibres which form a viscous gel matrix is believed to slow gastric emptying and lead to a greater feeling of fullness( Reference Slavin and Green 88 ). Soluble fibres slow absorption of glucose further in the small intestine and lead to lower postprandial glycaemic and insulinaemic responses( Reference Yu, Ke and Li 89 ). Therefore, high-soluble fibres may contribute to the improvement in glycaemic control and insulin sensitivity. Moreover, in both the cross-sectional and longitudinal analyses, Ma et al. ( Reference Ma, Griffith and Chasan-Taber 90 ) reported that fibre intake was protective against high hsCRP levels. It was suggested that dietary fibre decreases lipid oxidation, which in turn is associated with decreased inflammation( Reference King 91 ). Therefore, we report that the beneficial effect on cardio-metabolic parameters in our Hipcref diet group may be due to their higher fibre intake.
Strengths and limitations
Participant allocation to the two treatment groups (Hipcref diet and control) was based on a structured randomisation procedure as described earlier. This is a strength of the study. The dietary intervention is novel, practical and easily adoptable in day-to-day life. This dietary intervention strategy could be readily tested in primary care services with minimal cost. Our intervention programme did not include any physical activity regimens, that is, dietary modifications alone caused positive changes in anthropometric and metabolic parameters in the intervention group. The study participants represent the three major ethnic groups of Malaysia. This study has tested a dietary strategy that included ethnicity-specific food preferences and popular traditional recipes practiced. The study has successfully proved that simple modification of traditional recipes can bring a modest change in body composition and metabolic health.
There are some limitations to the present study. There was relatively higher attrition rate in the control diet group compared to the Hipcref diet group. This may be due to demotivation to pursue the programme because of failure to lose weight. However, if we assume that the non-completers in the control diet group lost less weight compared with the completers, our estimate of treatment effect would remain unaffected. In other words, it is unlikely that the missing data would have changed our main results from positive to negative. The use of a single 24 h recall at baseline and at the end of treatment is a limitation of this study. More frequent collection of dietary intake may have provided a more precise representation of actual dietary intake. Body composition was assessed using bioelectrical impedance analysis (BIA). Many factors such as the food and fluid intake, environment, ethnicity and phase of menstrual cycle affect BIA estimates. This is a major limitation of this study. It is understandable that individuals motivated to lose weight participated in the present study willingly. Therefore, the Hipcref diet should be tested in other geographical locations and population groups to assess its efficacy in managing body weight in the Malaysian population at large. As per the dietary strategy of this study, energy restriction, higher protein, PUFA, vitamin E and dietary fibre intake had a combined effect on the success of the intervention diet. We cannot attribute the success of the Hipcref diet to any one of the latter dietary components.
Conclusion
Participants in the Hipcref diet group lost 3·5 kg of body weight and 2·6 % of body fat in 6 months, which translated to a reduction of 0·6 kg of body weight and 0·4 % of body fat per month. Significant reduction was achieved in HOMA-IR and hsCRP levels. Although not significant, small reductions were achieved in total cholesterol and LDL-cholesterol levels. In comparison, such positive effects were not observed in the control diet group. Our results suggest that the Hipcref diet contributed to favourable outcomes in obesity-related anthropometric and metabolic parameters, compared with the MDG 2010 guidelines. The comparison between the post-intervention dietary intake of both groups revealed a significant difference in the intake of the following nutrients per d. Participants on the Hipcref diet had reduced energy intake, higher percentage energy from protein, lower percentage energy from fat, lower percentage energy from carbohydrate, higher percentage energy from PUFA, higher vitamin E and fibre intake (Table 6) compared with the control diet group. We opine that the success of the Hipcref diet may be due to the combined effect of the above nutrient composition of the Hipcref diet. Dietary guidelines by MDG 2010 (macronutrient composition – approximately 10–15 % energy from protein, 20–30 % energy from fat and 55–70 % energy from carbohydrate) is applicable to healthy Malaysians with healthy BMI. However, for overweight and obese Malaysian adults, we recommend the Hipcref diet for successful weight management and favourable metabolic health. Further, we emphasise that personal dietary preferences should be considered as an important factor when developing strategies for weight management in any population.
Acknowledgements
The authors would like to express their gratitude to the participants of the study for their time and co-operation. The authors gratefully acknowledge the contribution of Dr Farahnaz Amini for her support of this study. The authors are thankful to Ms Nadia Rajaram for her advice on statistical analysis. The authors thank Ms Nurdiana Binti Haji Zainol Abidin and Ms Leh Hui Eng for their assistance in data collection. The authors also thank the staff of the Diagnostic Center for their assistance with the blood analysis.
The study was funded by internal grants from UNM (UNHB0008).
S. R. M. designed the study, supervised and conducted data collection. P. Y. T. collected data, captured data and performed statistical analysis on the data under the supervision of S. R. M. P. Y. T. and S. R. M. wrote the paper. Both the authors read and approved the final manuscript.
P. Y. T. and S. R. M. declare no conflict of interest.
Supplementary material
For supplementary material/s referred to in this article, please visit https://doi.org/10.1017/S0007114519000345



