

Introduction
The Mackenzie River basin, located in northern Canada, is one of the largest river basins in the world, and contributes a significant amount of fresh-water discharge into the Arctic Ocean. The Mackenzie GEWEX Study (MAGS) is a Canadian investigation that has the objectives of understanding and modelling the water and energy cycles and their roles in the climate system in this high-latitude basin, and improving our ability to assess potential changes due to climate variability and change (Reference StewartStewart and others, 1998). MAGS is one of five continental-scale studies within the Global Energy and Water Cycle Experiment (GEWEX), which is an international effort developed by the World Climate Research Program (WCRP).
Since the Mackenzie River represents a high-latitude northern river basin, seasonal snow cover is a significant feature for 6–8 months of the year that affects both the energy and water cycles of the basin, due to its high albedo and storage and release of water. One of the ongoing MAGS research investigations that is being conducted by the Climate Research Branch (CRB) of the Meteorological Service of Canada (MSC) has focused on the determination of spatial and temporal variability in snow cover, specifically snow areal extent and water equivalent, over the Mackenzie River basin using both satellite and conventional datasets. The CRB has had a long-standing research program focused on the development of algorithms that derive snow water equivalent (SWE) from passive-microwave satellite data for Canadian landscape regions (e.g. prairie, boreal forest) (Reference Goodison, Walker, Choudhury, Kerr, Njoku and PampaloniGoodison and Walker, 1995). A major thrust of the MAGS snow-cover research investigation has been the testing of prairie and forest SWE algorithms for the area covered by the Mackenzie River basin and derivation of information on spatial and temporal variations in snow cover. This paper presents the results of this passive-microwave SWE algorithm-evaluation effort for the MAGS study area, highlighting a 10 year time series of SWE over the basin that has been produced as a contribution to Phase 1 of MAGS. The challenges and limitations for passive-microwave snow-cover determination over such a large river basin of diverse landscapes (e.g. tundra, forest, wetland, mountains) are discussed. Finally, future expectations and plans for SWE algorithm refinement and development as part of Phase 2 of MAGS are presented in light of new passive-microwave sensors that are scheduled for launch in the coming years.
The Mackenzie Gewex Studyarea
The Mackenzie River basin is located in northwestern Canada (see Fig. 1), stretching from approximately 52°N to 70°N and with an area of about 1.86106 km2, which is equivalent to about 20% of Canada’s land mass (Reference StewartStewart and others, 1998). Because the basin is so large, it is covered by a diverse range of landscapes including low-vegetation tundra areas in the north, mountains along the western edge, and agricultural prairie at the southern edge, and the remainder of the basin is a mix of forest and wetlands. The Mackenzie basin is divided into six subbasins Peel, Bear, Slave, Liard, Peace and Athabasca––as shown in Figure 1. Three large lakes (Great Bear Lake, Great Slave Lake and Lake Athabasca) are significant features in the basin, but many small lakes dot the landscape, especially in the eastern part of the basin. Reference StewartStewart and others (1998) provide a complete description of the basin and its climate characteristics, as well as a summary of the scientific issues that are the focus of MAGS. Seasonal snow cover begins to accumulate each year over the northern part of the basin in late September or October, gradually extending further south until the entire basin is covered (usually by mid- to late November). The largest accumulation of snow is in the mountains along the western edge of the basin, and the distribution of snow-cover amounts over the rest of the basin is a function of the patterns of snowfall producing weather systems, vegetation characteristics and terrain. With the onset of spring melt, the snow cover starts to recede over the basin, starting in the south in early April and gradually extending further north until the entire basin becomes snow-free, usually by the end of June.
Location of the Mackenzie River basin and its six subbasins that are the focus of MAGS.

MAGS Passive-Microwave-Derived Snow Cover
Passive-microwave remote sensing is the only proven satellite-based method for retrieval of SWE. It is based on the principle of volume scattering (i.e. scattering by snow crystals within the snowpack) of the emission of microwave radiation from the underlying ground, resulting in a reduced amount of radiation being emitted from the snowpack as compared to snow-free conditions. The reduction in emission increases with increasing depth and density of the snow crystals, hence the sensitivity to SWE. Since the early 1980s, advancements have been made in the development of algorithms that derive snow-cover properties from satellite passive-microwave data (e.g. Reference Chang, Foster and HallChang and others, 1987; Reference Hallikainen and JolmaHallikainen andJolma, 1992; Reference Grody and BasistGrody and Basist, 1996; Reference Walker, Goodison and SteinWalker and Goodison, 2000).
In Canada, initial development of SWE algorithms by MSC/CRB using passive-microwave data was focused on the southern prairie region of western Canada due to the simplicity of the landscape (i.e. relatively flat, non-vegetated in winter) and the recognized need for snow-cover information to meet operational water-resource monitoring and forecasting requirements. In February 1982, an intensive field campaign was conducted in the Canadian prairies involving airborne microwave radiometer (18 and 37 GHz, vertical and horizontal polarizations) and airborne gamma measurements along an 1100 km flight-line network and ground surveys along selected flight-line segments. Linear regression analysis of the microwave radiometer data with SWE values derived for each flight-line from the airborne gamma measurements, yielded a strong linear relationship (r2 = 0.89) between the 37 and 18 GHz vertical-polarization brightness temperature (TB) gradient ![]() and SWE. The use of the 37 and 18 GHz brightness-temperature gradient for retrieval of snow parameters (e.g. depth and SWE) has also been demonstrated by Reference Künzi, Patil and RottKünzi and others (1982). This linear relationship became the basis of a prairie algorithm, SWE = –20.7 – 49.27(GTV), which has been used by CRB since the mid-1980s for the retrieval of snow-cover information in this region from satellite passive-microwave data. Reference Goodison, Walker, Choudhury, Kerr, Njoku and PampaloniGoodison and Walker (1995) summarize the development, validation and implementation of this algorithm with satellite data for the generation of operational SWE map products.
and SWE. The use of the 37 and 18 GHz brightness-temperature gradient for retrieval of snow parameters (e.g. depth and SWE) has also been demonstrated by Reference Künzi, Patil and RottKünzi and others (1982). This linear relationship became the basis of a prairie algorithm, SWE = –20.7 – 49.27(GTV), which has been used by CRB since the mid-1980s for the retrieval of snow-cover information in this region from satellite passive-microwave data. Reference Goodison, Walker, Choudhury, Kerr, Njoku and PampaloniGoodison and Walker (1995) summarize the development, validation and implementation of this algorithm with satellite data for the generation of operational SWE map products.
The development of SWE algorithms for the boreal-forest region of western Canada was implemented by CRB with airborne microwave radiometer data (18, 37 and 92 GHz) that were collected over flight-lines in southern and northern boreal-forest study sites in February 1994 as part of the Boreal Ecosytem–Atmosphere Study (BOREAS) (Reference ChangChang and others, 1997). Intensive ground surveys were also conducted along the flight-lines to measure snow characteristics such as depth, density, SWE and snowpack structure, and provide a ground-truth dataset for analysis of the airborne microwave data. For each flight-line, segments of homogeneous land-cover (forest) type were identified using BOREAS land-cover classification maps, for which SWE values were extracted from the ground-truth dataset, and 37 and 18 GHz brightness temperatures were extracted from the airborne microwave dataset. Linear regression analysis of the brightness temperature (TB) and in situ SWE datasets yielded three significant linear relationships (r2 > 0.80) between the 37 and 18 GHz vertical-polarization TB difference (i.e. 37V TB – 18V TB) and SWE for three forest types (coniferous, deciduous and sparse). These linear relationships were used as the basis for three forest SWE algorithms for coniferous, deciduous and sparse (low-density) forest types, where each algorithm has the form SWE = a-b(37V Tb-19V TB), where coefficients a and b are specific to the forest type. The development and initial satellite application and validation of these algorithms using Special Sensor Microwave/Imager (SSM/I) data are described in Reference Goita, Walker, Goodison and ChangGoita and others (1997). Since winter 1999, the prairie and forest SWE algorithms have been used together to generate enhanced SWE map products for the three prairie provinces in western Canada.
In order to investigate the spatial and temporal variability of snow cover over the Mackenzie River basin with passive-microwave satellite data, it is necessary to take into account the diversity of land-cover types that exist across the basin. To address this issue, the prairie and forest SWE algorithms described above have been applied to the data record from SSM/I sensors that have been launched on U.S. Defense Meteorological Satellite Program (DMSP) satellites since 1987. The U.S. National Snow and Ice Data Center (NSIDC) in Boulder, CO, produces and distributes gridded SSM/I brightness-temperature datasets on CD-ROMusing a 25 km fixed Earth grid known as EASE-Grid (Equal-Area SSM/I Earth Grid), described in Reference Armstrong and BrodzikArmstrong and Brodzik (1995). SSM/IEASE-Grid datasets for 11winter seasons from 1987/88 to 1997/98 were extracted from the CD-ROMs for derivation of SWE over the MAGS study area.
Application of the prairie and forest SWE algorithms requires the use of a land-cover classification over the MAGS region. The NSIDC has produced a land-cover dataset in EASE-Grid format using the International Geosphere–Biosphere Programme (IGBP) 1km global land-cover classification (Reference LovelandLoveland and others, 2000). The 17 land-cover classes of the IGBP land-cover classification were aggregated into the four different land-cover types that are the focus of the prairie and forest SWE algorithms. Each IGBP land-cover class was assigned as either coniferous forest, deciduous forest, sparse forest or open (non-vegetated) according to the definition of IGBP class (i.e. characteristics of the land cover). Land-cover classes with very low density (10% or less) or no vegetation in winter (e.g. cropland, grassland, open shrubland, wetlands and barren) were grouped into the open class to which the prairie algorithm would be applied. At each EASE-Grid cell, percentage values for the relative amounts of each of the four land-cover types present were calculated. Figure 2 presents an overview of the dominant (>50% of the EASE-Grid cell) land-cover types (as derived from the EASE-Grid IGBP land-cover product) over the MAGS region according to the four land-cover types that are the focus of the prairie and forest SWE algorithms. The coniferous-forest class is the most prevalent over the region. The open class includes agricultural areas in the south of the study area, and tundra along the northeastern boundary. The four CRB land-cover SWE algorithms (three forest and one prairie) were applied to SSM/I19 and 37 GHz vertical-polarization brightness temperatures at each EASE-Grid cell by weighting each algorithm according to the percentage of its relevant land-cover class. The end result is one SWE value (in millimetres) per gridcell that takes into account the effects of the range of land-cover types present in the gridcell, as defined in the equation:
Dominant land-cover types over the Mackenzie River basin applicable to the prairie and forest SWE algorithms as derived from IGBP land-cover classifications in EASE-Grid format.

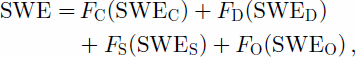
where Fi is the fraction of land-cover type (C, coniferous; D, deciduous; S, sparse; O, open) and SWEi is the SWE algorithm for each land-cover type.
The land-cover SWE algorithms were applied to SSM/I EASE-Grid datasets extracted for selected time periods in January–April during each winter season from 1988 to 1998. The time periods were selected based on the availability of in situ SWE measurements for evaluation of the algorithm results. For each time period, the satellite-derived SWE values were mapped over the MAGS region to facilitate comparisons with the in situ data.
SWE Algorithm Performance Assessment
Snow surveys are conducted each winter over parts of the Mackenzie River basin by a number of federal (e.g. Indian and Northern Affairs Canada), provincial/territorial (e.g. Alberta Environment) and private (e.g. power companies) agencies who require information on snow cover, specifically SWE, to plan for spring runoff and potential flooding, assess potential forest-fire risk or manage hydropower production (Reference Brown, Walker and GoodisonBrown and others, 2000). SWE is generally measured at established snow courses, and in the mountain areas snow pillows supplement the snow-survey measurements. Figure 3 indicates the location of snow-survey sites in the MAGS region where SWE data are generally available from snow-course measurements. The sites are irregularly spaced over the basin, with the highest concentrations in the Slave, Peace and Athabasca subbasins. The northern subbasins, Bear and Peel, have very few sites. Agency snow surveys are commonly carried out using helicopters to access the snow-course sites, and due to the cost involved, the timing is usually in mid- to late winter to assess snow-cover conditions in advance of spring melt. Timing of the surveys may vary from year to year, and the length of time required to conduct the survey (i.e. acquire measurements at all the snow-course sites in one region) can be several days to a week.
Location of winter snow-survey measurements in the Mackenzie River basin.

Snow-survey datasets were acquired for the 1988–98 time period from the various agencies who conduct regular in situ measurements for use in the validation SWE algorithm results over the MAGS region. To supplement these datasets, snow-cover datasets from special surveys that have been conducted by other MAGS investigators were also acquired (e.g. Reference Marsh, Pomeroy, Pietroniro, Neumann and NelsonMarsh and others, 1997). For each winter season in the 1988–98 dataset, approximately three target periods were selected (averaging 7–10 days) based on the availability of the highest temporal and spatial concentration of in situ SWE measurements.
The SSM/I-derived SWE was assessed at the MAGS subbasin scale, focusing on the areas where the in situ SWE measurements were located. The overall objective of the evaluation/validation effort was to assess the performance of the current passive-microwave SWE algorithms for the various parts of the basin and thus assess where SWE could and could not be reliably derived using this technique. Subbasins with complex topography (e.g. mountains) became lowest priority in the validation effort since it was known that the current SWE algorithms could not reliably represent the SWE over a 25 km area (SSM/I spatial resolution) containing steep slopes and varying aspects with extremely varying amounts of high SWE (e.g. several hundred millimetres). Figure 4 depicts the topography of the Mackenzie River basin as derived from ETOPO5 5′ resolution elevation data. Areas with elevations of >1000m were generally not included in the evaluation of the SWE algorithm results, which corresponds to a region along the western edge of the basin that is approximately 20% of the entire basin area. The 1000m elevation threshold represents the lower end of a steep elevation gradient that corresponds to the mountainous terrain region of the basin.
Topography of the Mackenzie River basin at 500 m contour levels as derived from ETOPO5 5 ′ resolution elevation data.

For each target period, maps were generated at the subbasin level containing the SSM/I-derived SWE values contoured using 10 mm contour levels and the SWE values from the in situ datasets. These maps were the basis of the assessment of SWE algorithm performance. Figure 5 presents an example of one of these maps illustrating SSM/I-derived SWE for the northern part of the Slave River basin on 7 February 1992, compared with corresponding in situ SWE measurements gathered during the period 6–14 February 1992. Although Figure 5 is included to provide one typical example of the several maps that were prepared for the MAGS SWE algorithm-validation effort, it also illustrates the challenge that was present in validating the SSM/I SWE retrievals with limited in situ data for comparison. Climate data (e.g. temperature, precipitation) for meteorological stations located within the subbasin were also acquired and analyzed for each target period in order to avoid occurrences of snowmelt, when SWE cannot generally be derived using passive-microwave techniques, or to assess whether significant snowfall events occurred within the target period.
SSM/I-derived SWE over the northern part of the Slave subbasin on 7 February 1992 compared with in situ SWE values acquired during the period 6–14 February 1992.

Assessment of the SWE algorithm performance was carried out by conducting a visual (qualitative) comparison of the contoured SSM/I SWE retrievals on each of the subbasin SWE maps (described above, and of which Figure 5 is an example) with the overlaid point values representing the in situ SWE measurements. This approach was chosen over a more quantitative comparison, such as correlating the in situ SWE measurements with the SSM/I SWE values at the closestEASE-Grid cells, because of the issue of relevance in comparing the SSM/I SWE value, which represents an areal average for the 25 km EASE-Grid cell, with an in situ SWE measurement that is essentially a point-based value. Instead a visual assessment based on examining all the in situ SWE values together in an area and comparing with the underlying SSM/I SWE contours was, in the view of the authors, a more useful comparison in this phase of the investigation. A summary of the SWE algorithm-evaluation results, based on the comparisons conducted between SSM/I-derived SWE and the in situ SWE values for the 1988–98 time period, is presented below for the Slave, Peace and Athabasca subbasins.
Slave subbasin
The Slave subbasin is characterized by ~25% coniferous-forest and ~50% mixed-forest land-cover types. Great Slave Lake is located in the middle of the subbasin. As shown in Figure 3, the in situ SWE data available for the Slave subbasin are concentrated north and south of Great Slave Lake, so validation of the SWE algorithm output was focused on these areas. Northeast of Great Slave Lake represents a forest-to-tundra transition zone where vegetation is of lower density. Overall, the SWE algorithms performed well in this area, with the SSM/I-derived SWE being within 10 mm of the in situ SWE data for five out of ten comparison cases and with-in 20 mm for an additional two cases (see Fig. 5 for an example of one of these cases). Of the remaining three cases, two were within 30 mm and one was within 40 mm or greater. South of Great Slave Lake, where the forest cover is generally denser, the SWE algorithms did not perform as well, and the SSM/I-derived SWE was generally lower than the in situ SWE data by at least 30 mm for three out of five comparison cases. In the other two cases, the underestimation was approximately 20 and 40 mm, respectively.
Peace subbasin
Assessment of the SSM/I-derived SWE for the Peace subbasin was concentrated in the eastern half of the subbasin, where the elevations are <1000m. The land cover in this part of the subbasin is characterized by ~33% coniferous forest and ~50%mixed forest. A pocket of agricultural land is located in the extreme south of the subbasin, as illustrated in Figure 2. In the areas of available in situ snow-cover data (see Fig. 3) the algorithms generally performed well, with the SSM/I-derived SWE approximately 10–20mm lower than the in situ SWE data for four out of the five comparison cases.
Athabasca sub-basin
Evaluation of the SWE algorithms for the Athabasca subbasin was concentrated in the southern part of the basin, where the in situ SWE measurements were available (see Fig. 3). This part of the subbasin is characterized by forest cover with ~50% coniferous and ~25% mixed forest. The performance of the SWE algorithms was generally favourable over this part of the Athabasca subbasin, with the SSM/I-derived SWE lower than the in situ SWE data by 10–20 mm for four out of six comparison cases. For the other two cases, the average difference between the two SWE datasets increased to 30 and 40 mm, respectively.
Summary of SWE algorithm performance
By limiting the evaluation of the SWE algorithms to the lower-elevation topography areas and focusing on areas where in situ snow-cover data were available, the performance of the SWE algorithms could only be assessed for less than half of the Mackenzie River basin. Although the SSM/I-derived SWE compared favourably with the in situ measurements in most areas (i.e. 16 out of 26 comparison cases where the SSM/I-derived SWE was within 20 mm of the in situ SWE data), there were significant underestimations observed in forested areas south and east of Great Slave Lake. There are a few potential reasons for these underestimations. First of all, the in situ SWE data are generally point measurements from snow courses that have been established to meet agency operational requirements. The sites in which the snow courses are located may not be representative of the 25 km gridcell for which the SSM/I SWE value is derived. Secondly, the landscape in this part of the Mackenzie River basin is dominated by many small lakes, which when frozen have a different microwave-emission characteristic than snow-covered land. In applying the four land-cover SWE algorithms to the MAGS region, the water land class is included in the open land-cover type to which the prairie SWE algorithm is applied (except for the large lakes in the basin, which are masked out). The inclusion of frozen lakes in the algorithm results may contribute to underestimations in derived SWE. Thirdly, the area south and east of Great Slave Lake is characterized by maximum SWE values generally greater than 100mm according to the available in situ SWE data. Based on analyses of SSM/I brightness temperatures (TB) and in situ SWE measurements in the taiga area of central Quebec in eastern Canada, Reference De Sève, Bernier, Fortin and WalkerDe Sève and others (1997) observed a negative relationship between TB and SWE as SWE increased to ~150 mm, andthen the relationship is inverted and becomes positive as SWE increases above 150 mm, with less contribution to the measured emission from the deeper snow layers. A similar threshold effect may occur in this area, contributing to the algorithm underestimations. Finally, the three forest SWE algorithms developed by CRB are simply based on forest type and do not currently take into account variations in forest density (with the exception of the sparse-forest algorithm). Incorporation of a forest-density factor may improve the performance of the forest algorithms in this area.
The remaining challenge for SWE algorithm validation in the Mackenzie River basin is the lack of in situ SWE data, which prevents a reliable validation effort in these areas. For example, the Bear subbasin, which is one of the largest subbasins, has only three snow-survey locations. The situation is similar for the Peel, although special snow surveys by MAGS researchers have been conducted in recent years at research basins in the northern tip of the Peel subbasin (e.g. Reference Marsh, Pomeroy, Pietroniro, Neumann and NelsonMarsh and others, 1997). Due to the lack of in situ SWE data, these two northern subbasins have remained unvalidated with respect to the SWE algorithm results at this point in time.
MAGS 1 March SWE Time Series (1988–98)
Snow cover plays an important role in both the energy and water cycles of the Mackenzie River basin, and understanding of the spatial and temporal variations in snow cover over the basin is key to achieving the overall objectives of MAGS, in particular, understanding and modelling of the energy and water cycles and their roles in the climate system. In order to contribute to this goal, a time series of SSM/I-derived SWE using the four land-cover algorithms was generated for 1 March of each year from 1988 to 1998. This date was chosen because it represents maximum SWE conditions for the winter season and there was a lower likelihood of occurrences of any snow melt–refreeze conditions before that point in the season, conditions which can create uncertainties in the SWE retrievals (Reference Goodison, Walker, Choudhury, Kerr, Njoku and PampaloniGoodison and Walker, 1995). Although the SWE algorithms had not been completely validated for the entire basin, it was felt that useful information on the spatial and temporal variations in SWE could be derived from such a time series.
Figure 6 presents the time series of SSM/I-derived SWE maps for 1 March of each year from 1988 to 1998. Each map depicts the derived SWE as colour contours in 10mm intervals of SWE, clearly indicating the spatial variability in SWE over the basin. The highest amounts of derived SWE (>90mm) are consistently located each year in a band running from the Peel subbasin, through Bear, Slave and the northern parts of the Peace and Athabasca subbasins. South and west of this band, the SWE values tend to decrease, although the low SWE along the western boundary of the basin is due to the effects of the mountain topography and represents a significant underestimation of the very high SWE that is typical of the mountains. The southern parts of the Peace and Athabasca subbasins have relatively lower SWE amounts as compared to the more northern parts of these subbasins.
Time series of SSM/I-derived SWE over the Mackenzie River basin for 1 March from 1988 to 1998.

Although the spatial pattern in SSM/I-derived SWE across the basin as described above is generally consistent from year to year throughout the time series, interannual variations in the overall amount of SWE in the high- and low-SWE areas can be observed. Abasin average of all the SSM/I-derived SWE values at the EASE-Grid cell locations over the basin was calculated for each 1 March in the time series to investigate temporal variability. Given the underestimation in SWE that is known for the mountain areas, these basin averages cannot be viewed as accurate representations of the true basin averages. Despite this limitation, they can still represent another perspective for evaluating relative temporal (interannual) variability. For the 1988–98 MAGS SSM/I SWE time series, the basin-average SWE values for 1 March range from 55 mm (in 1992) to 73 mm (in 1997). The degree to which this represents actual snow-cover temporal variations over the basin will be subject to further investigation.
Conclusions and Future Outlook
The prairie and forest passive-microwave SWE algorithms developed by the MSC/CRB for the boreal-forest and prairie environments of western Canada appear to perform well over the Mackenzie River basin for areas that can be validated with in situ SWE data. The time series of SSM/I-derived SWE for the Mackenzie basin for the 1988–98 time period provides useful insights into the spatial and temporal variations in snow cover and SWE over the basin. This represents an important contribution to MAGS and a key deliverable for Phase 1 of the study. In addition to the time series, SSM/I-derived SWE maps and basin averages have been generated for other MAGS investigators for use in comparisons with snow-cover outputs from hydrological and climate models that are being developed/enhanced and tested for the MAGS region. For example, a time series of SSM/I-derived SWE over the 1994/95 winter season (November–April) was generated for assessment of the snow water-equivalent output from the Canadian Regional Climate Model run for the 1994/95 water year (Reference Mackay, Stewart, Hogg, Walker, Caya and G.S.Mackay and others, 2000). The SSM/I-derived basin SWE averages over the winter compared very well with the RCM-generated basin SWE averages from the first MAGS RCM run, and highlighted problem areas in the model, such as spring melt occurring too early (personal communication from M.D.Mackay, 2000).
Phase 2 of MAGS was initiated in 2001, and the investigation and improvement of passive-microwave-derived snow-cover information over the MAGS region will continue. A major thrust during Phase 2 will be investigation of potential enhancements to SWE retrieval with the launch of the Advanced Microwave Scanning Radiometer (AMSR) on the NASA Earth Observing System (EOS) Aqua satellite, scheduled for launch in late 2001. The spatial resolution of the AMSR 36.5GHz channel will be 10 km, a definite improvement over the 25 km resolution of the SSM/I 37 GHz channel. With higher spatial resolution, the potential for SWE retrieval in complex topographic areas will be a specific area of interest. The higher spatial resolution may also reduce pixel heterogeneity in land cover and lead to improvements in SWE retrieval in areas with a variety of land-cover types.
Acknowledgements
The authors wish to acknowledge their other co-investigators in the MAGS snow-cover research investigation who have contributed over the years to the achievement of the research results presented in this paper, specifically B. E.
Goodison, J. R. Metcalfe, M. R. Davey and K. Goita. A special thank you goes to M. Davey for his preparation of the illustrations included in this paper.


