

Introduction
The transfer of terrestrial ice into the sea accounted for over half the 3.3±0.4 mm a–1 sea-level rise observed during 1993–2007 (Reference Cazenave and LlovelCazenave and Llovel, 2010). While the Greenland ice sheet is believed to have been in near balance under the pre-1990 climate, recent climate warming has resulted in an increasingly negative ice-sheet mass balance (Reference Rignot, Box, Burgess and HannaRignot and others, 2008). The Greenland ice sheet is now the single largest cryospheric source of sea-level rise. During 2000–11, the mass balance of Greenland land ice was –211±37 Gt a–1, equivalent to a contribution to sea-level rise of 0.58±0.10 mm a–1 (Reference ShepherdShepherd and others, 2012). Greenland ice loss is a consequence of both surface mass-balance processes, which increase meltwater runoff, and ice-dynamic processes, which increase iceberg discharge. While the surface mass balance and ice-dynamic components of recent Greenland ice loss were approximately equal over 2000–08 (Reference Van den BroekeVan den Broeke and others, 2009), the surface mass-balance component of Greenland ice loss appears to have outpaced the ice-dynamic component since about 2005 (Reference Enderlin, Howat, Jeong, Noh, Van Angelen and Van den BroekeEnderlin and others, 2014).
The transient glacier continuity equation describes mass balance (ṁ) as the sum of climatic surface mass balance (ḃ) and horizontal divergence of ice flow (or ice dynamics; ΔQ):
To assess the recent ice loss stemming from changes in either surface mass balance (Δḃ) or ice dynamics (Δ(∇Q)), contemporary observational period (‘obs’) values of ḃ and ▽ Q are differenced from analogous reference period (’ref’) values representative of near-equilibrium conditions:
The assumption of equilibrium mass balance during the 1961–90 reference period underpins canonical partitions of recent Greenland ice loss into surface mass-balance and ice-dynamic components (Reference Van den BroekeVan den Broeke and others, 2009; Reference Enderlin, Howat, Jeong, Noh, Van Angelen and Van den BroekeEnderlin and others, 2014). Within this framework, which explicitly assumes that ṁ ≈ 0 during the reference period, relatively small reference period imbalances can have relatively large implications on partitioning contemporary mass loss. For example, underestimating reference period mass balance subsequently underestimates ice loss since the reference period by an equivalent magnitude. An impetus therefore exists to constrain subtle reference period mass-balance signals for the purposes of accurately quantifying and partitioning contemporary ice-sheet mass loss.
We revisit the input–output mass-balance assessment of the high-elevation region of the Greenland ice sheet initially performed by the Program for Arctic Regional Climate Assessment (PARCA; Reference ThomasThomas and others, 2000, Reference Thomas2001). We combine this reassessed high-elevation mass balance with an analogous, fully independent input–output estimate (Reference AndersenAndersen and others, 2015) and assess a combined specific mass balance that infers subtle high-elevation mass gain during the reference period. While the ice-sheet area within the PARCA perimeter we consider accounts for only ~58% of the ice-sheet extent, this challenges the notion of equilibrium mass balance during the 1961–90 reference period. We posit that non-trivial long-term dynamic mass gain, associated with ongoing glacial–interglacial changes in ice-sheet geometry, should be considered in mass-balance partition as an independent term, distinct and opposite in sign from recent short-term dynamic mass loss.
Methodology
We adopt the high-elevation study area defined by PARCA, which approximately follows the 2000 m elevation of the Greenland ice sheet (Reference ThomasThomas and others, 2000, Reference Thomas2001). Following the input–output approach of Reference ThomasThomas and others (2001) for determining high-elevation mass balance, we difference ice outflow from the PARCA perimeter from surface mass balance (or net accumulation) integrated across the enclosed PARCA area. We subdivide the PARCA area into the eight major drainage basins delineated by Reference Zwally, Giovinetto, Beckley and SabaZwally and others (2012). Within each basin, we assess mass input, mass output and mass balance, and their associated uncertainties (Table 1). Mass input is characterized as mean annual surface mass balance during the 1961–90 reference climatology period. This is the period during which the ice sheet is conventionally believed to have been in near-equilibrium mass balance (Reference Van den BroekeVan den Broeke and others, 2009). Mass output is characterized using ~1995 ice velocities derived from repeated stake measurements made using precise GPS observations (Reference ThomasThomas and others, 2001). Under the assumption that ice velocity along the PARCA perimeter has not changed significantly since 1961 (Reference Joughin, Smith, Howat, Scambos and MoonJoughin and others, 2010), we take the mass-balance estimate we generate as representative of the 1961–90 reference period.
Mass balance in the eight major drainage basins within the PARCA perimeter during the 1961–90 reference period. We reassess mass output from each basin by combining PARCA and more recent observations. Mass input to each basin is estimated as the mean of an ice-core reconstruction (Reference BoxBox and others, 2013) and regional climate modelling (Reference FettweisFettweis and others, 2013). Values have been rounded to the nearest Gt a–1
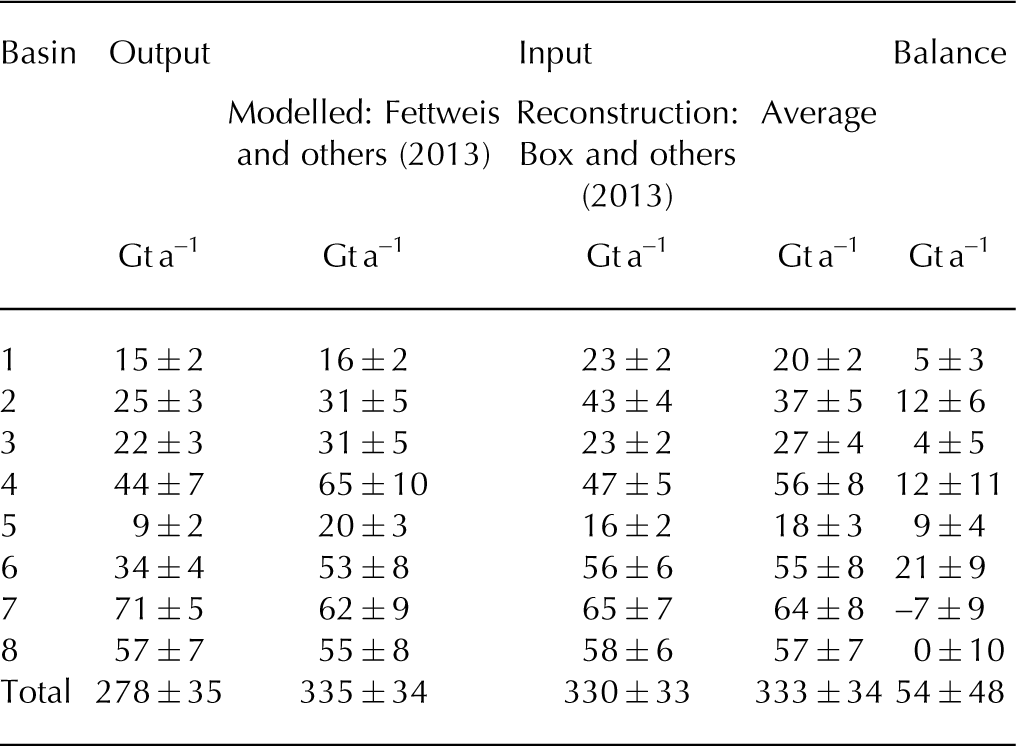
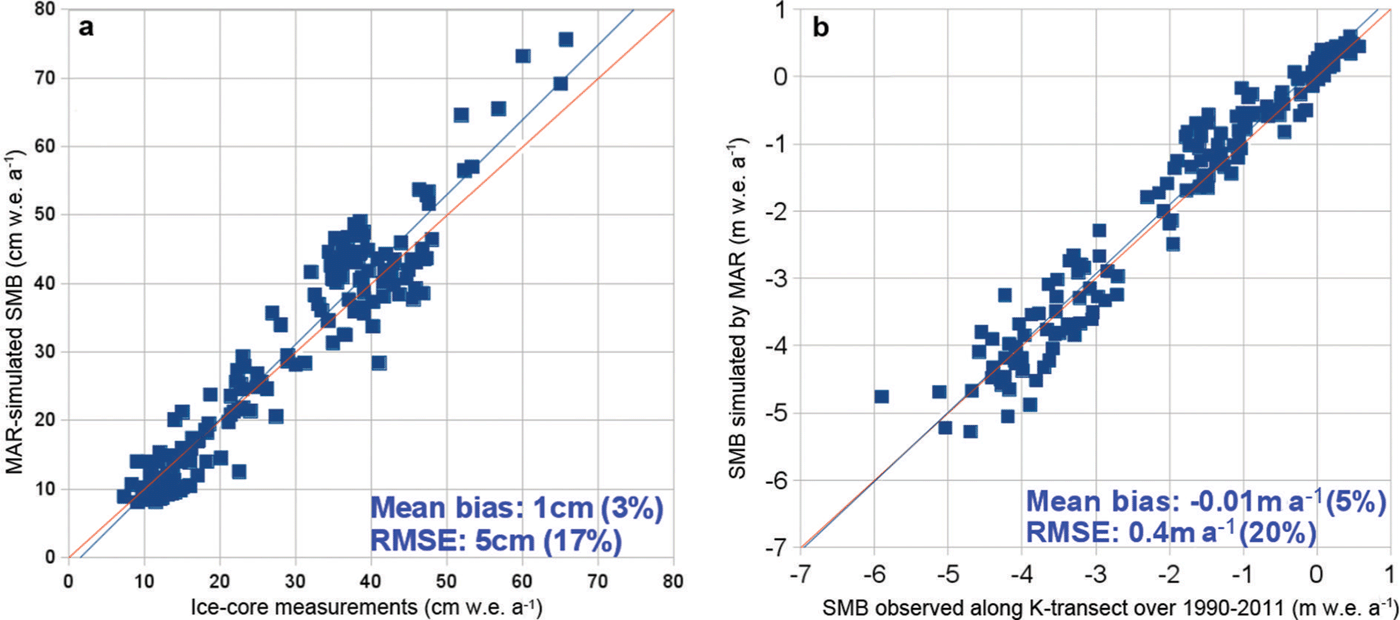
We estimate surface mass balance within the PARCA perimeter in two ways: via the regional climate model MAR (Modèle Atmosphérique Régional) (version 3; Reference FettweisFettweis and others, 2013) and via an ice-core-derived reconstruction (Reference BoxBox and others, 2013; Fig. 1). Following identification of an accumulation bias in MAR (version 2), which resulted in a root-mean-square error (RMSE) of 46% with in situ surface mass-balance observations above 1500 m elevation (Vernon and others, 2013), MARv3 has been tuned with 86 spatially distributed ice-core-derived accumulation records (Reference BoxBox and others, 2013). MARv3 now reproduces point surface mass-balance observations with an RMSE of ~20% and ice-sheet-wide net surface mass balance with an uncertainty of ~10% (Reference FettweisFettweis and others, 2013; Fig. 2). Thus, we take uncertainty in MARv3 surface mass balance as ±15% at basin scale. MARv3 was run at a resolution of 25 km and forced every 6 hours by ERA-40 (European Centre for Medium-Range Weather Forecasts (ECMWF) re-analysis) (1958–78) and ERA-Interim (1979–2013) re-analysis data at its boundaries, as well as 6 hourly sea surface temperature and sea-ice cover within its domain. MARv3 infers a mean reference period surface mass balance of 335±34 Gt a–1 within the PARCA perimeter (Table 1).
High-elevation surface mass balance during the 1961–90 reference climatology period simulated by MARv3 (a; Reference FettweisFettweis and others, 2013) and reconstructed from ice cores (b; Reference BoxBox and others, 2013), and the difference field (c). Observed ~1995 ice surface velocities of 161 flux gates shown around the PARCA perimeter. Numbers denote basins. Colour bars saturate at minimum and maximum values.

Evaluation of MARv3 modelled surface mass balance (SMB) versus long-term mean SMB observed at ice-core sites in the accumulation zone (a; Reference CogleyCogley, 2004; Reference BalesBales and others, 2009), and annual SMB observations at stake sites in the ablation zone along Kangerlussuaq transect (b; Reference Van de Wal, Boot, Smeets, Snellen, Van den Broeke and OerlemansVan de Wal and others, 2012).
Reference BoxBox and others (2013) reconstruct ice-sheet net accumulation from ice cores over the period 1600–2009. The spatial character of this reconstruction is obtained from calibrating the annual net accumulation time series of 86 ice cores to RACMO2 regional climate model output (Reference EttemaEttema and others, 2009; Fig. 1). This calibration results in reconstructed annual net accumulation fields that capture the spatial pattern of modelled accumulation fields, but are absolutely accurate at ice-core locations. In comparison to annual ice-core-derived net accumulation values, the reconstructed net accumulation fields have a residual non-systematic error of ~5%. We conservatively take uncertainty in reconstructed net accumulation to be 10% at both the basin and ice-sheet scales. Within the PARCA parameter, this reconstruction infers a mean reference period surface mass balance of 330±33 Gt a–1 (Table 1). We average the modelled (Reference FettweisFettweis and others, 2013) and reconstructed (Reference BoxBox and others, 2013) estimates of net accumulation, as well as uncertainty within each basin to derive an estimate of mass input to each basin. This yields a combined model/reconstruction input within the PARCA perimeter of 333±34 Gt a–1 during 1961–90.
We assess ice outflow from the PARCA perimeter using the ~1995 in situ ice surface velocity measurements and the protocol of Reference ThomasThomas and others (2001). We calculate ice outflow (Q in km3 a–1) at each of the 161 flux gates along the PARCA perimeter according to
where u is gate-averaged velocity (a mean of velocity observation at each side of the gate) β, is a dimensionless azimuth correction (ranging from 0 to 1) to isolate gateperpendicular velocity (from Reference ThomasThomas and others, 2001), f is the dimensionless ratio of surface ice velocity to depthaveraged ice velocity (from Reference ThomasThomas and others, 2001), W is gate width and H is ice thickness. We interpolate ice thickness and associated uncertainty at each PARCA stake from the recently compiled ice2sea ice thickness dataset (Reference BamberBamber and others, 2013). The ice thickness uncertainty analysis associated with this dataset marks a substantial improvement over that available to Reference ThomasThomas and others (2001) (Fig. 3). Around all the 161 PARCA gates used to assess net outflow, ice thicknesses interpolated from Reference BamberBamber and others (2013) are an average of 10 m greater than those used by Reference ThomasThomas and others (2001), likely due to improved resolution of the bed rather than a substantial increase in ice thickness between epochs. Unlike Reference ThomasThomas and others (2001), however, we do not neglect the ice flux from flux gates though which velocities are ‘reversed’, indicating net ice inflow from peripheral ice caps towards the ice-sheet interior. The inflow to the PARCA perimeter from these relatively low-velocity gates is equivalent to ~11±2Gta–1, composed of 1±0 and 9±1Gta–1 of inflow into basins 3 and 4, respectively, in East Greenland, and 1±0 Gt a–1 of inflow into basin 5 in South Greenland.
Difference in ice thickness around the PARCA perimeter between Reference ThomasThomas and others (2001) and this study, which employs ice2sea ice geometry (Reference BamberBamber and others, 2013). Numbers denote basins.
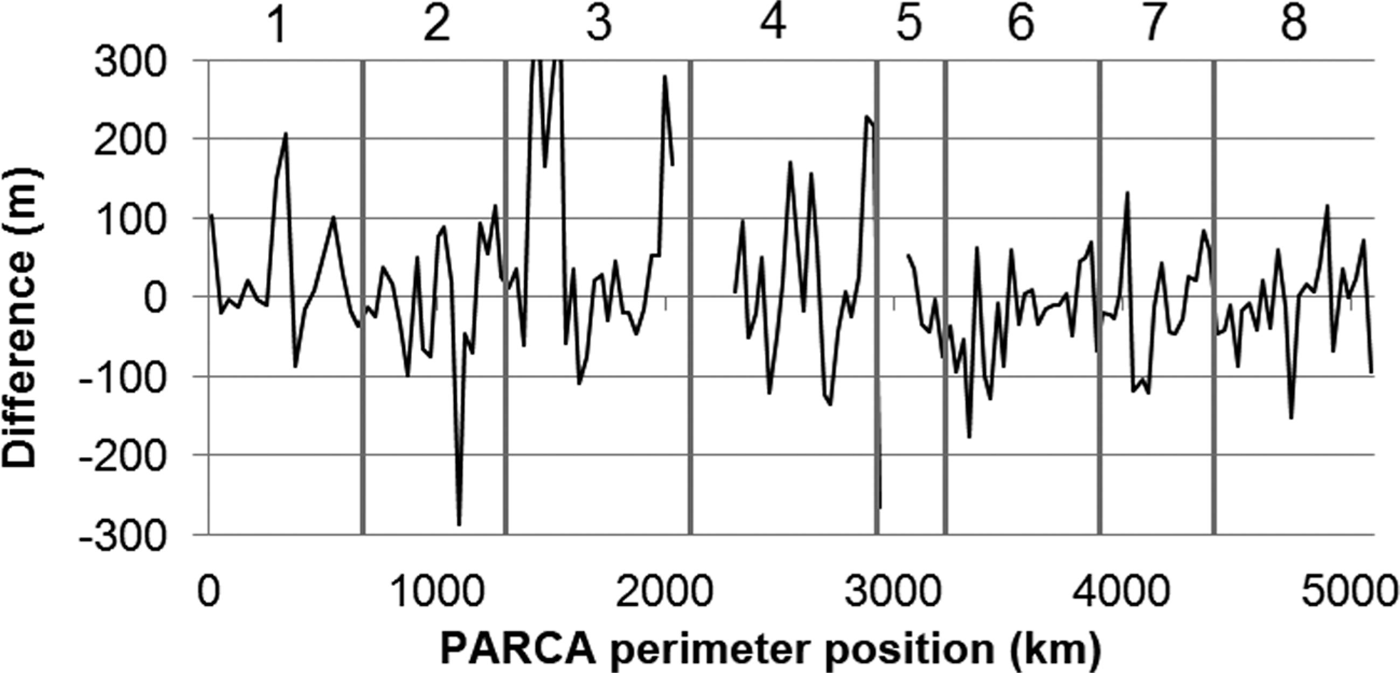
We arbitrarily take ±2 m a–1 as representative of the uncertainty in observed ice surface velocity at all PARCA stakes, which is reasonable for a multi-annual high-precision GPS survey. This uncertainty includes any potential biases stemming from intra- and interannual velocity variability, both of which are expected to be negligible above 2000 m (Reference DoyleDoyle and others, 2014). We take uncertainty in the ratio of surface ice velocity to depth-averaged ice velocity (f) as ±0.03, the standard deviation of all stake values assumed by Reference ThomasThomas and others (2001). We linearly interpolate the uncertainty in ice thickness at each PARCA stake from Reference BamberBamber and others (2013). The mean ice thickness uncertainty across all stake sites is ±154 m. We assume no uncertainty in the geometry-prescribed parameters of azimuth correction and gate width. We assume that the errors in each term used to calculate ice outflow from a given gate are independent and random, and can therefore be estimated as the quadratic sum of fractional uncertainties (Reference Colgan, Davis and SharpColgan and others, 2008). Within the PARCA perimeter, or a given basin, we sum the uncertainties of all gates to estimate total uncertainty in ice outflow. Given that the depth of porous firn (<80 m) is small relative to ice depth (~1500 m) along the PARCA perimeter, we convert volume outflow to mass outflow using a bulk glacier density of 910 kg m–3 (Reference HussHuss, 2013).
We combine our reassessed high-elevation mass balance with the analogous, fully independent, input–output estimate of Reference AndersenAndersen and others (2015) to better assess high-elevation reference period mass balance. Reference AndersenAndersen and others (2015) find a 1961–90 reference period high-elevation mass balance of 41±61 Gt a–1 using different ice-velocity, icethickness and surface mass-balance data from those that we employ. The Reference AndersenAndersen and others (2015) estimate, however, pertains to the high-elevation area encompassed by flight lines collected under the Programme for Monitoring the Greenland Ice Sheet (PROMICE; Reference Ahlstrøm, Bennike and HigginsAhlstrøm and others, 2008). This high-elevation perimeter approximately follows the 1600 m ice surface elevation contour, enclosing an area of 12.7 ×10⁵ km2 (Reference AndersenAndersen and others, 2015; Fig. 4). By contrast, the higher-elevation area defined by the PARCA perimeter that we employ encloses an area of only 9.8 ×10⁵ km2. Thus, these absolute estimates of high-elevation mass balance are not directly comparable. We therefore correct both mass-balance estimates by their respective area and combine the probability density functions (PDFs) of the resultant specific (i.e. per unit area) mass balances.
Delineations of the high-elevation region of the Greenland ice sheet used by various studies (Table 2) overlaid on the ice2sea digital elevation model (Reference BamberBamber and others, 2013).

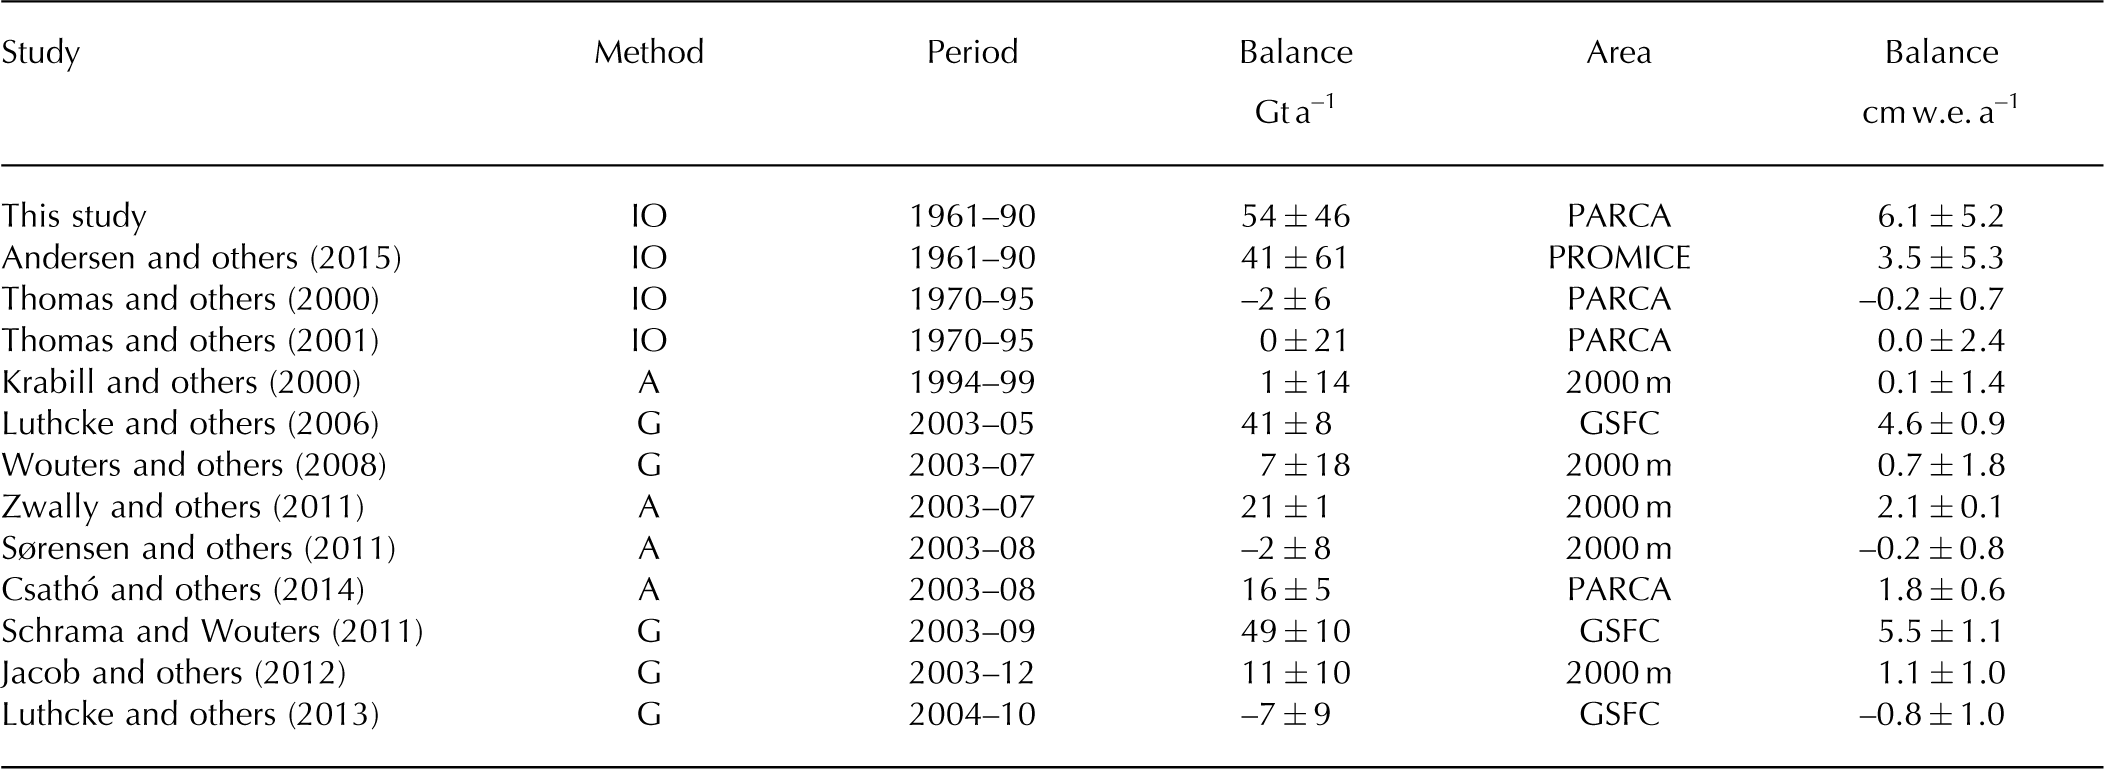
In addition to combining our revised input–output estimate with that of Reference AndersenAndersen and others (2015), we also place our revised estimate in the context of 11 previously published estimates of high-elevation mass balance. These elevation estimates differ in methodology, observational period and delineation of high-elevation area (Reference KrabillKrabill and others, 2000; Reference ThomasThomas and others, 2000, Reference Thomas2001; Reference LuthckeLuthcke and others, 2006, Reference Luthcke, Sabaka, Loomis, Arendt, McCarthy and Camp2013; Reference Wouters, Chambers and SchramaWouters and others, 2008; Reference Schrama and WoutersSchrama and Wouters, 2011; Reference SørensenSørensen and others, 2011; Reference ZwallyZwally and others, 2011; Reference Jacob, Wahr, Pfeffer and SwensonJacob and others, 2012; Reference CsathóCsathó and others, 2014; Fig. 4). Across these diverse approaches, we assume published uncertainties correspond to 1σ uncertainty, unless otherwise stated (Table 2). We are also forced to make some study-specific assumptions when converting published rates of thickness or volume change into equivalent rates of mass change (see Appendix). As the observational period varies widely between these studies, observed mass balance can be substantially influenced by surface mass-balance variability; changes in ice dynamics since 1961 are likely negligible at high elevations (Reference Joughin, Smith, Howat, Scambos and MoonJoughin and others, 2010). Thus, we cannot directly compare these more recent estimates with our reference period reassessment. An attempt to standardize diverse observational period mass balances to equivalent reference period mass balances using a surface mass-balance anomaly correction is problematic, because potentially spurious trends in modelled fields cannot be discounted with complete certainty (Reference Bromwich, Nicolas and MonaghanBromwich and others, 2011), and the amplitude of net accumulation variability in ice-core-derived reconstructions can be suppressed at annual timescales, especially in low-accumulation regions like the Greenland interior (Reference BoxBox and others, 2013).
Observed mass balance of the high-elevation area of the Greenland ice sheet as assessed by recent studies of differing methodology, temporal period and spatial extent, listed by observational period. ‘A’ denotes altimetry, ‘G’ denotes gravimetry and ‘IO’ denotes input–output. The area of each study is used to calculate specific mass balance (i.e. per unit area; Fig. 4)
Results
Across the high-elevation area enclosed by the PARCA perimeter, we assess a mean annual reference period surface mass balance (or mass input) of 334±34 Gt a–1 (Table 1). Reference ThomasThomas and others (2001) assess an analogous mass input of ~264 Gt a–1 over the 1970–95 period. The mass input estimated by combining the regional climate model MARv3 with an independent ice-core-derived reconstruction is 27% greater than the mass input inferred by Reference ThomasThomas and others (2001). MARv3 indicates that mean annual surface mass balance within the PARCA perimeter was ~5 Gt a–1 higher during 1970–95 compared with 1961– 90. The majority of the discrepancy between the original and revised mass input estimates therefore stems from interpolation of sparsely distributed net accumulation estimates available to Reference ThomasThomas and others (2001).
We assess a ~1995 mean annual ice outflow (or mass output) of 278±35 Gt a–1 from the PARCA perimeter. Reference ThomasThomas and others (2001) infer an analogous mass output estimate of ~264 Gt a–1, in balance with net accumulation, but also provide an alternative outflow estimate of ~288 Gt a–1 in online supplementary material. Thus, the ice outflow we assess is within the range assessed by Reference ThomasThomas and others (2000, Reference Thomas2001). Aside from differing ice thickness datasets, both our present estimate and that of Reference ThomasThomas and others (2000, Reference Thomas2001) employ identical data and methodology (Fig. 3). The only methodological difference is our inclusion of ten flux gates with a combined ‘reverse’ flow of ~11±2 Gt a–1 towards the ice-sheet interior in basins 3, 4 and 5. We contend it is important to include these flux gates for consistency, to ensure characterization of outflow from the PARCA perimeter is as accurate as possible.
Differencing our calculated mass output estimate from our combined model and reconstruction mass input estimate infers a mass balance of 54±46 Gt a–1 within the PARCA perimeter during the 1961–90 reference period. This high-elevation mass-balance estimate is significantly greater than the 0±21 Gt a–1 mass-balance estimate of Reference ThomasThomas and others (2001). This difference reflects almost entirely an increase in estimated mass input due to the use of more positive surface mass-balance data in our revised assessment in comparison with Reference ThomasThomas and others (2001). We again note that the fully independent modelled and reconstructed net accumulation fields closely agree in assessing a net accumulation of ~334 Gt a–1 within the PARCA perimeter during 1961–90. Of the eight major basins we examine, five appear to be gaining mass beyond uncertainty (basins 1, 2, 4, 5 and 6), and three appear to be within uncertainty of balance (i.e. 0 Gt a–1; basins 3, 7 and 8). No basins are losing mass beyond uncertainty (Table 1).
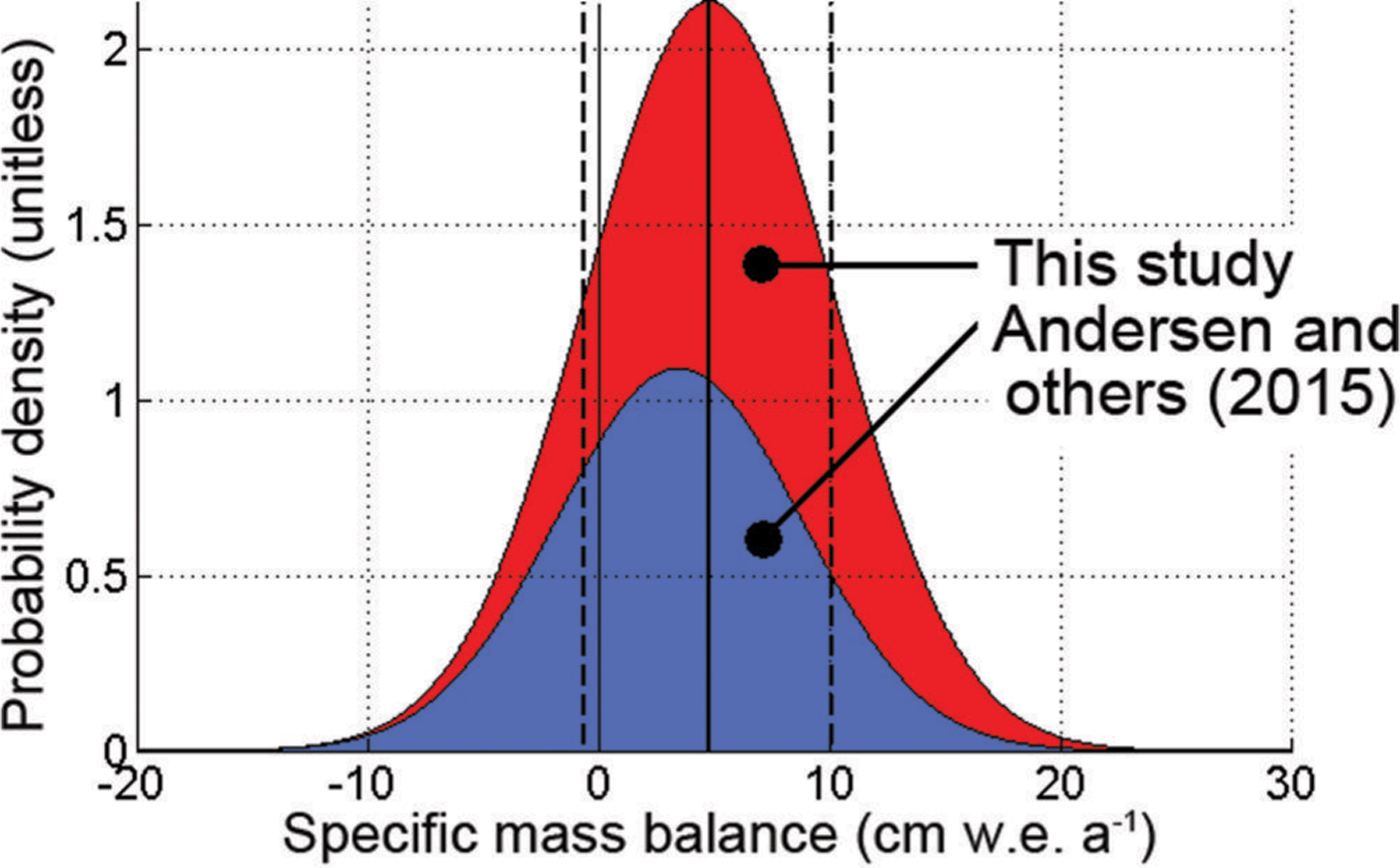
Combining the PDFs of the specific mass-balance estimate we present here (6.1±5.2 cm w.e. a–1) with that of Reference AndersenAndersen and others (2015; 3.5±5.3 cm w.e. a–1) yields a best estimate of reference period high-elevation specific mass balance of 4.8±5.4 cm w.e. a–1 (Fig. 5). The PDF associated with this combined estimate infers an 81% likelihood to the scenario that high-elevation specific mass balance was positive during the 1961–90 reference period (>0 cm w.e. a–1) and a 70% likelihood to the scenario that high-elevation specific mass balance exceeded 2 cm w.e. a–1 during the reference period. Distributed evenly across the 10.8 ×10⁵ km2 of ice sheet above the 2000 m elevation contour, a 2 cm w.e. a–1 rate of thickening is equivalent to 20 Gt a–1 of mass gain during the reference period.
Stacked PDFs of the input–output high-elevation mass balances of Reference AndersenAndersen and others (2015) and this study during the 1961–90 reference period. Vertical lines denote the cumulative mean (solid) and 1 standard deviation (dashed).
Of the 11 recent studies, of varying methodology and spatio-temporal extent, against which our reference period reassessment can be indirectly compared, five infer mass gain beyond uncertainty of zero (Reference LuthckeLuthcke and others, 2006; Reference Schrama and WoutersSchrama and Wouters, 2011; Reference ZwallyZwally and others, 2011; Reference Jacob, Wahr, Pfeffer and SwensonJacob and others, 2012; Reference CsathóCsathó and others, 2014), two infer mass gain within uncertainty of zero (Reference KrabillKrabill and others, 2000; Reference Wouters, Chambers and SchramaWouters and others, 2008) and three infer mass loss within uncertainty of zero (Reference ThomasThomas and others, 2000; Reference SørensenSørensen and others, 2011; Reference Luthcke, Sabaka, Loomis, Arendt, McCarthy and CampLuthcke and others, 2013). No study infers mass loss beyond uncertainty of zero (Table 2). The high-elevation specific mass-balance rate we assess here (6.1±5.2 cm w.e. a–1) is higher than all previous studies. While the two ‘post-PARCA’ input–output studies infer a mean specific mass balance of 4.8±5.4 cm w.e. a–1, the four altimetry studies and five gravimetry studies infer significantly lower mean specific balances of 1.0 ± 0.7 and 2.2±1.2 cm w.e. a–1, respectively. Thus, the magnitude of high-elevation mass balance appears to be dependent on assessment method. We note that altimetry and gravimetry approaches are compelled to explicitly account for any longer-term trends in ice-sheet elevation and mass, while such trends are implicitly accounted for in an input–output approach.
Discussion
Given that partitioning Greenland’s ice loss into surface mass balance and ice discharge components is predicated on differencing contemporary surface mass balance or ice discharge from corresponding reference period values (e.g. Reference Van den BroekeVan den Broeke and others, 2009; Reference Enderlin, Howat, Jeong, Noh, Van Angelen and Van den BroekeEnderlin and others, 2014), an underestimation of either component during the reference period results in a direct underestimation of the contemporary sea-level rise contribution of that component since the reference period. Acknowledging a subtle mass-balance trend is also important when assessing cumulative ice-sheet mass balance over centurial timescales (Reference Box and ColganBox and Colgan, 2013). While a reference period mass imbalance of ~20 Gt a–1 is relatively small in comparison with annual ice-sheet discharge or net surface mass balance (~500 Gt a–1), it is non-trivial in comparison with total contemporary mass loss from the ice sheet proper (~250 Gt a–1; Reference AndersenAndersen and others, 2015), and even less trivial in comparison with the contemporary mass loss from the ice sheet proper attributed to either surface mass balance or ice dynamics. It is therefore desirable to examine whether subtle reference period mass gain may be attributed to either surface mass balance or ice dynamics, in order to gain insight into whether the contemporary ice loss due to either of these components may be underestimated.
Attribution: surface mass balance
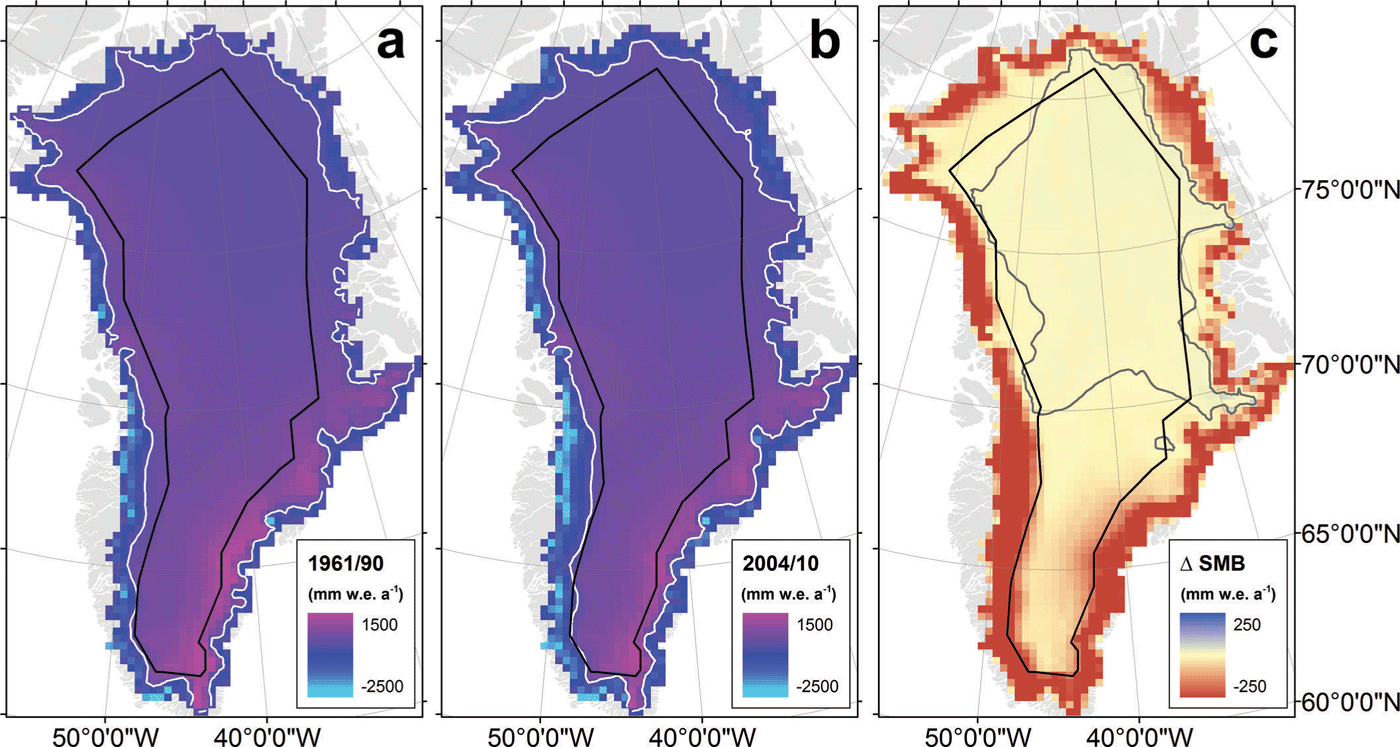
Surface mass balance is often assumed to have been in near-equilibrium with ice dynamics during the 1961–90 reference period (e.g. Reference Van den BroekeVan den Broeke and others, 2009; Reference Enderlin, Howat, Jeong, Noh, Van Angelen and Van den BroekeEnderlin and others, 2014), with contemporary high-elevation thickening of the ice sheet being attributed to increasing snowfall rates as a consequence of a warming climate (e.g. Reference ZwallyZwally, 1989; Reference LuthckeLuthcke and others, 2006). Regional climate modelling, however, does not confirm a recent increase in net accumulation across the high-elevation region of the Greenland ice sheet (Reference Vaughan and StockerVaughan and others, 2013). In contrast, while MARv3 estimates a mean annual surface mass balance of 335±34 Gt a–1 within the PARCA perimeter during the 1961–90 reference period, it assesses an equivalent value of 323±32 Gt a–1 during the 2004–10 study interval adopted by the Ice Mass Balance Inter-comparison Exercise (IMBIE; Reference ShepherdShepherd and others, 2012). This recent net decrease of ~12 Gt a–1 in high-elevation surface mass balance is composed of slight mass gain in North Greenland being more than offset by mass loss in South Greenland (Fig. 6). While the ERA-40 reanalysis data used to force MARv3 during the reference period are closely related to the ERA-Interim data used to force MARv3 during the IMBIE period, the two climatology datasets are not identical (Reference FettweisFettweis and others, 2013). These differences are most likely insignificant with respect to interannual variability (Fig. 7). We must, however, acknowledge that a portion of the recent change in high-elevation mass balance simulated by MARv3 may reflect subtly different climate forcing in either epoch, which may be due to spurious trends or shifts in forcing parameters (Reference Bromwich, Nicolas and MonaghanBromwich and others, 2011).
MARv3-derived Greenland ice sheet surface mass balance during the 1961–90 reference climatology period (a) and the 2004–10 IMBIE period (b), and the difference relative to the reference period (c). Black lines denote PARCA perimeter, and grey/white lines denote zero contour. Colour bars saturate at minimum and maximum values.
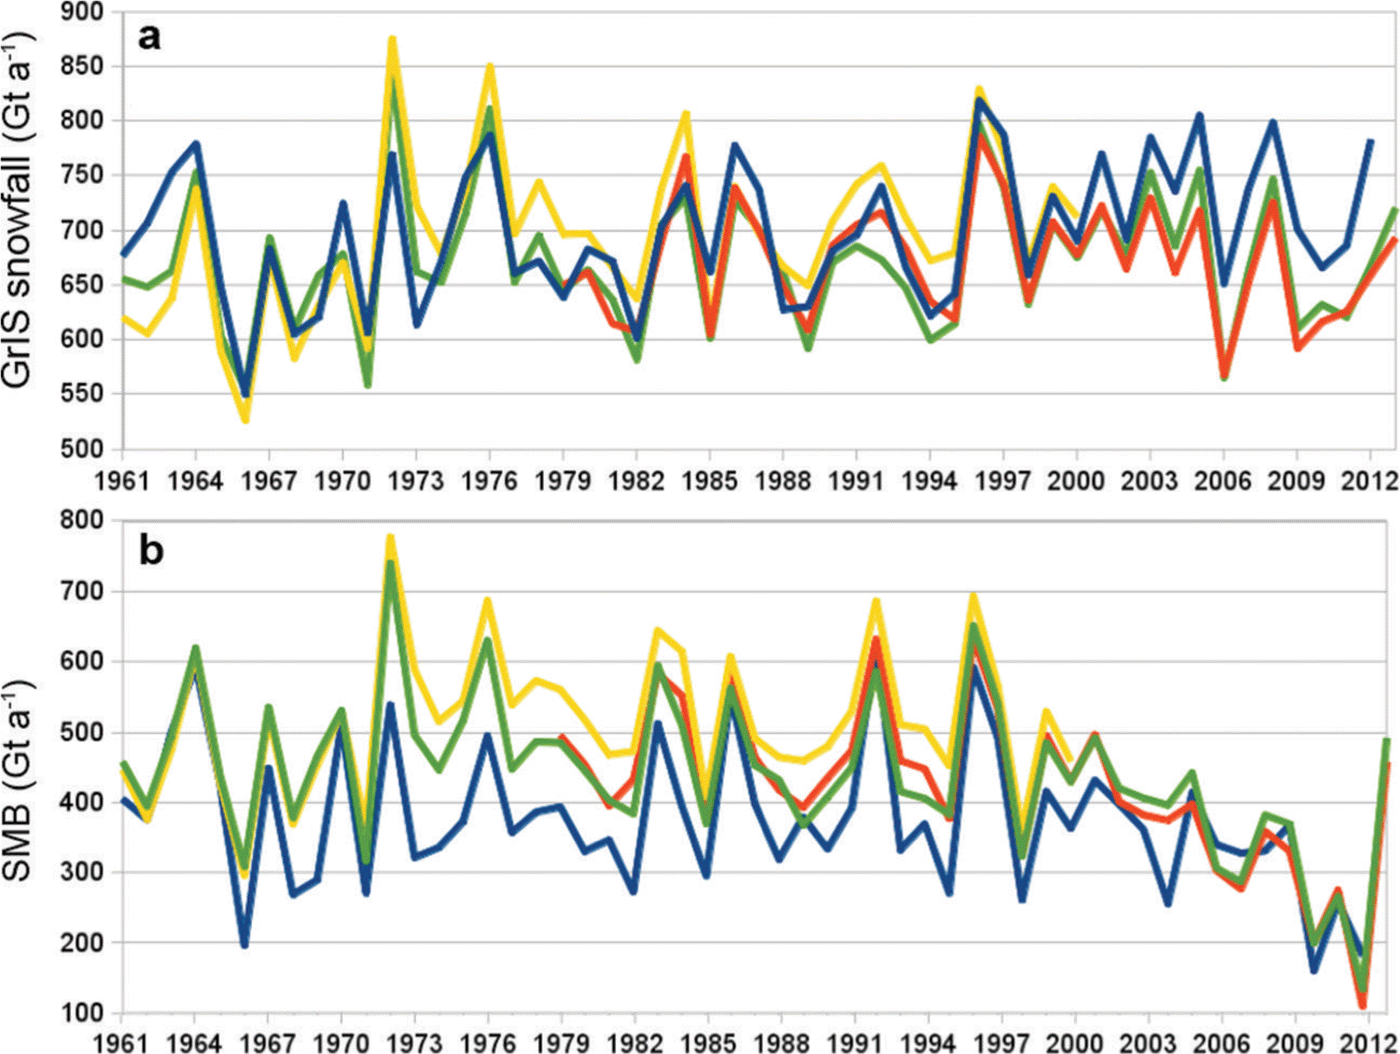
Greenland ice sheet total snowfall (a) and surface mass balance (b) over 1961–2012 simulated by the regional climate model MARv3 when forced by four different climate reanalysis products: ERA-40 re-analysis (yellow; Reference UppalaUppala and others, 2005), ERA-Interim re-analysis (orange; Reference DeeDee and others, 2011), Twentieth Century Re-analysis (blue; Reference CompoCompo and others, 2011) and NCEP/NCAR (US National Centers for Environmental Prediction/US National Center for Atmospheric Research) re-analysis (green; Reference KalnayKalnay and others, 1996).
Ice-core reconstructions can place surface mass-balance variability in a broader temporal perspective. The Reference BoxBox and others (2013) reconstruction of net accumulation from 86 spatially distributed ice-core-derived records suggests that mean reference period surface mass balance within the 2000 m contour was ~1% greater than the 1840–1999 mean (359±35 and 354±72 Gt a–1, respectively; Fig. 8). On a centurial timescale, an assessment of decadal accumulation rate in four North Greenland ice cores (B26, Century, NEEM and NGRIP) indicates that mean annual accumulation rate during 1960–89 was ~2% (or ~0.5 cm w.e. a–1) greater than the 1900–99 mean (Reference Buchardt, Clausen, Vinther and Dahl-JensenBuchardt and others, 2012; Fig. 9). On a millennial timescale, however, Greenland’s high-elevation net accumulation rate during the 20th century was ~2% less than the mean of the preceding ten centuries (Reference AndersenAndersen and others, 2006). Indeed, this latter statistical optimization of the common signal of five ice cores (Crete, Dye-3, GRIP, Milcent and NGRIP) suggests that any ‘distinct maxima’ of anomalously high accumulation rates appears to have occurred at ~1400.
The mean annual net accumulation of the 1961–90 reference period relative to the 1840–1999 reconstruction period of Reference BoxBox and others (2013).

Normalized Greenland high-elevation accumulation rate illustrating 1900–80 in the context of the past millennium (Reference AndersenAndersen and others, 2006) and 1960–89 in the context of the past century (Reference Buchardt, Clausen, Vinther and Dahl-JensenBuchardt and others, 2012).

If a high-elevation mass imbalance of ~20 Gt a–1 were solely attributable to surface mass-balance processes, this would infer a ~7% surplus in long-term net accumulation relative to the revised long-term ice discharge presented here (278±35 Gt a–1). As high-elevation net accumulation during the 1961–90 reference period appears to have been within 1 or 2% of the centurial mean and approximately equal to the millennial mean (Reference AndersenAndersen and others, 2006; Reference Buchardt, Clausen, Vinther and Dahl-JensenBuchardt and others, 2012; Reference BoxBox and others, 2013), the subtle high-elevation mass gain we infer is unlikely to stem from anomalously high surface mass balance during the reference climatology period. Simply put, this confirms that high-elevation surface mass balance was characteristic of long-term mean and was not anomalous during 1961–90. Thus, surface mass balance was not a primary driver of subtle reference period mass imbalance.
Attribution: ice dynamics
Given negligible variability in ice dynamics above 2000 m elevation since 1961 (Reference Joughin, Smith, Howat, Scambos and MoonJoughin and others, 2010), any high-elevation ice-dynamic mass gain must reflect longerterm (centurial or millennial) processes. There are theoretical (Reference ReehReeh, 1985) and numerical modelling (Reference HuybrechtsHuybrechts, 1994) suggestions that millennial-scale ice-sheet thickening is an anticipated result of the downward advection through the ice sheet of the transition between relatively ‘soft’ Wisconsin ice and relatively ‘hard’ Holocene ice. This hypothesis has been invoked to explain both point- and basin-scale in situ mass-balance observations of decadal-scale thickening in Greenland’s accumulation area (Reference ReehReeh and Gundestrup, 1985; Reference ThomasThomas and others, 2000). Potentially analogous long-term dynamic ice-cap thickening has been observed in the Canadian Arctic (Reference Colgan, Davis and SharpColgan and others, 2008).
Similar to Reference ThomasThomas and others (2000), our input–output assessment infers mass gain beyond uncertainty of zero balance in South Greenland basins 4, 5 and 6 (Table 1). The Wisconsin–Holocene transition is currently moving through the deepest portions of the ice sheet in South Greenland (~90% ice depth) compared with North Greenland (~60% ice depth; Reference HuybrechtsHuybrechts, 1994). As the majority of deformation occurs in the deepest 10% of the ice column, changes in deformation and consequently vertical flow and ice thickness theoretically are expected to be greater in South Greenland than North Greenland (Reference ThomasThomas and others, 2000). Transient changes in ice thickness due to ice dynamics are also expected to be greatest at flow divides, where ice flow is nearly vertical, and decrease with increasing ice surface slope until ice flow approaches surface-parallel at the equilibrium line and nearly horizontal at the ice margin (Fig. 10).
Schematic of anticipated accumulation area thickening and ablation area thinning due to decreasing ice outflow from time 1 to time 2. Arrows denote cross-sectional velocity azimuth, illustrating the dependence of ice-dynamic thickening on surface slope. After figure 3.1 in Hooke (2005).

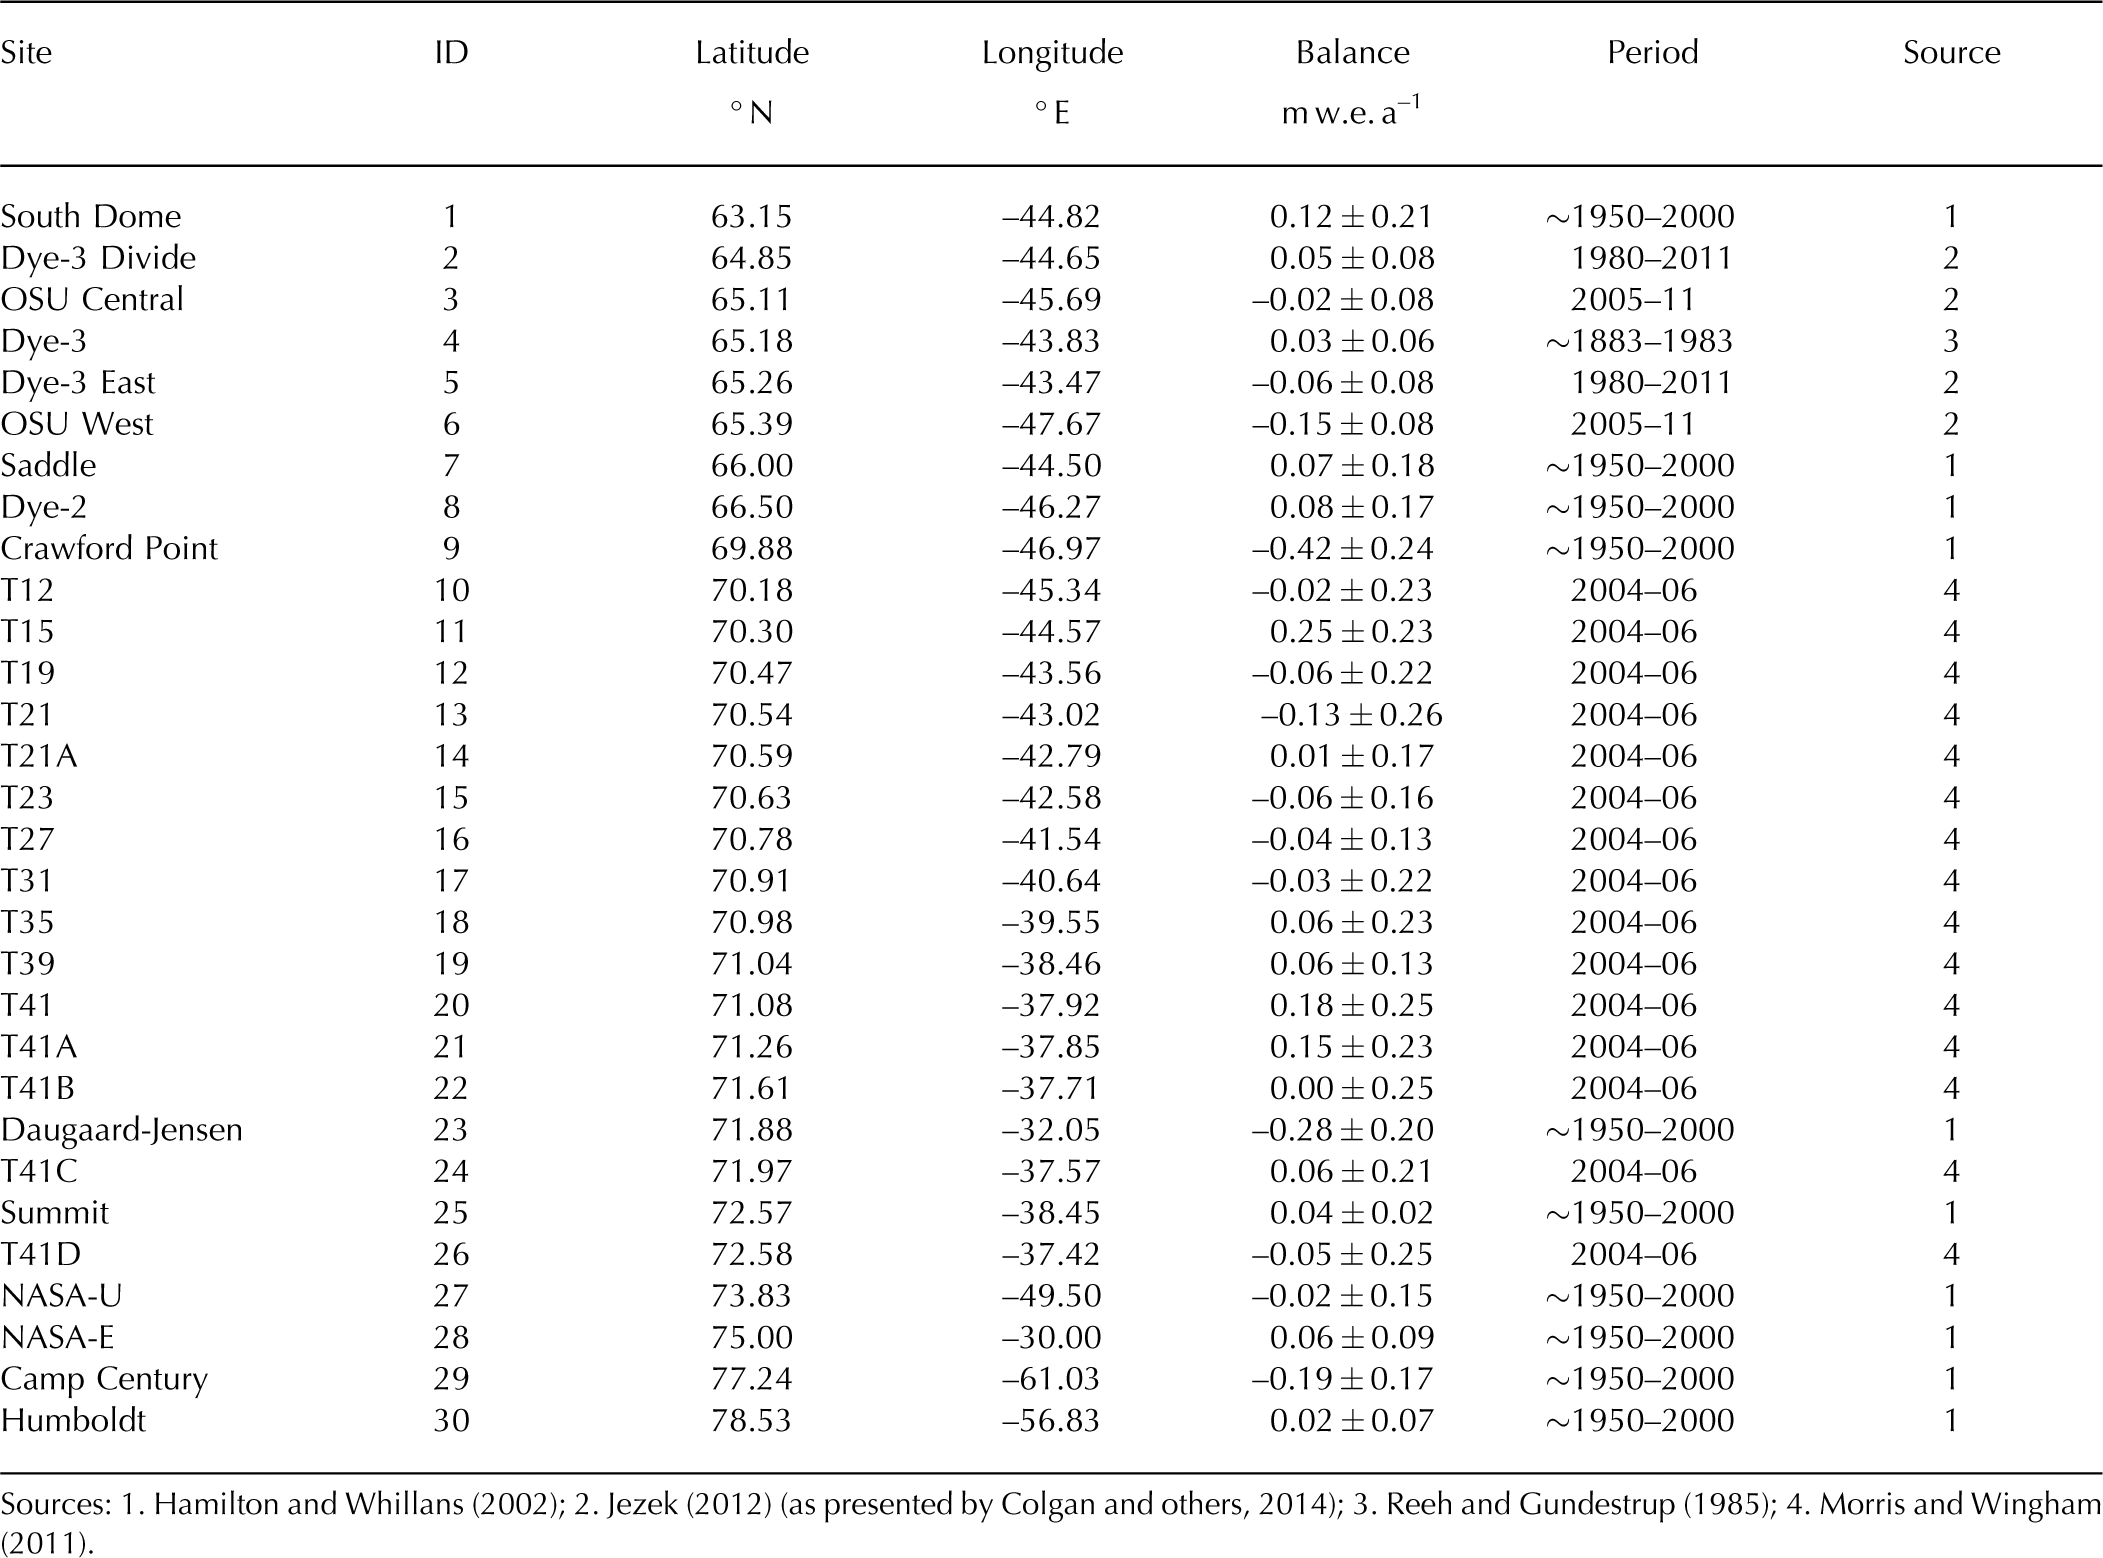
In an attempt to identify any potential ice-dynamic contribution to contemporary high-elevation mass gain, we compare 30 widely distributed in situ observations of mass balance with observed ice surface slope (Reference ReehReeh and Gundestrup, 1985; Reference Hamilton and WhillansHamilton and Whillans, 2002; Reference Morris and WinghamMorris and Wingham, 2011; Reference JezekJezek, 2012; Table 3; Fig. 11). Ice surface slope is derived from the ice2sea dataset (Reference BamberBamber and others, 2013). This comparison indicates that mass balance indeed decreases with increasing surface slope (p < 0.01; r = 0.57; degrees of freedom (d.f.) = 29; Fig. 12). This is consistent with transient thickening in response to velocity decreases stemming from transient increases in ice viscosity. In contrast, when the in situ mass-balance observations are compared with mean reference period surface mass balance derived from MARv3 (Reference FettweisFettweis and others, 2013), local mass balance does not appear to be significantly correlated with surface mass balance (p > 0.10; r = 0.04; d.f. = 29). This suggests that a fractional increase in net accumulation, such as that anticipated in response to a proportional increase in atmospheric moisture capacity, is not driving subtle mass gain (cf. Reference ZwallyZwally, 1989; Reference BoxBox and others, 2013).
Recent in situ mass-balance observations in the Greenland ice sheet accumulation area, listed by latitude
Locations of stations listed in Table 3. Black lines denote ice-sheet elevation contours spaced every 500 m beginning at 1000 m.

In situ mass balance (ṁ; Table 3) versus surface slope (α; a) and reference period surface mass balance (ḃ; b).

If a high-elevation mass imbalance of ~20 Gt a–1 were solely attributable to ice-dynamic processes, this would imply that the revised ice outflow estimate we present (278±35 Gt a–1) is in deficit by ~6% relative to an equilibrium flux of 308 Gt a–1. If distributed evenly over the 10.8 × 10⁵ km2 of ice-sheet area above 2000 m elevation, such a mass imbalance would represent ~2 cm w.e. a–1 thickening due to ice dynamics. Reference ReehReeh (1985) postulated that ongoing dynamic thickening, as a result of the downward advection of the Wisconsin–Holocene ice transition, was resulting in ice-sheet thickening ‘presently at a rate of about 1 cm a–1’ at Dye-3, Greenland. We suggest that millennial-scale ice dynamics are likely the primary driver of the subtle reference period high-elevation mass gain we observe because: (1) reference period accumulation rate appears to be characteristic of the millennial mean accumulation rate; and (2) in situ observations of mass balance appear to be dependent on slope rather than surface mass balance.
Summary: Implication for Mass Loss Partition
We have revisited the input–output estimate of high-elevation mass balance within the PARCA perimeter established by Reference ThomasThomas and others (2000, Reference Thomas2001). Using new ice thickness data, regional climate modelling and an ice-core-derived reconstruction, we assess a 1961–90 reference period mass balance within the PARCA perimeter of 54±48 Gt a–1. We have combined this estimate with an analogous input–output estimate of high-elevation mass balance that employs different velocity and ice thickness data, surface mass-balance forcing and high-elevation perimeter. Combining these fully independent estimates and their associated uncertainties yields a reference period high-elevation specific mass balance of 4.8±5.4 cm w.e. a–1. This specific mass balance is greater than all but one satellite-altimetry- or gravimetry-derived estimate published to date. The PDF associated with our combined input–output estimate infers an 81% likelihood to the scenario that high-elevation specific mass balance was positive during the 1961–90 reference period (>0 cm w.e. a–1) and a 70% likelihood that it was greater than 2 cm w.e. a–1.
It is difficult to conclusively attribute subtle reference period mass imbalance to either surface mass balance or ice-dynamic processes. However, given that (1) high-elevation surface mass balance during 1961–90 appears to have been characteristic of the long-term mean (within 1 or 2% of the centurial mean and approximately equal to the millennial mean) and (2) in situ mass-balance observations exhibit a distinct surface slope rather than surface mass-balance dependence, we suggest that millennial-scale ice dynamics are the primary driver of subtle reference period high-elevation mass gain. Evenly distributing ~20 Gt a–1 of mass gain across the >2000 m elevation area of the ice sheet yields a mean thickening rate (~2 cm w.e. a–1) that is consistent with theoretical expectations of the ongoing thickening associated with the downward advection of the Wisconsin–Holocene ice transition (Reference ReehReeh, 1985).
In order to explicitly acknowledge the role of millennial-scale ice dynamics when partitioning recent Greenland ice loss, we suggest that the transient glacier continuity equation may be conceptualized as containing both shorter-term (ST) and longer-term (LT) ice dynamics components:
where centurial- to millennial-scale dynamic mass changes occurring during the reference period are attributed to longer-term ice dynamics (∇QLT), and annual- to decadal-scale dynamic mass changes occurring since the reference period are attributed to shorter-term ice dynamics (∇QST).
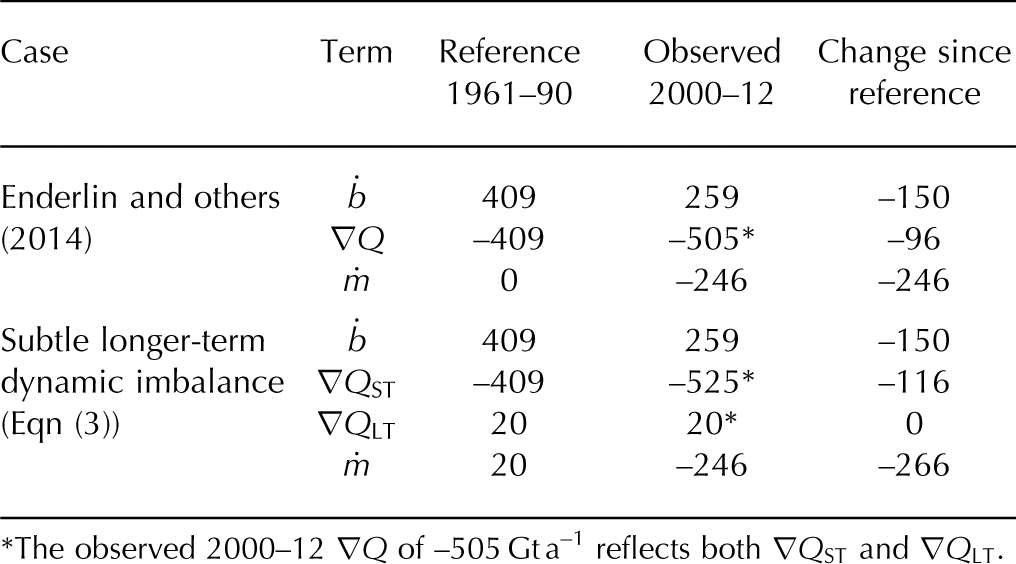
Failure to acknowledge a potential ~20 Gt a–1 reference period mass gain associated with longer-term ice dynamics would result in underestimating the recent Greenland ice loss due to shorter-term ice dynamics by ~17% (96 versus 116 Gt a–1), and recent total Greenland ice loss by ~7% (246 versus 266 Gt a–1; Table 4). Acknowledging a nontrivial longer-term ice-dynamic signal would imply that the surface mass-balance contribution to recent mass loss may have been only 1.3 times rather than 1.6 times greater than ice-dynamic mass loss during 2000–12 (Reference Enderlin, Howat, Jeong, Noh, Van Angelen and Van den BroekeEnderlin and others, 2014). Thus, even a relatively small mass imbalance of ~20 Gt a–1 during the reference period has large implications on partitioning recent ice loss in a framework that does not account for centurial- to millennial-scale ice-dynamic signals. Acknowledging such a subtle mass trend is also important when assessing cumulative ice-sheet mass balance over centurial timescales (Reference Box and ColganBox and Colgan, 2013).
Implication of reference period mass imbalance on partitioning recent mass loss (ṁ) into surface mass-balance (
Perhaps the overarching inference of our exploration of reference period imbalance is that the large uncertainty bounds associated with reference period high-elevation mass balance, coupled with the clear implication of neglecting subtle mass gain on partitioning recent Greenland ice loss, provide a strong impetus to seek better constraints on both the longer-term surface mass balance and ice-dynamic influences on high-elevation total mass balance. While the >2000 m elevation ice-sheet area we considered accounts for only ~58% of the extent of the Greenland ice sheet, most of the remaining ice-sheet area also resides within the accumulation area, where the downward advection of the Wisconsin–Holocene transition is also expected to contribute to millennial-scale thickening. Southwest Greenland, with primarily land-terminating ice, a relatively rich record of in situ surface mass-balance observations and the Wisconsin–Holocene ice transition at ~90% ice depth, may offer the best chance to observe and quantify difficult to constrain long-term thickening rates.
Acknowledgements
We thank two anonymous reviewers whose comments greatly improved both the rigour and interpretation of our assessment of Greenland’s high-elevation balance. We also thank Louise Sørensen for serving as our scientific editor. The work was funded by DFF FNU 11-115166, as well as the DANCEA Programme for Monitoring the Greenland Ice Sheet (PROMICE).
Appendix: Conversions and Assumptions
Reference KrabillKrabill and others (2000) estimate ‘1±>5 mm a–1 average thickening for the entire region above 2000 m’. We convert this thickening rate (dH/dt = 0.001 m a–1) into an equivalent mass gain of 1 Gt a–1 by assuming an area above the 2000 m contour of 10.8 × 10⁵ km2 and a bulk ice density of 910 kg m–3. We take 1 σ uncertainty in dH/dt as 0.010 m a–1, or twice ‘>5 mm a–1’, for an associated uncertainty of±14 Gt a–1.
Thomas and others (2000) conclude that ‘the almost 1 million km2 of the ice sheet within our area of study thinned by 2±7 mm a–1 during the past few decades’. We convert this thinning rate (dH/dt = –0.002 m a–1) with the survey area of 9.8 × 10⁵ km2 specified by Thomas and others (2001) and a bulk ice density of 910 kg m–3 into an equivalent mass loss of 2 Gt a–1. We take 1 σ uncertainty in dH/dt as 0.007 m a–1 or an associated uncertainty of ±6 Gt a–1.
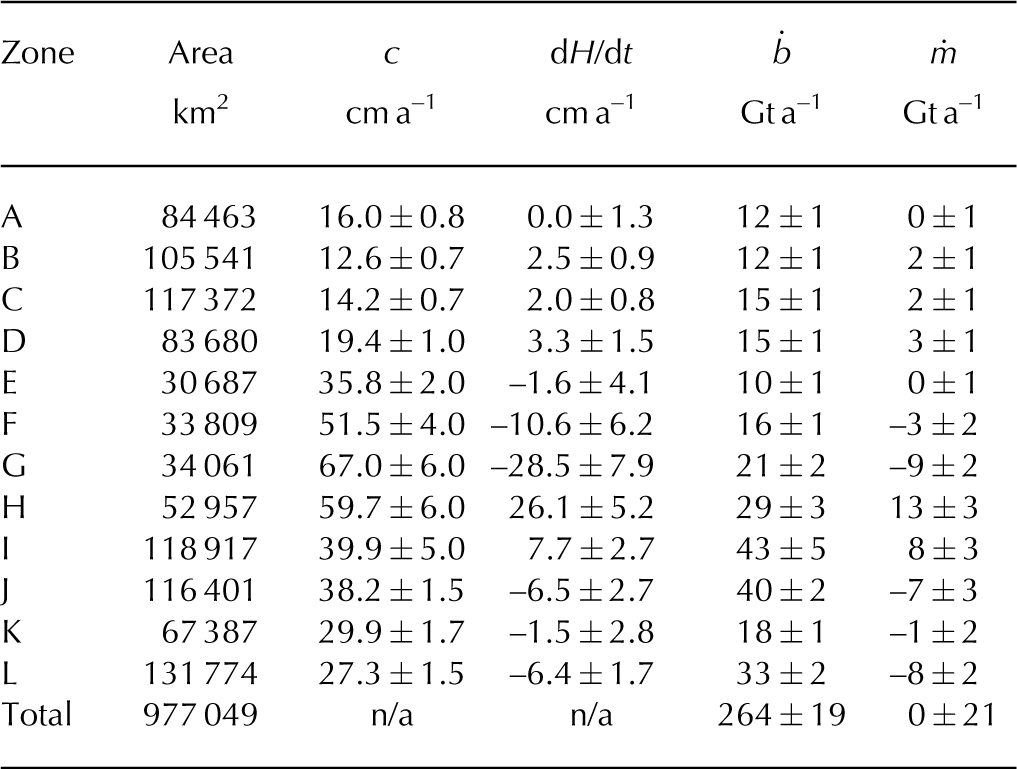
Thomas and others (2001) present mean thickening rate (dH/dt) and 1970 to ~1995 net accumulation rate (c) and their associated uncertainties in 12 zones of the high-elevation area of the Greenland ice sheet. We employ a bulk ice density of 910 kg m–3 and published zone areas to calculate mass gain or loss in each zone. We sum the surface mass balance and mass gain or loss with associated uncertainty in all zones to yield a high-elevation mass-balance estimate of 0±21 Gt a–1 (Table 5).
Conversion of the rate of accumulation (c) and rate of thickness change (dH/dt>) in Thomas and others (2001) into analogous zonal surface mass balance (ḃ) and mass balance (ṁ), and high-elevation totals
Reference SørensenSørensen and others (2011) present three volume-change to mass-change conversion methods. A personal communication from L. Sørensen (2014) advises that ‘[the authors] prefer the method M3 of the paper and applying the firn compaction’. We therefore take the –9 to +6 Gt a–1 sensitivity range of mass balance above 2000 m elevation of the M3 method with firn compaction as equivalent to a best estimate of –2 Gt a–1 with a 1σ uncertainty of ±8 Gt a–1 (where 8 Gt a–1 is half the –9 to +6 Gt a–1 sensitivity range).
For the estimate of Reference Jacob, Wahr, Pfeffer and SwensonJacob and others (2012), the mass balance of the ice sheet above 2000 m elevation was subsetted from an updated version of the dataset presented by Reference Jacob, Wahr, Pfeffer and SwensonJacob and others (2012) spanning April 2003–April 2012. High-elevation signal was isolated by removing a spherical harmonic representation of an independent (non-GRACE) estimate of ice-sheet mass balance, fitting mascons (massconcentration parcels) to the residual field and then adding back the independent estimate of ice-sheet mass balance (Reference KhanKhan and others, 2014). This two-step filtering process reduces the contamination of relatively low-magnitude interior mass gain by relatively high-magnitude peripheral mass loss.
For the estimate of Csathó and others (2014), the mass balance of the high-elevation region delineated by the PARCA perimeter was subsetted from the dataset presented by Csathó and others (2014).


