

Introduction
Vitamin D is essential for numerous metabolic functions in dogs and other species. Unlike man, dogs are unable to use ultraviolet rays to synthesise sufficient vitamin D in the skin to meet their requirement(Reference How, Hazewinkel and Mol1). Dogs rely on their diet to fulfil the vast majority of their vitamin D requirement. Vitamin D is most commonly known for its role in maintaining calcium and phosphorus homeostasis. Vitamin D also plays numerous key roles via receptors on target cells to modulate immune and cardiovascular function(Reference Sharp, Selting and Ringold2–Reference Cartwright, Gow and Milne4).
The best indicator of vitamin D status is plasma 25-hydroxyvitamin D (25(OH)D), which is the most abundant circulating metabolite of vitamin D(Reference Cartwright, Gow and Milne4). Adequate intake levels of vitamin D in dogs were recommended by the National Research Council (NRC), based on the amount required to prevent bone pathologies in growing puppies(5). These values have been extended to adult dogs. However, the vitamin D requirements for normal bone growth in puppies may be different from the concentrations required for optimal health and prevention of disease related to insufficiency in adult dogs.
The definition of vitamin D sufficiency in dogs has remained controversial. In man, levels of 25(OH)D from 20–50 ng/ml are required to prevent skeletal abnormalities(Reference Giustina, Adler and Binkley6). These levels are controversial due to inconsistent protocols for plasma 25(OH)D determination. Recently, a plasma 25-hydroxyvitamin D3 (25(OH)D3) level of 100–120 ng/ml was considered sufficient for dogs, based on the minimisation of variance of parathyroid hormone and mean C-reactive protein levels at this range(Reference Selting, Sharp and Ringold7). According to this data, many apparently healthy dogs may be vitamin D insufficient despite most commercial pet foods having adequate vitamin D levels(Reference Kritikos, Weidner and Atkinson8). Vitamin D insufficiency in dogs has been associated with a host of various disease processes(Reference Stocklin and Eggersdorfer3,Reference Selting, Sharp and Ringold7,Reference Gow, Else and Evans9–Reference Mick, Peng and Loftus13) . Whether insufficient vitamin D status is a consequence of disease, or risk factor for disease is presently under investigation. Several studies have indicated a correlation between low vitamin D status and disease, with insufficient vitamin D status corresponding to a poorer prognosis(Reference Selting, Sharp and Ringold7,Reference Jaffey, Backus and McDaniel14,Reference Titmarsh, Gow and Kilpatrick15) . To combat the potential for deficiency contributing to disease, appropriate supplementation is warranted.
Supplementation with excess vitamin D in the form of cholecalciferol (D3) did not improve plasma D status in privately owned dogs that were considered vitamin D insufficient(Reference Young and Backus16). However, supplementing 25(OH)D3 rapidly improved plasma D status in research dogs(Reference Young and Backus17). A similar improvement was found in healthy people, and in people with renal disease(Reference Bischoff-Ferrari, Dawson-Hughes and Stocklin18–Reference Heaney, Davies and Chen20).
The objective of the present study was to determine whether consumption of a diet using vitamin D supplemented as HyD®, a proprietary form of 25(OH)D3, would increase the plasma 25(OH)D3 of healthy dogs above that achievable with D3. Utilising one dog breed served to minimise observational variance from genetic heterogeneity. Golden Retrievers were chosen due to breed predisposition towards low vitamin D status(Reference Sharp, Selting and Ringold2), as well as their predisposition to developing various neoplastic diseases and other diseases associated with vitamin D insufficiency(Reference Sharp, Selting and Ringold2,Reference Selting, Sharp and Ringold7,Reference Schiffman and Breen21) . Among dog breeds, Golden Retrievers have a high lifetime risk for the development of cancers(Reference Torres de la Riva, Hart and Farver22). This makes them an ideal subject for a study evaluating the improvement of insufficient vitamin D. We hypothesised that supplementation with vitamin D in the form of 25(OH)D3 would rapidly and safely increase plasma 25(OH)D3 and thereby sustain an elevation in vitamin D status. We also hypothesised that the plasma 25(OH)D3 of dogs fed a diet supplemented with a high but not excessive amount of vitamin D3 would not significantly increase.
Experimental methods
Part I
Animals
All procedures were reviewed and approved by the institutional animal care and use committee (Protocol #8908). Canine participants were recruited at a breed club show (Golden Retriever National Event, St. Louis, Missouri) and an announcement through an e-mail list-serve. A total of fifty-seven privately owned, adult dogs aged 2–10 years were recruited. Dogs were excluded if they were younger than 2 years or older than 10 years, if they had underlying disease processes, were pregnant, lactating, or had pregnancy planned during the trial duration. Dogs were also excluded if they were receiving vitamins or supplements that could impact vitamin D status. Signed informed consent forms were obtained from owners prior to dog evaluation and blood collection. This form relayed the purpose and expected outcomes of the study, and potential risks to the patient. Owners were informed of the potential for their dog to be enrolled in the second part of the study, pending vitamin D status.
Evaluation and sample collection
All dogs sampled were purebred Golden Retrievers (thirty-three males, twenty-four females). Body weights ranged from 23⋅5 to 40⋅1 kg. All weights were evaluated on a single scale. Approximately 6 ml of venous blood was obtained from each dog via jugular or cephalic venipuncture. Blood was immediately transferred to a lithium heparinised tube and spun down in a centrifuge at 1200 g for 10 min within 30 min of collection. Plasma was harvested and stored in a separate plastic snap-cap tube in a −20°C freezer until evaluation. Plasma 25(OH)D3 status of each animal was evaluated using a high-performance liquid chromatography (HPLC) method(Reference Lensmeyer, Wiebe and Binkley23) that was adapted for analysis of dog serum and plasma(Reference Young and Backus16,Reference Young and Backus17) .
Part II
Animals
Owners of dogs determined to have plasma 25(OH)D3 concentrations less than 50 ng/ml were notified by phone or e-mail and offered participation in the second part of the study: a diet supplementation trial to evaluate the efficacy of vitamin D supplementation using a custom-manufactured, dry-expanded diet (Table 1). Owners of dogs with the lowest vitamin D status were contacted first, due to the association between vitamin D insufficiency and reduced odds of survival(Reference Jaffey, Backus and McDaniel14,Reference Cazzolli, Prittie and Fox24) .
Target and measured as-fed proximate nutrient contents and concentrations of calcium, phosphorus, D vitamers and metabolisable energy of trial dietsa

nd, Not determined.
a Diet ingredients listed by weight, as is, in decreasing order: Chicken by-product meal, maize gluten meal, dried egg product, brewers rice, maize, chicken fat, wheat, natural flavour, sorghum, dried plain beet pulp, potassium chloride, salt, dicalcium phosphate, pea fibre, calcium carbonate, vitamin E supplement, niacin supplement, thiamine mononitrate, calcium pantothenate, vitamin A supplement, mineral oil, pyridoxine hydrochloride, riboflavin supplement, vitamin D3 supplement, vitamin B12 supplement, folic acid, biotin, tocopherols, ferrous sulphate, zinc oxide, manganese oxide, copper sulphate, sodium selenite, cobalt carbonate, ethylenediamine dihydriodide, taurine, choline chloride.
b Weight (g)/diet weight (100 g).
Reviews of medical and dietary history of all participants were conducted to ensure that participating dogs were healthy. Complete diet histories were requested of all participants. Clinical laboratory variables (complete blood count and routine biochemical analyses of plasma and urine) were evaluated prior to participation. Physical examinations were conducted by primary veterinarians to ensure that canine participants were healthy prior to study commencement. Instructions were provided to owners of participating dogs to avoid alterations in the environment and exercise schedule during the supplementation trial.
Groups
Dogs were assigned to a control (n 9 initial, n 8 completion) or treatment group (n 10), stratified based on initial plasma 25(OH)D3 status. Groups were balanced based on plasma 25(OH)D3 concentration, sex, body weight and group size as much as possible (Table 2). Dogs belonging to the same household were assigned to the same group. Owners were blinded as to which group their dogs were assigned.
Characteristics and vitamin D status of dogs enrolled in the control (D3) and treatment (HyD®) groups at the beginning of the diet supplementation trial
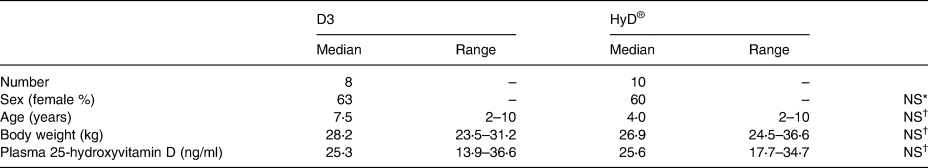
P ≤ 0⋅05 is considered significant.
* Not significantly different by χ 2 analysis.
† Not significantly different by Kruskal–Wallis test.
Diet
Once groups were assigned, all dogs received one of two diets formulated in compliance with AAFCO dog food nutrient profiles for adult maintenance except for vitamin D3 (Table 1). The control diet provided vitamin D as D3 and the treatment diet provided vitamin D as 25(OH)D3 (HyD®, DSM Nutritional Products, LLC, New Jersey 07054). Proximate analysis of a random sample of treatment and control diets was performed at an external laboratory (University of Missouri Agricultural Experiment Station Chemical Laboratories). Owners of participating dogs were provided feeding instructions so that dogs consumed the test diet at the caloric equivalence of their historic diet to maintain their body weight. Dogs were transitioned to their new diet over a 7-d period.
Plasma collection
Canine participant owners and veterinary clinics listed by the owners were e-mailed instructions on monthly appointments for blood collection. Blood samples were collected by the author (R. K.) or by the participant's primary veterinary clinic, depending on dog location. Samples were centrifuged and plasma was harvested within 1 h of sample collection. Plasma was shipped overnight on ice packs to the university. Upon arrival, plasma was placed in an airtight, freezer-resistant plastic tube and stored for a maximum of 4 months at −20°C for batch analysis of plasma 25(OH)D3 concentrations. Tubes were labelled so that the identity of the sample was not revealed to the personnel measuring plasma 25(OH)D3. Blood collections were repeated at weeks 4, 8 and 16 for assessment vitamin D status from plasma 25(OH)D3 concentrations. Plasma 25(OH)D3 analysis was repeated on all plasma samples at completion of the study to reduce inter-assay variance. Upon completion of the trial, at week 16, all dogs had repeated clinical laboratory analysis of blood, plasma and urine.
Laboratory analyses
Clinical haematology (Sysmex XT-2000i; Sysmex America, Inc., Lincolnshire, IL), plasma biochemistry (Beckman AU480, Beckman Coulter, Inc., Brea, CA) and urinalyses (Clinitek Status, Siemens Medical Solutions USA, Inc., Malvern, PA) were performed at the University of Missouri Veterinary Medical Diagnostic Laboratory, Columbia, MO. The same analysers were used for all samples. Plasma 25(OH)D3 of each animal was evaluated monthly and batch-evaluated at the end of the experiment to minimise variability using the chromatographic method as described earlier.
Statistical analysis
Sample size power analyses were performed to determine the number of dogs required in a parallel study to demonstrate the treatment effect. The power analysis assumed a standard deviation of plasma 25(OH)D3 between dogs to be 14 ng/ml. The analysis indicated that a minimum of 46 % difference in mean plasma 25(OH)D3 concentration between groups, seven dogs would be required to find significance at α = 0⋅05 with the power of β = 0⋅8.
Statistical analyses were performed using statistical software (SAS® Version 9⋅4; SAS Institute, Cary, NC). Data were tested for normality using skew and kurtosis measures, and visual inspection of plots. Non-normally distributed data was log-transformed. Normally distributed biochemical and haematologic observations were analysed with paired t tests. Non-normally distributed data and categorical results were evaluated using Wilcoxon rank-sign testing. A repeated-measures, mixed models ANOVA that employed Tukey–Kramer adjusted post hoc multiple comparisons were used to determine the significance of differences between treatment group outcomes at each blood sampling time, i.e. initial and at 1, 2, 3 and 4 months after the D-vitamer supplementations. Urine calcium/creatinine and urine phosphorus/creatinine ratios were evaluated using paired t tests. The significance of D-vitamer supplementation type on frequencies of categorical urinalysis findings was determined with Fisher's exact tests. P-values ≤ 0⋅05 were considered significant.
Results
Initial survey
In the initial cohort of fifty-seven dogs, plasma 25(OH)D3 concentrations ranged from 14 to 59 ng/ml. Fifty-three dogs (91⋅4 %) had 25(OH)D3 values below 50 ng/ml. Concentrations were normally distributed. Mean and median concentrations were 34 ng/ml. Twenty-six dogs (45 %) had 25(OH)D3 concentrations below 33 ng/ml.
Group parameters
Initial veterinary examinations indicated that all participants were healthy. Initial laboratory parameters evaluated on participants of part II were within the laboratory reference ranges, with few exceptions (Tables 3–5). Sex distribution, body weight, ages and plasma 25(OH)D3 concentrations of both groups were similar (Table 2).
Plasma clinical haematology variable medians and ranges of dogs before and 4 months after diet supplementation with vitamin D3 (n 8) or HyD® (n 10)
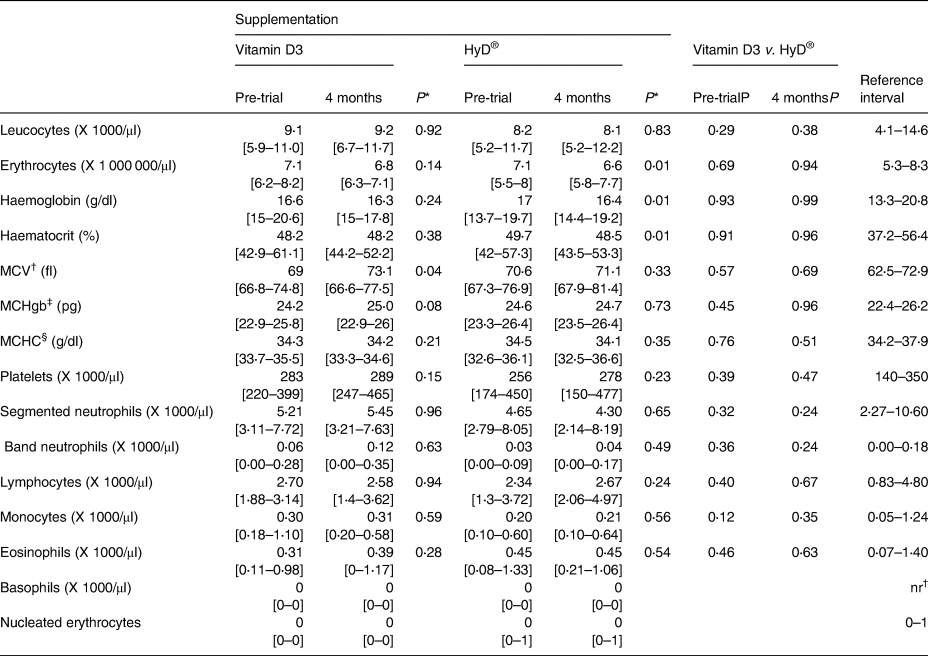
* P-values of comparisons between pre-trial and month 4 values.
† MCV, Mean Corpuscular volume.
‡ MCHgb, mean corpuscular haemoglobin.
§ MCHC, Mean Corpuscular Haemoglobin Concentration.
Plasma clinical chemistry variable medians and ranges of dogs before and 4 months after diet supplementation with vitamin D3 (n 8) or HyD® (n 10)

* P-values of comparisons between pre-trial and month 4 values.
† Alanine aminotransferase.
‡ Alkaline phosphatase.
§ γ-glutamyl transferase.
ǁ Creatine kinase.
Clinical laboratory urinalysis results of dogs before and 4 months after diet supplementation with vitamin D3 (n 8) or HyD® (n 10)

* Not determined because of lacking observation in one category.
† Ehrlich units.
‡ Leucocytes.
§ High-power field.
ǁ Erythrocytes.
¶ Low-power field.
a One dog with ‘many struvites and moderate calcium oxalate dehydrate’ which had very concentrated urine.
Laboratory values
Clinical haematology and biochemistry values and urinalyses parameters at the trial end were not significantly different between groups. There were a few significant differences between pre- and post-trial values within groups (Tables 3–5). At the trial end, the means of erythrocyte counts, haemoglobin concentrations and haematocrits of dogs of the HyD® group decreased (P < 0⋅01) slightly by 7, 4 and 2 %, respectively. The means of erythrocyte counts and haemoglobin concentrations of dogs of the vitamin D group by the trial end were also less (−4 and −2 %, respectively) but not significantly. No changes were indicative of adverse health effects and the majority of median values were within the reference interval. Cholesterol and plasma alanine aminotransferase (ALT) values of several dogs were elevated outside the reference interval but were not associated with clinical signs in the dogs.
Plasma 25(OH)D3 status
Plasma 25(OH)D3 did not differ between groups at the beginning of the study (Table 2). At Part II initiation, canine participants had plasma 25(OH)D3 levels between 13. 9 and 36⋅6 ng/ml. Dogs receiving diet supplemented with HyD® had an increase in plasma 25(OH)D3 from a mean of 24⋅4 ng/ml to a mean of 34⋅3 ng/ml (P < 0⋅05) after 1 month (Fig. 1). Plasma 25(OH)D3 concentrations did not significantly change after the initial increase. At the trial end, plasma 25(OH)D3 concentrations in dogs that received the HyD® diet were increased in all but one dog and ranged from a low of 24 ng/ml to a high of 47 ng/ml. The repeated-measures mixed-model ANOVA when applied with a contrast testing without including initial observations revealed a diet effect (P = 0⋅044). Mean plasma 25(OH)D3 concentrations for dogs (±sem) supplemented with HyD® was 33⋅3 (±3⋅0 ng/ml) which was 28 % greater than the mean 25(OH)D3 concentration of dogs supplemented with D3 (26⋅0 ± 1⋅5 ng/ml) (Table 6). For dogs given a diet supplemented with D3, no significant change occurred in plasma 25(OH)D3 concentrations. For these dogs, plasma 25(OH)D3 concentrations at the study end ranged from a low of 19 ng/ml to a high of 32 ng/ml.
Plasma 25(OH)D3 concentrations over time for control (D3) and treatment (HyD®) groups. All values are means ± sems. Log-transformed data of means of 25(OH)D3 concentrations were compared using repeated-measures ANOVA. Plotted values with different letters indicate significant differences (P < 0⋅05).

Statistical significance of effects of supplementation type (HyD® v. D3), time of sampling (month), and interaction of effects (HyD® v. D3 × month) on log-transformed plasma 25-hydroxyvitamin D3 concentrations (ng/ml)

a Baseline removed from values.
Adverse effects
There were rarely reported adverse events during the trial. Inappetence following antibiotic treatment of a urinary tract infection occurred in a dog that received the D3-supplemented diet. The dog was subsequently voluntarily withdrawn from the trial. An undesired change in coat colour and consistency was reported by an owner of a dog receiving diet supplemented with HyD®. This change resolved during the trial. Elevation of ALT concentration above the upper limit of the reference interval was revealed via serum biochemistry performed at the trial end in one dog fed the diet supplemented with HyD®. Follow-up biochemistry analysis of this dog showed a reduction of ALT to within the reference interval after 4 months post-trial. One owner reported improvement in stool quality while the dog was fed the D3-supplemented diet. No other notable responses were reported.
Discussion
We hypothesised that dogs fed a diet supplemented with 25(OH)D3 would experience a rapid improvement in vitamin D status. This effect was anticipated based on previous research in other species, coupled with findings of an acute rise in plasma 25(OH)D3 when purpose-bred dogs were fed treats supplemented with 25(OH)D3(Reference Young and Backus17,Reference Dusso, Lopez-Hilker and Rapp25) . In our study, an initial mixed-model ANOVA did not reveal any significant difference in plasma 25(OH)D3 between the dog groups. This result likely reflected the inclusion of 25(OH)D3 observations at time point ‘0’ in the analysis, during which the dogs had not yet received their assigned experimental diets. This was anticipated as the treatment groups were balanced based on preliminary plasma 25(OH)D3 concentration. A significant group effect was observed once the initial time point was omitted from the statistical analysis (Table 6).
An immediate effect of ingested 25(OH)D3 on plasma 25(OH)D3 was anticipated for several reasons. Absorption of D3 relative to 25(OH)D3 occurs more slowly, by passive diffusion, largely from intestinal micelles, and possibly through intestinal epithelial cholesterol transporter activity(Reference Silva and Furlanetto26). Sufficient amounts of luminal fat, intestinal lipase activity and bile acid concentration are required to form needed micelles. Absorbed D3, which principally enters intestinal lymph free or esterified and incorporated in lipoproteins or bound to plasma proteins, is then sequestered by the liver, adipose, and other tissues(Reference Fraser and Kodicek27–Reference Heaney, Armas and Shary29). From the liver, D3 is gradually released after 25-hydroxylation to 25(OH)D3. Comparatively, alimentary uptake of 25(OH)D3 is more rapid than that of D3 because it has greater water solubility and intestinal protein-binding capabilities(Reference Stamp30,Reference Teegarden, Nickel and Shi31) . Alimentary 25(OH)D3 enters circulation more directly relative to D3, first in portal blood then systemic circulation bound to plasma proteins(Reference Cesareo, Falchetti and Attanasio32).
Dogs do not respond to supplementation of D3 in high amounts to improve vitamin D status(Reference Young and Backus16,Reference Young and Backus17) . Furthermore, dogs and man with liver or gastrointestinal disease have been found insufficient in vitamin D and may have impairments in vitamin D metabolism that could lower their D status(Reference Gow, Else and Evans9,Reference Allenspach, Rizzo and Jergens33,Reference Khan, Dar and Baba34) . For these patients, supplementation with 25(OH)D3 may be ideal, due to its increased bioavailability to counteract reduced vitamin D metabolism capabilities.
Another substantive finding was no significant change in plasma 25(OH)D3 concentration for the dogs consuming diet supplemented with D3. The D3 content of the experimental diet (approximately 1000 IU/Mcal, Table 1) was in excess of the current recommended maximum by AAFCO (750 IU/Mcal)(35). It is less than the prior maximum (1250 IU/Mcal), which several years ago was reduced to the current value to be in accord with NRC safe-upper-limit and FEDIAF Guidelines. The D3 concentration in the experimental diet was likely greater than that of diets dogs were consuming prior to the study, when time 0 plasma 25(OH)D3 concentrations were determined. Kritkos et al. conducted a survey of eighty-one commercially available dog foods and reported a median vitamin D content of 481 IU/Mcal, with no foods in excess of the current 750 IU/Mcal(Reference Kritikos, Weidner and Atkinson8). The D3 content of the experimental diet was comparatively high for dog foods, suggesting that the dogs maintained on the experimental diet were resistant to change in vitamin D status. Heaney et al. suggest that as liver 25-hydroxylases of man become saturated with the D3 substrate, the production of 25(OH)D3 by the liver becomes progressively less influenced by increasingly available D3(Reference Heaney, Armas and Shary29). Hence, resistance to change in vitamin D status with oral vitamin D supplementation should be expected if liver 25-hydroxylase activity is near maximal.
While circulating 25(OH)D3 concentration is a widely accepted indicator of vitamin D status for many species, specific concentrations of 25(OH)D3 that indicate vitamin D deficiency, insufficiency, sufficiency and excess are only tentatively agreed upon. An international consensus report on vitamin D status of man recently suggested that serum concentrations of 25(OH)D3 less than 12 ng/ml (30 nmol/l) indicate vitamin D deficiency, while concentrations between 20 ng/ml (50 nmol/l) and 50 ng/ml (125 nmol/l) indicate vitamin D sufficiency for skeletal health(Reference Giustina, Adler and Binkley6). Vitamin D status sufficient for skeletal health maybe insufficient for other health outcomes(Reference Holick36). For example, serum 25(OH)D3 concentrations between 30 and 40 ng/ml (75–100 nmol/l) may reduce colorectal cancer risk in man(Reference McCullough, Zoltick and Weinstein37). Threshold 25(OH)D3 concentrations and limits for extra-skeletal disease prevention and clinical interventions largely have not been established, although they are being investigated(Reference Giustina, Adler and Binkley6). Use of varying methods for analysis of 25(OH)D3 have impeded progress; a ‘gold standard’ methodology is not established. In general, chromatographic methods are less affected by the sample matrix and permit independent quantification D3 and D2 metabolites, and are therefore considered superior to immunoassays(Reference Binkley and Carter38).
Selting et al. used a competitive chemiluminescence immunoassay in their work and reported serum 25(OH)D3 concentrations of vitamin D sufficiency in dogs to be 100–120 ng/ml. Our 25(OH)D3 concentrations were lower than theirs. The concentration difference likely reflected assay methodological differences, more than vitamin D deficiency in our dogs. A comparison of results obtained for thirty-three dog serum samples by our HPLC method with the method used by Selting et al. indicates the competitive chemiluminescence immunoassay 25(OH)D3 values are on average greater by about 100 % (R. C. B., unpublished results). In using chromatographic methods similar to those used in our study, Horst and Littldike found 25(OH)D3 circulates in many domesticated species between 30 and 50 ng/ml(Reference Horst and Littledike39). Our analyses show 25(OH)D3 concentrations ranged from 14 to 59 ng/ml and had a median value of 34 ng/ml(Reference Horst and Littledike39). The aforementioned consensus regarding circulating 25(OH)D concentrations in man, if speculatively applied to our observations in dogs, indicates that many dogs that we evaluated in the present study, i.e. dogs with 25(OH)D3 concentrations less than 20 ng/ml, would be considered vitamin D ‘insufficient’.
Low initial plasma 25(OH)D3 concentrations in some dogs might have reflected low dietary vitamin D intake, although the vitamin D contents of diets historically consumed by the dogs were not determined. At the study end, two dogs that received a diet supplemented with D3 had plasma 25(OH)D3 concentrations just below 20 ng/ml. For these dogs, 25-hydroxylation of D3 to form 25(OH)D3 might have been limited. None of the dogs fed the diet supplemented with 25(OH)D3 had plasma 25(OH)D3 concentrations below 20 ng/ml by the study end. Low vitamin D status of individual dogs, lines of dogs within a breed or dogs of a breed in general as has been reported for immature Great Danes could be rooted in the variation of 25-hydroxylase activity. Liver and kidney microsomal and mitochondrial enzymes with 25-hydroxylase activity (CYP2R1, CYP3A4 and CYP27A) are believed to synthesise 25(OH)D3 from D3(Reference Tryfonidou, Holl and Vastenburg40,Reference Jolliffe, Walton and Griffiths41) . Some polymorphisms of genes encoding the hydroxylases have functional consequences involving vitamin D metabolism in man(Reference Duan, Xue and Ji42). Our findings on dietary 25(OH)D3 supplementation demonstrate a means to raise the vitamin D status of dogs that might have low vitamin D status despite consuming recommended amounts of D3. Besides circumvention of need for 25(OH)D3 synthesis (e.g. as with some liver disease), ingestion of 25(OH)D3 presents a means to correct vitamin D insufficiency resulting from malabsorption and/or maldigestion of fat that leads to low vitamin D status, as might occur in dogs with inflammatory bowel disease(Reference Gow, Else and Evans9,Reference Allenspach, Rizzo and Jergens33,Reference Khan, Dar and Baba34) .
The use of HyD® for supplementation was chosen for its demonstrated safety and effectiveness in livestock feeds. HyD® has been safely and effectively used in poultry feeds for more than 20 years as a vehicle for 25(OH)D3 supplementation. Dietary 25(OH)D3 in place of D3 improves early skeletal development and immune function in broiler chickens(Reference Litta43). Using HyD® in swine feeds has been described more recently. Benefits to skeletal health of sows are inferred from findings and greater birth weights of piglets are observed(Reference Weber, Witschi and Wenk44). The amount of 25(OH)D3 used in supplementation was much less than that of D3. Our results indicate that the potency of 25(OH)D3 in the HyD® supplement was more than five times that of D3 for the dietary matrix studied. A greater potency of 25(OH)D3 relative to D3 for raising plasma 25(OH)D3 concentration is consistent with prior work in dogs and dosage trials in other species(Reference Young and Backus17,Reference Cesareo, Falchetti and Attanasio32,Reference Litta43,Reference Vaes, Tieland and de Regt45,Reference Graeff-Armas, Bendik and Kunz46) .
The HyD® supplementation was well-tolerated in the present study. Clinical haematology and chemistry results were not significantly different with supplementation type; however, subsequent changes may have occurred with a longer study duration. Although significant changes from pre-trial values occurred for some variables, most changes were modest, within clinical laboratory reference intervals (Table 4), and not considered to affect the health of the dogs. The majority of haematologic values were within the reference range (Table 3), with the exception of mean corpuscular volume, which was not considered to be clinically significant. The modest declines in observed haemoglobin, haematocrit and erythrocytes might have reflected environmental exposures of the dogs. The trial was initiated during late fall and winter and concluded during spring and early summer. In captive wolves, declines from winter to summer are reported in haemoglobin, haematocrit, erythrocytes and mean corpuscular haemoglobin concentration(Reference Seal and Mech47). The mechanism is speculative but may involve endocrine factors like circulating thyroxine which is found to be greater in winter than in summer in wolves. Biochemical median values were all within reference ranges. Urinalyses were not significantly different, all of which indicated the safety of the diets used. Owners reported no signs of serious health effects. The cause for plasma alanine ALT elevation in one dog that received the HyD® diet is unknown. The elevation was not severe and corrected after the dietary change.
Limitations of the present study are important to note. Participants were supplemented for 4 months, and haematologic and biochemical values were not evaluated for most participants once the dogs were transitioned off of the study diet. It is possible that sequelae of vitamin D supplementation occurred following transition off of the study diet. This is less likely given the half-life of 25(OH)D3 appears to be 1⋅8 weeks in dogs(Reference Young and Backus17). Even though one breed of dog was used, significant inter-animal variation was sufficient to reduce the group effect, justifying the limitation to one breed. The dogs used in the study were healthy dogs. As previously stated, it is unclear whether vitamin D insufficiency is associated with disease development or contributes to it. Therefore, results may differ when using dogs with various disease processes. While the subjects in this trial were healthy, confirming that a consistent and safe rise in vitamin D status with HyD® supplementation in healthy dogs is an essential first step prior to supplementing patients with concurrent disease processes. Follow-up studies are essential to determine the efficacy of supplementation with HyD® in improving vitamin D status in individuals with disease processes associated with vitamin D insufficiency.
Acknowledgements
The authors would like to acknowledge Lada Micheas for her statistical assistance. The authors would also like to acknowledge the assistance of the Golden Retriever National Club, Drs Mike Lappin, Shirley Chu, Sessaly Reich and Jeff Bryan for assistance in phlebotomy, and the canine participants, owners and their veterinarians.
This work was supported by the Nestlé Purina Endowed Program in Small Animal Nutrition, in addition to a grant provided by DSM Nutritional Products, LLC.
Funding was provided by DSM Nutritional Products, LLC. The company also provided the diets for the study.
R. A. K. was the co-investigator of the study, contributed to study design, processed and analysed the data and co-wrote the manuscript. R. C. B. was the principal investigator of the study, contributed to study design, processed and analysed the data and co-wrote the manuscript. S. Y. contributed to study design and reviewed the manuscript.


 Open access