

According to the WHO, nearly 350 million people worldwide have diabetes, of whom approximately 90 % have type 2 diabetes mellitus (T2DM) (1) . If poorly controlled, diabetes can result in serious complications such as CVD, nephropathy and retinopathy. Much epidemiological evidence suggests that people who drink coffee have a reduced risk of developing T2DM( Reference Odegaard, Pereira and Koh 2 – Reference Ding, Bhupathiraju and Chen 5 ). This has been demonstrated for both caffeinated and decaffeinated coffee (DC)( Reference Salazar-Martinez, Willett and Ascherio 6 , Reference Van Dam, Willett and Manson 7 ) and appears to be particularly strong for those who drink large quantities of coffee( Reference Van Dam and Feskens 8 , Reference Tuomilehto, Hu and Bidel 9 ); however it is not known precisely how coffee may exert this protective effect. Metabolic syndrome is a group of risk factors that are linked with the development of T2DM. Potential mechanisms where coffee drinking could reducethe risk of T2DM may be through its demonstrated effects on some of these factors. These include aiding weight loss by increasing energy expenditure and fat oxidation( Reference Dulloo, Geissler and Horton 10 – Reference Bakuradze, Boehm and Janzowski 12 ) and reducing energy intake( Reference Gavrieli, Karfopoulou and Kardatou 13 ), increasing HDL-cholesterolReference Kempf, Kolb and Gärtner (14) and increasing circulating adiponectin levels( Reference Ohnaka, Ikeda and Maki 15 , Reference Wedick, Brennan and Sun 16 ). Adiponectin levels have been shown to be inversely associated with insulin resistanceReference Yatagai, Nagasaka and Taniguchi (17) ; therefore, an increase in levels may result in improved insulin sensitivity, although this has not been found previously, perhaps due to short study durations.
Acute studies about the effects of coffee or caffeine on the postprandial glycaemic response have, however, generally shown a detrimental effect. Greater glucose and insulin AUC have been demonstrated following caffeine ingestion( Reference Robinson, Savani and Battram 18 , Reference Greenberg, Owen and Geliebter 19 ). Caffeinated coffee ingestion has also produced increased glucose responses compared with a control( Reference Beaudoin, Robinson and Graham 20 – Reference Krebs, Parry-Strong and Weatherall 22 ); however, the effect appears to be less pronounced than that produced by caffeine aloneReference Battram, Arthur and Weekes (23) . It has been suggested that bioactive components in coffee, other than caffeine, may be attenuating the documented acute negative effects of caffeine on glycaemia. Chlorogenic acids (CGA) and quinides have attracted attention as possible candidates with suggested mechanisms including delayed glucose absorption by the enterocyteReference Johnston, Clifford and Morgan (24) via dissipation of the Na+ gradient and consequent inhibition of the SGLT1 glucose transporterReference Welsch, Lachance and Wasserman (25) in addition to increased uptake of glucose in non-skeletal musclesReference Shearer, Farah and de Paulis (26) . Studies involving CGA on its ownReference Van Dijk, Olthof and Meeuse (27) and coffee enriched with CGAReference Thom (28) have both demonstrated a reduction in glucose response v. control. The varying results from coffee studies may be partially explained by the CGA content of the coffees used, as this can vary considerablyReference Crozier, Stalmach and Lean (29) . However, this cannot be verified as the majority of these studies did not measure CGA content. A limitation to previously published work is the relatively high dose of caffeine used, typically 3–6 mg caffeine/kg body weight( Reference Greenberg, Owen and Geliebter 19 , Reference Gavrieli, Yannakoulia and Fragopoulou 30 ), which equates to 210–420 mg for a 70 kg person. A Canadian studyReference Gilbert, Marshman and Schwieder (31) that analysed the caffeine content of various instant coffees, prepared to participants’ personal taste preferences, found a median caffeine concentration in the prepared coffees of 328 μg/ml (range 102–559 μg/ml). This median value would provide 85 mg caffeine in a standard-sized (260 ml) serving. Doses of 3–6 mg/kg would, therefore, potentially be equivalent to 2·5–5 standard-sized servings of instant coffee taken as a single dose for a 70 kg person and correspondingly higher for heavier individuals.
To our knowledge, there has been no study thus far investigating the glycaemic effects of a single serving of instant coffee as consumed in the UK. Instant coffee was chosen for this study because (i) it is the most commonly consumed type of coffee in the UK (32) and (ii) we wanted to ensure that the levels of the different coffee components were consistent between brews as other types of coffee have been shown to vary in their caffeine and CGA content( Reference Ludwig, Sanchez and Caemmerer 33 , Reference McCusker, Goldberger and Cone 34 ). In this pilot investigation, we aimed to perform a dose–response study in overweight individuals with the lowest dose set at a single serving of caffeinated coffee. In Part B of the study, CGA and other coffee components were increased step-wise, whereas the caffeine dose remained constant, to investigate the acute effects of fortification with these other coffee components.
Methods
Participants
Ten participants were recruited from the staff and student population of the University of Surrey. All of them were overweight (BMI>25 kg/m2) but otherwise healthy adult males aged 19–62 years who were regular coffee drinkers (>4 servings/week). All of them were non-smokers. Participants were required to have been weight stable for the previous 3 months and to have no history of heart disease, diabetes, liver disease or any gastrointestinal (GI) or endocrine disorders. This study was conducted according to the guidelines laid down in the Declaration of Helsinki, and all procedures involving human subjects were given a favourable ethical opinion by the University of Surrey Ethics Committee. Written informed consent was obtained from all the participants. The study was carried out between August 2012 and February 2013.
Study design
A randomised cross-over design was used to investigate the glycaemic effect of three different doses of DC, to which different doses of caffeine had been added, v. a control drink (water). All drinks were made up in 400 ml of water and each had 50 g glucose powder added. The different drink combinations along with their caffeoylquinic acid (CQA) contents are summarised in Table 1. All treatments, apart from control, were double-blinded. Participants were informed that they were testing different coffee drinks only; they were not told that they contained differing amounts of caffeine and coffee. DC, to which caffeine powder was added, was used so that the effects of caffeine and the other coffee components could be examined separately. The instant coffee granules were a commercially available DC, Kenco Decaff (The Kenco Coffee Company).
Composition of the eight coffee drinks used in this studyFootnote *
CQA, caffeoylquinic acid.
* Decaffeinated coffee and caffeine powder were dissolved in 200 ml boiling water with 50 g glucose powder added; 200 ml of cold water was then added to allow quick consumption.
The study was split into two parts. Part A looked to establish the effect of different doses of caffeinated coffee on postprandial blood glucose and insulin levels. To achieve this, caffeine was varied in line with the DC dose. Three different doses of DC were used (2, 4 and 8 g instant granules, equivalent to that found in 1, 2 and 4 servings of coffee) to which appropriate doses of caffeine were added to reflect the amount of caffeine found in the same doses of regular caffeinated coffee. As the DC was reported as containing 0·3 % caffeine, the amount of caffeine added was adjusted so that the total caffeine in each drink was 100, 200 and 400 mg, respectively. These three coffee drinks were compared with the control drink, which contained no caffeine in Part A. Part B looked to establish the effect of escalating doses of the non-caffeine coffee components on postprandial blood glucose and insulin levels by comparing the same three doses of DC as used in Part A, but this time all taken along with the lowest dose of caffeine from Part A that was shown to produce an effect on the postprandial glycaemic response (100 mg). For Part B, the control drink also contained 100 mg caffeine. The relative proportions for each drink are shown in Fig. 1.
Diagrammatic representation of the relative proportions of decaffeinated coffee (DC) to caffeine (CF) for the eight test drinks used in this study. In Part A, CF rises in proportion to DC, whereas in Part B CF remains constant at 100 mg. ![]() , DC;
, DC; ![]() , CF.
, CF.

Test protocol
All the participants received each of the eight test beverages in a random order on separate study mornings separated by a washout period of at least 5 d. An online randomisation programme was used to generate the sequences for each participant. For 2 d before each of the study days, the participants were asked to refrain from exercise, alcohol and all coffee- and caffeine-containing foods and drinks. They were asked to maintain the same diet the day before each visit and were given a standardised meal to consume the evening before. The standard meal was a supermarket macaroni cheese ready meal. All measurements were taken after a 12-h fast. On each study day, the participants arrived in the morning and provided a fasted capillary blood sample via the finger-prick technique. They then consumed the test drink within 10 min and provided further capillary blood samples every 15 min for 2 h. They were asked to rate each drink using a scale of 1–5 for four drink quality measures: strength, palatability, taste and smell.
Biochemistry
All blood samples were collected by the finger-prick method using a lancing device and collected into glucose (heparin fluoride) microvette tubes (Sarstedt). Approximately 300 ul of blood was collected at each time point. These were refrigerated and centrifuged at 1509 g for 10 min, and the plasma was transferred into serum microvette tubes. Plasma glucose concentrations were measured immediately using the YSI 2300 STAT PlusTM (YSI Life Sciences). Inter-assay CV were 5 % and intra-assay CV were 2 % for the glucose analysis. Following glucose analysis, the plasma was frozen at –20ºC until the end of the study for batch analysis. Plasma insulin concentrations were measured by colorimetric sandwich ELISA (EMD Millipore). Inter-assay CV were 7 % and intra-assay CV were 3 % for the insulin analysis. The finger-prick technique was used as the blood collected via this method is primarily arterial blood and consequently reflects the absorbed glucose levels more accurately than venous blood. Venous blood glucose values are usually lower than arterial values in the postprandial stateReference Larsson-Cohn (35) as some of the absorbed blood glucose will have been taken up by skeletal muscles before it gets to the sample site.
Calculations and statistical analysis
Statistical analysis was carried out using IBM SPSS Statistics 19 (IBM). Sample size was set at ten participants, in line with standard practise in glycaemic index testingReference Brouns, Bjorck and Frayn (36) . The incremental AUC (iAUC) for glucose and insulin for each treatment was calculated by the trapezoid method, with the area under baseline being ignored as recommended by the FAO (37) and as described by Brouns et al.Reference Brouns, Bjorck and Frayn (36) . The Matsuda Index (10,000/√([fasting glucose × fasting insulin] × [mean glucose × mean insulin during OGTT]))Reference Matsuda and DeFronzo (38) was calculated as a measure of postprandial insulin sensitivity. Overall treatment effects were analysed by repeated measures ANOVA. A Bonferroni adjustment for multiple comparisons was applied when post hoc analysis was used. Statistical significance was taken as P<0·05. All results are expressed as mean values with their standard error of the mean, apart from participant characteristics and drink questionnaire results, which are expressed as mean values and standard deviations.
Results
All the participants were overweight males with a mean age of 30·4 (sd 14·2) years, BMI of 27·8 (sd 2·2) kg/m2, fasting blood glucose levels of 5·2 (sd 0·5) mmol/l and were all insulin sensitive (fasting range 5–29 pmol/l)Reference Strazzullo, Barbato and Siani (39) . There was no significant difference between visits for fasting glucose and insulin measures. All were regular coffee drinkers with a mean caffeinated coffee intake of 2·3 (sd 1·6) servings/d.
Drink quality
Mean responses for each of the four drink quality measures – strength, palatability, taste and smell – are shown in Table 2. Repeated measures ANOVA tests were performed for Parts A and B. For Part A, an overall significant difference was found for smell (P=0·045) with no significant differences between individual pairs. No other differences were found in Part A. For Part B, an overall significant difference was found for palatability (P=0·020) and taste (P=0·036) with no significant differences between individual pairs. A significant difference in strength (P<0·001) was detected in Part B, with the post hoc analysis revealing drink 8 to have been perceived as stronger than both drinks 6 (P=0·040) and 5 (P=0·002). A difference in smell (P=0·025) was also found in Part B, with the post hoc analysis revealing a difference between drinks 5 and 6 (P=0·001).
Drink questionnaire resultsFootnote * (Mean values and standard deviations)
a,b,c.d Mean values within a column/part with unlike superscript letters were significantly different (P<0·05).
* Participants rated the control and coffee drinks on a scale of 1–5 for palatability, strength, taste and smell.
Glucose and insulin
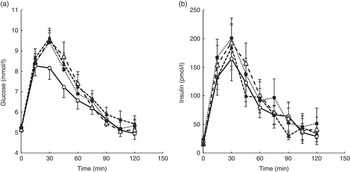
For Part A, where the amount of caffeine was varied in line with the DC dose, there was a significant difference between treatments for glucose. Repeated measures ANOVA on the glucose time points showed a significant treatment effect (P=0·008) and a time×treatment effect (P=0·022). Post hoc analysis showed a significant difference between the control drink (drink 1 in Table 1) and both the one- and two-serving equivalents (drinks 2 and 3) (P≤0·032). A significant difference was also found for both iAUC (P=0·019) and peak values (P=0·006), with the post hoc analysis showing a significant difference between drinks 1 and 2 for both iAUC (P=0·008) and peak values (P=0·006) and a trend for a difference between drinks 1 and 3 for peak value (P=0·056). The mean peak blood glucose concentration for the control (drink 1) was 8·25 mmol/l, whereas the peak for Part A was 9·62 mmol/l (for the two servings equivalent: drink 3), a mean increase of 17 % (1·37 mmol/l) in peak values. No other differences between treatments were detected. There was no difference between treatments for postprandial insulin or insulin sensitivity as measured by the Matsuda Index. The 2-h postprandial glucose and insulin responses for Part A are shown in Fig. 2. The mean iAUC and peak values for glucose and insulin for Parts A and B are shown in Table 3.
Postprandial glucose (a) and insulin (b) responses for a control drink (water) v. three different doses of decaffeinated coffee (DC) with increasing amounts of caffeine (CF) added, equivalent to 1, 2 and 4 servings of standard caffeinated coffee. All four drinks also contained 50 g glucose. Error bars are standard error of the mean (n 10). A significant difference between treatments was observed for glucose (repeated measures ANOVA on time point data, P=0·008). ![]() , 0 g DC, 0 mg CF;
, 0 g DC, 0 mg CF; ![]() , 2 g DC, 100 mg CF;
, 2 g DC, 100 mg CF; ![]() , 4 g DC, 200 mg CF;
, 4 g DC, 200 mg CF; ![]() , 8 g DC, 400 mg CF.
, 8 g DC, 400 mg CF.
Mean incremental AUC (iAUC) and peak glucose and insulin values for the 2-h postprandial period(Mean values and standard deviations)
a,b,c Mean values within a column with unlike superscript letters were significantly different (P<0·05).
For Part B of the study, where all drinks contained 100 mg caffeine, a significant difference in glucose was found for peak values only (P=0·049), with no difference between any individual pairs in the post hoc analysis. There were no significant differences for insulin responses or insulin sensitivity between treatments, although there was a time×treatment effect for insulin (P=0·013). The 2-h postprandial glucose and insulin responses for Part B are shown in Fig. 3.
Postprandial glucose (a) and insulin (b) responses for a control drink (water) v. three different doses of decaffeinated coffee (DC) with 100 mg caffeine (CF) added to each. All four drinks also contained 50 g glucose. Error bars are standard error of the mean (n 10). No significant difference between treatments was observed for either glucose or insulin (repeated measures ANOVA on time point data). ![]() , 0 g DC, 100 mg CF;
, 0 g DC, 100 mg CF; ![]() , 2 g DC, 100 mg CF;
, 2 g DC, 100 mg CF; ![]() , 4 g DC, 100 mg CF;
, 4 g DC, 100 mg CF; ![]() , 8 g DC, 100 mg CF.
, 8 g DC, 100 mg CF.

A paired t test comparing the glucose iAUC for the two control drinks (1 and 5) showed a significant difference between the two (P=0·045), with the control drink containing caffeine (drink 5) having a 22 % higher mean iAUC. There were no significant differences between the two control drinks for any other measures.
Discussion
Our study adds to the body of evidence from previous acute studies demonstrating a temporary worsening in glucose response following coffee ingestion. We have shown, for the first time, that a single serving of instant caffeinated coffee, as typically consumed in the UK, is sufficient to disrupt the 2-h postprandial glucose response. Furthermore, Part B of our study demonstrates that the amount of caffeine found in one serving of coffee can attenuate any possible beneficial effects of escalating doses of the other coffee components.
Gavrieli et al.Reference Gavrieli, Fragopoulou and Mantzoros (40) used two different amounts of caffeinated coffee, 3 and 6 mg/kg body weight (mean: 228 and 457 mg), which were similar to the two higher amounts of caffeine used in Part A (200 and 400 mg, drinks 3 and 4) and found similar results. In line with our study, they reported a higher glucose iAUC in both coffee doses compared with control, with no significant dose–response effect. Although they did not find any overall intervention effect for the glucose response, they did find a time×treatment effect. Our post hoc analysis found the increased glucose response only in the two lower doses of coffee plus caffeine (drinks 2 and 3) and not in the highest dose. It is unlikely that a greater insulin response to the high caffeine levels had suppressed the glucose response in this case, as we found no significant differences between drinks for the insulin response. Furthermore, although Beaudoin et al.Reference Beaudoin, Allen and Mazzetti (41) did find a dose–response effect on insulin, they did not find a direct suppression of glucose as a result. We also observed a difference between treatments in the timing of the peak glucose values, with the control drink peaking at 15 min while all the others peaked later at 30 min. This is consistent with the theory that coffee may exert a beneficial effect by delaying glucose absorption( Reference Johnston, Clifford and Morgan 24 , Reference Welsch, Lachance and Wasserman 25 ).
In Part B of our study, we found no overall treatment effect even at the highest dose of DC (8 g), suggesting that even a relatively small dose of caffeine (100 mg, equivalent to that found in one serving of caffeinated coffee) may be enough to override any potential beneficial effects of increasing other coffee compounds. We did see a difference in peak glucose values across the four treatments in Part B; however, the study was not powered to detect pair-wise difference in individual treatments. The control drink in Part B also contained 100 mg caffeine, unlike in Part A where it was simply water plus glucose, which would explain why there was no significant difference between the control drink and any of the coffee drinks. When the two control drinks were compared, we found the iAUC to be significantly higher for the caffeine-containing control (drink 5), suggesting that it is indeed caffeine that is causing the increased glycaemic response in Part A. It should be noted that the CGA content of coffees can vary considerably, depending on bean composition, processing and brewing methodReference Crozier, Stalmach and Lean (29) , and a detailed analysis of our coffee samples found it to have a relatively low total CQA content of 23·5 mg/g (CQA being the largest proportion of CGA in coffee). This is equivalent to approximately 47 mg in our lowest dose coffee and 188 mg in our highest dose (Table 1). This is low compared with espresso-type coffees, which have a mean CQA content of 145 mg/serving (range 24–422 mg)Reference Crozier, Stalmach and Lean (29) ; however, it is comparable to the mean CQA content of six brands of instant DC, previously measured at 24·4 mg/gReference Johnston, Clifford and Morgan (24) . Nevertheless, these relatively low levels in our coffee may partially explain why we saw no effect of escalating doses of CGA in Part B of our study.
We did not demonstrate any dose–response effect of coffee on blood glucose or insulin levels, either when the caffeine was increased along with the coffee (Part A) or when the caffeine was kept constant (Part B). This is in contrast with a recent study that found a dose–response effect when using caffeine aloneReference Beaudoin, Allen and Mazzetti (41) ; however, the caffeine-only study had more participants (n 24), and – as noted previously – caffeine has been shown to produce a greater effect than coffee on postprandial glucose and insulin levels. The lack of a dose–response effect may also be due to the high inter- and intra-individual variations in glycaemic response, which was apparent when individuals’ responses were examined and is in line with that previously demonstratedReference Vega-López, Ausman and Griffith (42) . Our relatively low number of participants (ten), although being the recommended minimum number for GI testing, may not be sufficient to determine a dose–response relationship. A post hoc power calculation revealed our study to be underpowered to detect a difference in insulin levels. In order for the detected differences in insulin to be statistically significant at 80 % power, we would have needed more than twenty-three participants. This is based on the result that found 5/10 subjects had an increase in insulin levels after coffee intake compared with control and 5/10 subjects had a decrease in insulin levels, and thus no consistent pattern in response was observed. The doses given to our participants were not adjusted according to their body weight in contrast with the previously discussed studies( Reference Beaudoin, Robinson and Graham 20 – Reference Krebs, Parry-Strong and Weatherall 22 , Reference Gavrieli, Fragopoulou and Mantzoros 40 , Reference Beaudoin, Allen and Mazzetti 41 ) as we wanted to reflect normal nutritional intake patterns. When converted to milligram caffeine per kilogram body weight, our lowest dose (100 mg caffeine) gave a mean value of 1·2 mg/kg (range 0·9–1·5 mg/kg) and our highest dose (400 mg caffeine) was 4·6 mg/kg (range 3·7–6·1 mg/kg). This variation in dose between participants may be a confounder in determining a dose–response relationship; however, it does not detract from the main result, which is that a single cup of coffee as drunk in the UK increases the postprandial glycaemic response. Another possible confounder may be different genetic polymorphisms in the CYP1A2 gene that have been shown to affect the rate of caffeine metabolism in humansReference Yang, Palmer and de Wit (43) . Unfortunately, our participants were not genotyped for these polymorphisms as this may have partly explained the high inter-individual variations we found. An obvious difference between the control and coffee drinks is the presence/absence of coffee with its characteristic bitter taste. The hedonic properties of food/drink have been shown to impact acutely on postprandial nutrient handlingReference Robertson, Jackson and Williams (44) , and thus it was important to exclude this as a simple pre-ingestive mechanism. Interestingly, the only drink quality difference from Part A (where a postprandial glucose difference was found) was with ‘smell’; there was no overall impact on palatability. This would indicate that the impact of coffee on glucose metabolism was due to a true post-ingestive mechanism. In light of our results, and those of others discussed previously, it would be advisable for establishments carrying out GI testing not to offer coffee as an accompaniment to the test food.
In conclusion, we have demonstrated for the first time that a single serving of coffee significantly increases the postprandial glycaemic response in healthy overweight men. What is not known is whether this statistically significant increase in blood glucose is physiologically relevant and the implications for individuals with abnormal glucose tolerance. Although we observed a high percentage difference in peak values, it was quickly resolved in insulin-sensitive individuals with all treatments, including control, displaying similar responses from 60 min onwards. It is important that further investigations are carried out in those with impaired fasting glycaemia and T2DM where the effects of coffee may be clinically relevant. It should be noted that this was an acute study and its results cannot be translated simply into chronic effects. Longer-term interventions investigating these chronic effects are now needed if we are to confirm the beneficial effects of coffee suggested by the epidemiology.
Acknowledgements
The authors thank Professor Alan Crozier and Dr Iziar Amaia Ludwig Sanz Orrio (University of Glasgow) for providing the detailed coffee analysis and Dr Caroline Bodinham, Dr Fariba Shojaee-Moradie and Dr Shelagh Hampton (University of Surrey) for guidance with laboratory techniques.
This work was supported by the Biotechnology and Biological Sciences Research Council (BBSRC) and Campden BRI as part of a BBSRC CASE Studentship.
T. M. R., M. D. R. and M. N. C. designed the research; T. M. R. conducted the research; T. M. R. analysed the data; T. M. R. and M. D. R. wrote the paper. All the authors read and approved the final version of the manuscript.
T. M. R., M. N. C., S. P., G. C. and M. D. R. have no conflicts of interest.


