INTRODUCTION
Different explanations of selective semantic disorders have widened
the theoretical framework on the structure of the conceptual system of
human beings. Category-specific deficits affect the knowledge of specific
conceptual categories, while sparing the knowledge of other ones. They
could, for example, affect the category of living things (i.e., animals,
fruits, vegetables, etc.), while sparing the category of nonliving things
(i.e., objects in general, tools, vehicles, etc.), or vice versa. The most
important distinction within theoretical models is that between the
Sensory-functional theory (SFT) (Warrington &
McCarthy, 1987; Warrington & Shallice,
1984) and categorical theories, such as Caramazza and
Shelton's (1998) Domain-specific one.
Warrington and Shallice (1984) conceived the
semantic memory system to be a general-purpose computational device,
whereby category-specific effects are the result of specific processing
requirements. To distinguish different living things from each other, for
example, a perceptual analysis is primarily required, but not a functional
one, because living things are not usually handled as tools, or used in
some way. To distinguish nonliving things, however, does primarily require
an analysis of their use or function, and in this case, it is the detailed
perceptual analysis that is less important. Thus, the disruption of
perceptual analyses is expected to lead to a selective deficit for the
processing of living things, whereas the disruption of functional analyses
is not (e.g., Farah & McClelland, 1991).
And, conversely, the disruption of functional analyses is expected to lead
to a selective deficit for the processing of nonliving things, whereas the
disruption of perceptual analyses is not assumed to have as large an
effect.
Caramazza and Shelton (1998) regard the
semantic system as a collection of distinct cognitive—and
perhaps neural—mechanisms for the processing of different categories
of things (e.g., animal, plants, and tools). They argue that these
mechanisms reflect specific evolutionary adaptations. In contrast to SFT,
the Domain-specific theory suggests that damage to one of the
domain-specific mechanisms would affect the processing of exemplars of a
specific conceptual category, regardless of which features (sensory or
functional) are processed. However, the theories that typically address
focal lesions, do not seem to account for all available data. The SFT
cannot entirely describe the deficits of patients who have trouble
dissociating living from nonliving things and show no difference
dissociating their perceptual and functional aspects (e.g., Lambon-Ralph
et al., 1998a, 1998b;
Kolinsky et al., 2002). Moreover, semantic
deficits rarely reflect a clear-cut distinction between living and
nonliving things. More often, the deficits show fractionations, involving
small categories instead (e.g., Hart et al.,
1985; Hillis & Caramazza, 1991), such
as, a deficit for, say, knowledge of animals that spares knowledge of
fruits and vegetables.
Devlin et al. (1998) and Tyler et al. (2000) took a different perspective, and proposed
correlational models that assume a unitary semantic memory system. The
model by Devlin and colleagues is based on the finding of Gonnerman et al.
(1997) that in the early stages of
Alzheimer's disease (AD) patients show a category-specific deficit
for nonliving things, whereas in later stages this effect reverses, with a
greater deficit for living things instead.
The model proposed by Tyler et al. (2000)
focuses, on the one hand, on the close interdependency between living and
nonliving categories, which is based on a complex relation between two
dimensions of features: (a) their nature (i.e., types), being
either perceptual or functional; and (b) their distribution
across the network being either shared (a feature is common to many
exemplars of a semantic category) or distinctive (a feature is typical of
a specific exemplar or of very few exemplars). Different combinations of
these two dimensions (i.e., perceptual/distinctive;
perceptual/shared; functional/distinctive; functional/shared)
characterize semantic features. The authors emphasize also the role of
task requirements in evaluating a patient's performance. Patients
with category-specific deficits may show different levels of impairment of
their knowledge of a category, depending on the task that is administered.
Importantly, shared knowledge of both perceptual and functional features
of living things is relatively spared in cases with
mild-to-moderate degeneration, and allows discrimination between
categories (e.g., animals vs. tools), but not between exemplars
within a category (e.g., tiger vs. zebra).
Distinctive-functional knowledge of nonliving things may be impaired in
this case, but it can to some extent be circumvented, with the retrieval
of knowledge of perceptual features (in this case, shape characteristics).
The net result is that both the discrimination between categories (e.g.,
tools vs. animals) and the discrimination within the category of
nonliving things (e.g., pliers vs. scissors) are spared. In the
more severe stages of the disease, both functional and perceptual
features become progressively unavailable, first affecting knowledge of
living things—already more impaired than knowledge of nonliving
things—and finally involving also knowledge of nonliving things.
Studies on degenerative disease patients are now providing a new
source of data related to the organization of the semantic memory system.
A number of reports describe a category-specific deficit for knowledge of
living things associated with specific deficits in perceptual knowledge,
whereby knowledge of nonliving things was spared or at least still
relatively good, consistent with SFT (e.g., Basso et
al., 1988; Breedin et al., 1994; Cardebat et al., 1996). In subsequent studies,
however, a selective deficit for living things was found without any
difference in the knowledge of perceptual and functional attributes (Barbarotto et al., 1995), a result that is more easily
explained by the Domain-specific theory of Caramazza and Shelton (1998). Relevant findings are presented by Lambon-Ralph
et al. (1998a) who compared two patients with
dementia: an AD patient with a category-specific deficit for living
things, without any difference between perceptual or functional (or
associative) knowledge, and a semantic dementia patient with a slight
advantage for living things, and a selective impairment for perceptual
rather than functional attributes. The performance of the two patients
allowed authors to observe that a selective impairment for features does
not necessarily imply a category-specific deficit, in contrast with the
SFT hypothesis. Furthermore, in a longitudinal study of a patient with
semantic dementia, Tyler and Moss (1998) found
that functional knowledge is less vulnerable to deterioration
than perceptual information. Noteworthy, a greater loss for nouns than for
verbs and actions was also observed, in both a single-case investigation
(Silveri et al., 2003), and in a group study
(Bak & Hodges, 2003).
Thus, patients with degenerative diseases can provide precious and
counterintuitive contributions to the understanding of the semantic memory
system that challenge current theories. The great variability among these
patients with respect to the quality and quantity of their semantic
knowledge impairment, may be due to the peculiar progressive
nature of the disease. In fact, various disruptions of the cognitive
system may highlight changes happening over time that can even
lead to opposite findings in different single-assessment studies. In
longitudinal investigations, however, semantic deficits can be tracked
with success, and the influence of the patients' global level of
cognitive impairment on their performance in semantic tasks can be taken
into account.
The present study examines the evolution of semantic disorders in a
patient (VZ) over a period of two years. VZ's categorical knowledge
for living versus nonliving things interacts with feature
knowledge (perceptual vs. functional), in a complex fashion,
during the progression of the disease; eventually, the patient shows clear
fluent aphasia with empty speech correlated with a severe semantic damage
involving all categories, but sparing knowledge of actions.
CASE REPORT
VZ is a 64-year-old housewife, with five years of education,
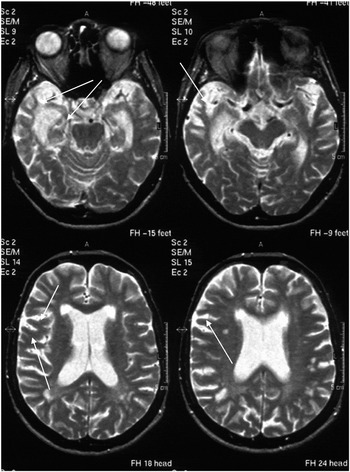
complaining about forgetfulness and name retrieval problems. Magnetic
resonance imaging (MRI, see Figure 1) made at
the beginning of the study showed white matter lacunar infarcts and patchy
periventricular hyperintense lesions, mainly adjacent to the right atrium
and to the frontal horns. Severe atrophy involved the right superior,
middle and infero-medial temporal gyri, particularly the right hippocampus
and parahippocampal gyrus, and the right perisylvian regions. There was
also less prominent diffuse atrophy. A second MRI made one year later,
during the second assessment, was very similar to the previous one. No
other images in the later stages are available.
MRI scan of patient VZ, showing severe atrophy involving the right
superior, middle and infero-medial temporal gyri, and the right
perisylvian regions.
NEUROPSYCHOLOGICAL ASSESSMENTS
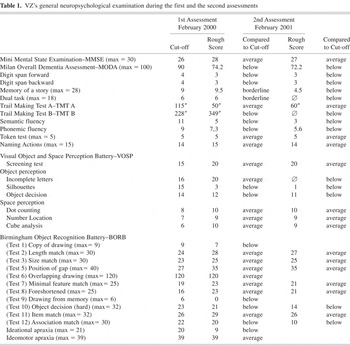
In the first of three subsequent assessments, VZ was tested on the
MMSE (Mini-Mental State Examination, Folstein et al.,
1975), on the MODA battery (Milan Overall Dementia Assessment,
Brazzelli et al., 1994), and on a series of
neuropsychological tests (Table 1, first
assessment). The patient was alert, cooperative, and well-oriented in time
and space. The language was fluent, syntactically and semantically
correct, and verbal comprehension was perfect (Token test); furthermore,
she was flawless in naming actions (15/15 correct). VZ was also tested
with the VOSP (Visual Object and Space Perception Battery, Warrington & James, 1991) and the BORB (Birmingham
Object Recognition Battery, Riddoch & Humphreys,
1993) batteries. She had intact basic visuo-perceptual and spatial
abilities, and accomplished all tasks that did not require access to
stored knowledge (BORB Minimal Feature, Foreshortened View and Copy of
Drawing). However, when the task required the retrieval of visually stored
information (VOSP and BORB Object Decision subtests; VOSP Silhouettes;
BORB Drawing from Memory), VZ showed severe impairment. Despite her spared
access to knowledge of super-ordinate categories (BORB Item Match), VZ was
unable to perform more associative semantic inferences from visually
presented stimuli (BORB Association Match). Finally, although she did not
show signs of ideomotor apraxia, VZ was defective in an ideational apraxia
test (both of these tests were administered only during the first
assessment).
VZ's general neuropsychological examination during the first and
the second assessments
The pattern shown by the patient did not match the criteria for
Dementia of Alzheimer type as described in the Diagnostic and
Statistical Manual of Mental Disorders, Fourth Edition, which
requires a main disturbance in episodic memory plus another cognitive
deficit (American Psychiatric Association,
1994). Rather, VZ fulfilled the criteria for semantic dementia, as
previously reported by Hodges et al. (1995). The
patient also received a neurological examination and laboratory tests to
rule out other causes of dementia.
One year later, although VZ's language was still fluent with
correct syntax, and she was still well-oriented in time and space
(orientation part of the MODA), she failed the MMSE memory test (27/30
correct overall) and showed a slight decline in the neuropsychological
part of the MODA battery (Table 1, second
assessment). In the remaining tests, VZ showed a substantial decrement,
with only a few exceptions (Token Test, TMT-A and Naming actions,
14/15 correct). VZ's basic visuo-perceptual and spatial tasks
still appeared broadly intact, except in the VOSP Incomplete Letters
subtest (perhaps due to an increasingly widespread impairment in reading).
As in the previous assessment, in visual presemantic tasks, and in
matching stimuli to stored categorical knowledge, the patient's
performance was normal. However, her ability to retrieve stored perceptual
knowledge, and to make semantic associations was extremely poor.
VZ underwent a further neuropsychological evaluation, one year after
the second examination (third assessment). Her spontaneous language
appeared fluent, but meaningless, producing almost exclusively verbs,
adverbs, and prepositions without nouns. At this level of degeneration,
the neuropsychological evaluation could only be very limited. On the MMSE,
VZ obtained a score of 9/30 showing deficits in orientation, object
naming, memory, comprehension, and copying of drawings.
MATERIALS AND METHODS
In the experimental investigation, naming abilities and semantic
knowledge were assessed to verify whether the disorder was at the level of
lexical retrieval, or at a higher level (i.e., in processing semantic
information). For this purpose VZ's performance was investigated in
two subsequent assessments, one year apart, using the same three tests on
both occasions: (1) Picture Naming, (2) Naming on Verbal Definition, and
(3) Semantic Judgment. As will become clear later, a third experimental
assessment was not possible anymore for the patient two years after the
beginning of this study, and only the Picture Naming test was presented to
the patient.
Picture Naming
VZ's naming ability was assessed with 60 pictures (see Laiacona et al.'s battery, 1993) divided into 30
living things (10 animals, 10 vegetables, and 10 fruits) and 30 nonliving
things (10 tools, 10 vehicles, 10 pieces of furniture).
Naming on Verbal Definition
Since a Picture Naming deficit could also be ascribed to a visual
recognition disturbance, the purpose of this task was to elicit names by
their verbal definitions. Furthermore, to evaluate the role of attributes
in name finding, a verbal definition of 15 living and 15 nonliving items
was presented orally, with emphasis on either perceptual or functional
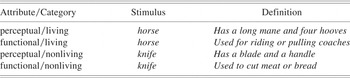
attributes. Four different combinations between attribute-type
(perceptual/functional) and stimulus-type (living/nonliving) were
constructed (Appendix 1): (1) perceptual/living; (2)
functional/living; (3) perceptual/nonliving; and (4)
functional/nonliving.
Semantic Judgment
This task did not require name retrieval and the purpose was to
evaluate the presence of semantic knowledge difficulties that could
potentially cause the naming disorder. VZ's performance was expected
to be very good if the disorder were due to a lexical retrieval deficit,
but to be poor if her deficit reflected semantic knowledge impairment. In
this test, the patient was given a stimulus (name of a living or nonliving
item) and a short verbal statement that emphasized either perceptual or
functional attributes. VZ had to judge whether each statement was
appropriate to the stimulus by saying “Yes” or
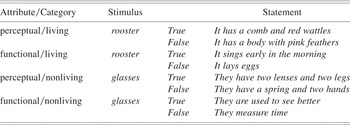
“No.” The item set comprised 24 living and 24 nonliving
things, matched for familiarity, to determine four types of
stimulus/attribute combinations (one true and one false, for each
combination; Appendix 2): (1) living/perceptual; (2)
living/functional; (3) nonliving/perceptual; (4)
nonliving/functional. Overall, 191 trials (stimulus/attribute
statement pairs) were presented verbally, in random order (one trial had
to be dropped).
RESULTS
Picture Naming
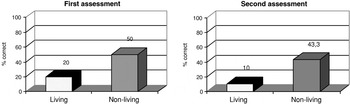
In her first examination, VZ showed marked word retrieval
difficulties. She was significantly more impaired in naming living
(6/30, 20%) than nonliving things (15/30, 50%). As pointed out by
Lambon-Ralph et al. (1998b), picture naming in
patients with semantic dementia can be affected by word frequency, and
visual complexity. Thus, for each stimulus, the following two variables
were considered as potentially influencing her performance: (1) visual
complexity (norms from Snodgrass & Vanderwart,
1980), and (2) word frequency in the Italian lexicon (norms from
Bortolini et al., 1972 after logarithmic
transformation). The linear model included both discrete independent
variables (living vs. nonliving) and continuous ones (word
frequency and visual complexity), as well as a dichotomous
(correct–wrong) dependent variable. The living/nonliving
comparison, adjusted for all the confounding variables, yielded a
significant advantage [χ2(1) = 4.09; p <
.05] for knowledge of the nonliving category (Figure 2, first assessment).
VZ's performance in the Picture Naming test (percentage of
correct answers).
Interestingly, in 80% of the pictures that VZ did not name, she
mentioned the super-ordinate category of the stimulus (e.g.,
“that's an animal” or “it's some kind of
fruit”). In the second assessment, VZ showed a severe decline
compared to the year before (Figure 2, second
assessment). VZ's performance was only 3/30 (10%) correct with
living, but 13/30 (43%) correct with nonliving things. The knowledge
difference between categories was still significant after the two
confounding variables (frequency and visual complexity) were taken into
account [χ2(1) = 6.17; p < .02]. The
comparison of VZ's Picture naming performance in the two assessments
showed a greater decrease in knowledge of living (nonparametric McNemar
pairwise test for dependent variable: N = 30; p = .06,
one-tailed) than of nonliving things (McNemar test: N = 30; ns),
over time.
Separate considerations apply to the description of the patient in the
later stages of her illness. In the third experimental assessment, as
mentioned earlier, VZ's poor verbal comprehension did not allow her
to understand the experimental test instructions; thus, only a new series
of simple Picture naming tests was administered. VZ correctly named
2/15 (13%) of the objects, 2/11 (18%) of the foods, 0/11 (0%)
of the fruits and vegetables, and 0/11 (0%) of the animals, showing
floor performance for every semantic category. Noteworthy is that naming
failure for objects often led VZ to produce a verb representing an action
that is typically performed with that object (e.g., pencil: “to
write with”, or glass: “to drink from”). This suggests
that she still maintained some knowledge of the object's function.
Furthermore, naming actions, which she performed flawlessly in the
previous neuropsychological assessments, was still unexpectedly good
(10/15, 67%). Moreover, word frequency and familiarity, though not
directly assessed, cannot explain the verb–noun difference, since
the patient cannot name highly familiar objects such as glass or
pen.
Naming on Verbal Definition
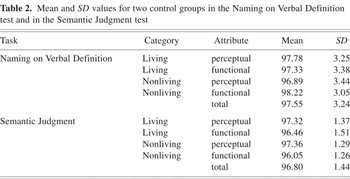
A fifteen-participant control group, matched for age and education
with VZ, was 97.55% (SD = 3.24) correct on Naming on Verbal
Definition task, without any performance difference between categories or
attribute types (Table 2). In the first
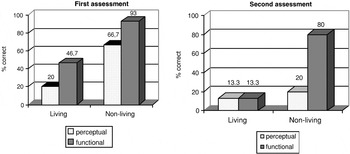
assessment, in contrast, the patient named nonliving things more
accurately (24/30, 80%) than living ones (10/30, 33%), thereby
showing a significant category effect [χ2(1) = 13.3;
p < .0005]. VZ was also better with functional attributes
(21/30, 70%) than with perceptual definitions, regardless of category
type (13/30, 43%), [χ2(1) = 4.34; p <
.05]. Moreover, she showed an advantage for stimuli depicting
nonliving rather than living things in the case of both perceptual
[10/15 vs. 3/15, respectively, χ2(1)
= 6.65; p < .01] and functional definitions
[14/15 vs. 7/15, respectively; χ2(1)
= 7.78; p < .005], (Figure 3,
first assessment).
Mean and SD values for two control groups in the Naming on
Verbal Definition test and in the Semantic Judgment test
VZ's performance (percentage of correct answers) in the Naming on
Verbal Definition task.
A year later, VZ correctly named 4/30 (13%) living and 15/30
(50%) nonliving things, still showing a significant category difference
[χ2(1) = 9.3; p < .005]. Again, she
showed an attribute-type effect, naming functional definitions better
(14/30, 47%) than perceptual ones (5/30, 17%),
[χ2(1) = 6.24; p < .05]. This time,
the effect of attribute-type was detectable only within the category of
nonliving things, whereas for the category of living things performance
was now severely disrupted for both types of definitions. For the naming
of nonliving things, perceptual attributes were less effective (3/15,
20%) than functional definitions (12/15, 80%)
[χ2(1) = 10.8; p < .001].
A comparison (see Figure 3) of the two
subsequent assessments showed that VZ's performance, as time passed,
greatly worsened for both categories (living: McNemar test: N =
30; p < .05; nonliving: McNemar test: N = 30;
p < .005). Over time, both perceptual (McNemar test:
N = 30; p < .01) and functional (McNemar test:
N = 30; p < .05) knowledge also decreased for both
categories. Looking at category X attribute effects over time, it can be
seen that VZ's performance was very poor for both types of attributes
of living things, during the first assessment, and no further decline of
type of knowledge was observed for this category. In the case of nonliving
things, a significant decline over time was found for perceptual knowledge
(McNemar test: N = 15; p < .05), but not for
functional attributes (McNemar test: N = 15; ns).
Semantic Judgment
A group of 14 participants comparable with VZ for age and education,
correctly judged 185/191 items (96.8%; SD = 1.44), without
significant differences between categories or attribute types (Table 2). Statistical comparison showed VZ's
marked impairment in the first assessment with respect to controls
[t = 15.7; p < .001, Crawford
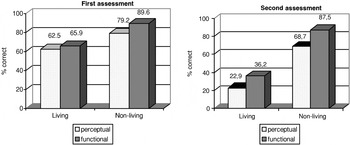
& Garthwaite, 2002]. VZ correctly judged 64% (61/95)
of the statements on living things (30/48 perceptual and 31/47
functional), and 84% (81/96) of the statements on nonliving things
(38/48 perceptual and 43/48 functional), thereby revealing a
significant advantage for the nonliving category
[χ2(1) = 10.8; p < .001], but no
difference was found between the two attribute types overall
[χ2(1) = .97; ns], (Figure
4, first assessment). Furthermore, although not significant, the
patient judged the perceptual attributes of living things worse
than those of nonliving things [χ2(1)= 3.23;
p = .07], whereas she judged the functional
attributes of nonliving things better than those of living things
[χ2(1) = 8.49; p < .005].
VZ's performance (percentage of correct answers) in the Semantic
Judgment test.
A year later, VZ correctly judged 29% (28/95) of the statements
concerning living things (11/48 perceptual; 17/47 functional), and
78% (75/96) of the statements on nonliving ones (33/48 perceptual;
42/48 functional), showing a significant advantage for nonliving
things [χ2(1) = 46.3; p < .0001]
(Figure 4, second assessment). Furthermore,
overall VZ performed significantly worse with perceptual definitions
(44/96, 46%) than with functional ones (59/95, 62%),
[χ2(1) = 4.71; p < .05]. Finally, a
significant loss of perceptual attributes was more marked for living than
for nonliving things [χ2(1) = 20.3; p <
.0001], and functional attributes were still more effective for the
category of nonliving things rather than for living things
[χ2(1) = 27.5; p < .0001].
The comparison of VZ's performance in the two assessments showed
a greater disadvantage for living things (McNemar test: N = 95;
χ2(1) = 29.3; p < .0001) than for nonliving
ones (McNemar test: N = 96; ns). Over time, VZ showed a general
decline in both perceptual (McNemar test: N = 48; p <
.0001) and functional (McNemar test: N = 47; p <
.001) knowledge of living things. However, whereas in the case of
nonliving things, her perceptual knowledge in the second year had declined
compared to that in the first year (McNemar test: N = 48;
p = .06, one-tailed), her functional knowledge remained
comparable (McNemar test: N = 48; ns).
DISCUSSION
In this study, we described a patient affected by a progressive
semantic disorder, who was studied longitudinally over a period of two
years. Looking at VZ's performance in all three tasks, we can discard
a lexical retrieval deficit in favor of a genuine semantic disorder, which
selectively affects the categories of living and nonliving things in
different ways. Moreover, the differences in her performance for these two
categories cannot be attributed to such potential confounds as frequency
or visual complexity (Funnell & Sheridan,
1992; Stewart et al., 1992; Parkin, 1993; Parkin & Stewart,
1993).
The progression of VZ's semantic deficit shows changes in the
interaction between a category-specific impairment (living vs.
nonliving) and an impairment for the knowledge of features (perceptual
vs. functional). In this study, robust data come mainly from the
longitudinal evaluation accomplished in the first two
assessments, where a category × attribute effect was observed, along
with a decline that followed a clear pattern:
- 1st phase. Categorical effect: Initial knowledge loss of
living things is more prominent than of nonliving things (Picture naming).
Category × attribute effect: Major loss of
perceptual attributes for the category of living things—an effect
found only in the most demanding task for VZ (Naming on verbal
definition)—whereas a trend in the same direction is found in her
performance on the less difficult task (Semantic judgment).
- 2nd phase. Categorical effect: General loss of knowledge of
living things, but not of nonliving things (all tasks). Category
× attribute effect: Increasing loss of both perceptual and
functional features concerning living things and increasing impairment of
perceptual features of nonliving things (all tasks).
- 3rd phase: Although the severity of global deterioration did not
allow the administration of experimental tasks, preservation of action
knowledge concerning objects is indirectly observed through basic naming
tasks.
Thus, while a categorical deficit is observed in both experimental
sessions, the interaction between categorical and attribute knowledge
appears, in the first phase of testing, only in the more demanding tasks
(i.e., Naming), and not in the less demanding one (i.e., Semantic
judgment). Indeed, the three experimental tasks have different
requirements. All of them imply access to stored semantic knowledge, but
only naming tasks also require lexical retrieval. Naming impairment was
the earliest deficit in VZ's degeneration, and it was larger in the
visual than in the verbal modality. The Semantic judgment task is less
hard. As the disease progressed, the disorganization of VZ's
knowledge made the category × attribute interaction undetectable in
the tasks that are the most demanding for her, but detectable in the one
that did not require name retrieval. Depending both on the degeneration
stage and task requirements, category-specific effects can be observed
either with or without selective attribute
impairments.
Thus, in the study of dementia patients, a longitudinal perspective
seems critical in highlighting the lines along which the semantic system
degenerates. Quite interestingly, the patient underwent a great perceptual
impairment during the first assessment, affecting mainly the knowledge of
living things. This seems to support the basic predictions of Warrington
and Shallice's (1984) SFT. However, SFT
does not predict the widespread loss of both perceptual and
functional knowledge that was found, in the second assessment, for
living things. SFT, namely, only assumes a marginal involvement of the
functional features if there is a selective deficit of living things.
Therefore, the category × attribute interaction, proposed by the
SFT, cannot fully account for the present data.
VZ's pattern does not match the predictions by Caramazza and
Shelton (1998) of a “pure”
categorical deficit either. The authors' predictions that
category-specific effects can only occur as the breakdown of a semantic
domain, such as, say, animals, without the selective involvement of
specific types of features is not supported by VZ's behavior. In
fact, during both the first and second assessments, with some differences
depending on task difficulty, the patient showed an advantage for
nonliving things and for functional attributes, along with a
deficit for living things and (mainly) perceptual features. VZ,
therefore, shows an interaction between categories and attributes, an
effect that is not hypothesized by Caramazza and Shelton's view.
That the semantic knowledge of VZ showed a clear impairment for living
things right from the beginning of the study, when her general
cognitive performance was still normal, is in contrast with Devlin et
al.'s (1998) predictions of a primary
deficit for nonliving things. For the mild-to-moderate-degeneration
stages, Tyler et al. (2000) predicted that only
the ability to determine the category to which living stimuli
belong would be spared. This skill would be supported by intact
shared-knowledge (both perceptual and functional) of living
things. That VZ's answers refer to super-ordinate categories of
living things in both naming tasks does indeed seem to support Tyler et
al.'s (2000) predictions, but the
generalized decrement of both perceptual and functional features
of living things, in VZ's second assessment, does not support their
model. In the case of nonliving things, Tyler and colleagues hold that
distinctive functional attributes should still support discrimination in
mild-to-moderate stages of the illness, via perceptual processing of shape
features. However, considering VZ's performance in the two verbal
tasks, it seems that perceptual information related to nonliving
things allowed discrimination between exemplars of the category in the
first assessment. However, in the second assessment, VZ was still able to
discriminate between different members of the nonliving things category,
even if perceptual knowledge of nonliving things had a consistent decline.
Thus, Tyler et al.'s prediction that functional knowledge of
nonliving things is helped by perceptual information is only to some
extent confirmed by our data. Finally, in the most severe stages of her
illness, VZ seems to rely on some kind of action knowledge that
is not considered by these authors.
Keeping in mind VZ's general loss of knowledge for items of both
categories, note that (1) she performs best with the help of functional
features of nonliving things, and that (2) her ability to identify objects
by referring to actions that can be performed with them (by producing
verbs in her attempts to answer) is still intact (see also Bird et al., 2000; Bak &
Hodges, 2003; Silveri et al., 2003).
These two facts suggest that even in the final stages of her illness VZ
might still rely on some knowledge of actions, perhaps supported by the
activation of the affordance representation of objects. This
interpretation is consistent with Buxbaum and Saffran (2002), who emphasize the role of “motor”
knowledge (i.e., affordance) during the processing of objects. In this
view, functional attributes are considered an indirect product of
action/motor processing (see also Warrington &
McCarthy, 1987; Tyler & Moss, 1998).
The preservation of some sort of action/motor knowledge might also be
consistent with the preservation of procedural learning, that is typically
found in dementia (De Vreese et al., 2001).
This study suggests that category-specific deficits can indeed be
interpreted in terms of a multifaceted relation between category and
attribute knowledge. At least in the case of our patient, living things
seem to crucially rely on perceptual processing, although there are
differences due to task difficulties, as pointed out by Tyler et al.
(2000). However, no theory seems to account for
the generalized decline of functional knowledge of living things that we
observed during our second assessment of VZ. Knowledge of nonliving things
seems to be partially sustained by functional information, and partially,
but for a much longer time, by some kind of action or motor knowledge. In
fact, functional and motor knowledge might be intertwined in the
representations of nonliving things (Buxbaum &
Saffran, 2002), which could be an interesting aspect to disentangle
in future studies.
Finally, it seems crucial to track category-specific deficits in
patients with degenerative processes, by taking task requirements
and severity of damage into account at several stages of these
processes. The adoption of such an approach for degenerative
investigations may thus reveal complex effects that could either be
misinterpreted or underestimated in single-assessment studies.
APPENDIX 1. Examples from the Naming on
Verbal Definition task
APPENDIX 2. Examples from the Semantic
Judgment test