


Normal ageing is associated with physiological declines in muscle mass(Reference Clark and Manini1–Reference Hughes, Frontera and Wood3), strength (MS)(Reference Clark and Manini1–Reference Hughes, Frontera and Wood3) and quality (MQ) (MS/muscle mass(Reference Goodpaster, Park and Harris4)). Ageing skeletal muscles display insulin resistance, increased adipose tissue and lipid infiltration(Reference Kirkland, Tchkonia and Pirtskhalava5), altered architecture(Reference Lieber and Friden6) and reduced muscle fibre size and altered fibre-type composition(Reference Andersen7). These ageing-related muscle alterations and dysfunction dramatically reduce the quality of life of afflicted individuals and increase the risks of falls, fractures and functional incapacities(Reference Clark and Manini1–Reference Goodpaster, Park and Harris4) which in turn results in considerable healthcare costs(Reference Jakobsen, Rask and Kondrup8,Reference Sasaki, Kasagi and Yamada9) . Developing non-pharmacological approaches to prevent functional declines associated with ageing therefore represents a pressing need for ageing societies to reduce the economic burden.
Several interventions are known to reduce the aforementioned declines such as practicing physical activity(Reference Rodriguez, Di and Langley10–Reference Barengo, Antikainen and Borodulin12), consuming a sufficient amount of protein and receiving nutritional supplements(Reference Clark and Manini13–Reference Gray-Donald, St-Arnaud-McKenzie and Gaudreau15). There are different types of physical activities, including resistance training, which is the most widely used to prevent loss of muscle mass(Reference Peterson, Sen and Gordon11,Reference Peterson and Gordon16,Reference Iglay, Thyfault and Apolzan17) . However, power training appears to be more efficient than resistance training for improving MS(Reference Paterson, Jones and Rice18). Indeed, power training, which is characterised by high-velocity resistance training, confers greater benefits on MS and overall quality than the traditional resistance training(Reference Peterson, Sen and Gordon11,Reference Peterson and Gordon16) . Hence, daily tasks require not only strength provided by resistance training but also a combination of strength and power provided by power training(Reference Paterson, Jones and Rice18–Reference Miszko, Cress and Slade20). Furthermore, the development of muscle power associated with this training is highly related to functional task performance, for example, improving the ability to rise from a chair, climb stairs and possibly protect from falling(Reference Miszko, Ferrara and Cress21). Finally, the greater gain in MS and MQ generated by power training is relevant considering that these two variables are of major interest to prevent the onset of functional disabilities(Reference Barbat-Artigas, Rolland and Vellas22).
The amount of proteins ingested also appears to play an important role in maintaining muscle mass, MS and MQ(Reference Paddon-Jones and Rasmussen14,Reference Iglay, Thyfault and Apolzan17,Reference Kim, Wilson and Lee23–Reference Boirie, Dangin and Gachon27) . Some studies(Reference Dreyer and Volpi28,Reference Roubenoff and Hughes29) , but not all, showed that a daily protein intake above the actual RDA of 0·8 g/kg BM per d (BM, body mass)(Reference Trumbo, Schlicker and Yates30) could attenuate muscle atrophy in older adults and, therefore, prevent physical disabilities. More specifically, it has been suggested that people aged over 60 years old should increase their protein intake to approximately reach 1·2 g/kg BM per d to prevent the loss of muscle mass and MS(Reference Benton, Wagner and Alexander31–Reference Omura34). Moreover, 1·6 g/kg BM per d represent a breaking point where muscle mass is unlikely to be further increased by resistance training(Reference Reidy35). In addition, a recent study showed that contrary to the current recommendation, equivalent to 20 g of protein per meal (for an individual of 75 kg)(Reference Trumbo, Schlicker and Yates30), a protein ingestion of at least 25–30 g per meal would be required to reach maximal muscle protein synthesis in older men(Reference Paddon-Jones and Rasmussen14).
This phenomenon can be explained by numerous ageing-related changes, including anabolic resistance, altered hormonal responses, impaired intestinal absorption, reduced perfusion(Reference Paddon-Jones and Rasmussen14,Reference Bauer, Biolo and Cederholm32,Reference Omura34,Reference Vellas, Hunt and Romero36–Reference Bauer and Diekmann38) , etc. caused, in part, by a decrease in protein absorption in elderly individuals. Therefore, elderly people should consume more protein than their younger counterparts to counteract reduced protein absorption and synthesis(Reference Paddon-Jones and Rasmussen14,Reference Rafii, Chapman and Elango39) . Furthermore, some interventional studies demonstrated that the type of protein, namely slow- or fast-digested proteins, which is classified according to the speed of intestinal absorption of dietary amino acids(Reference Frühbeck40), could differently modulate protein accretion(Reference Wilkinson, Tarnopolsky and Macdonald25–Reference Boirie, Dangin and Gachon27,Reference Dangin, Boirie and Garcia-Rodenas41) . However, a recent meta-analysis has shown that there is currently no evidence to advise that supplementation of protein or amino acids alone increases muscle mass or MS in healthy elderly people(Reference Tieland, Franssen and Dullemeijer42).
When combined, protein supplementation (fast milk-based protein; 10 g/d) and resistance training (4 months) can induce greater improvement in leg fat-free mass and time to muscle failure than each of these interventions alone in sedentary older men(Reference Gryson, Ratel and Rance43). These observations concur with those of Haub et al. (Reference Haub, Wells and Tarnopolsky44) who reported positive results when resistance training was combined with protein supplementation independently of the type of protein (beef v. soya) in elderly men. These results are also in line with the meta-analysis by Liao et al. (Reference Liao, Tsauo and Wu45) showing that protein supplementation combined with resistance training leads, in comparison with these interventions performed alone, to greater improvement in leg fat-free mass, fat mass (FM) and MS but not functional capacities. However, Tieland et al. (Reference Tieland, Dirks and van der Zwaluw46) concluded that, in frail elderly individuals, MS and functional capacities improved following 24 weeks of resistance training but that protein supplementation (2 × 15 g/d of milk protein) did not provide any additional benefit, except for increasing muscle mass. Morton et al. showed additional benefits of protein supplementation in meta-regression but concluded that this effect is attenuated at older age. This conclusion has also been supported in a recent meta-analysis performed by Finger et al. (Reference Finger, Reistenbach Goltz and Umpierre47). These apparent discrepancies could arise from differences in the age of participants (60 years and over), sample size, sex, obesity status, type of protein supplementation (source, amount and timing of ingestion) or duration of the intervention.
Thus, the potential effects of protein supplementation combined with physical activity intervention on MQ in older adults remain controversial, especially regarding the type and dose of proteins that are required. Moreover, protein supplementation has most often been tested in combination with resistance training, but its impact on MQ should be investigated in combination with power training since the latter is particularly effective in increasing MS.
Objective and hypotheses
The aim of the present study was to assess whether combining fast protein supplementation with mixed power training (MPT; power training mixed with functional exercises) would result in greater improvement in muscle function (MF) and functional capacity than either when MPT is combined with slow protein supplementation or a placebo (see Methods) in older men over 60 years old. Our main hypotheses were that MPT would produce positive effects on MF and functional capacity in all groups and that its effect would be potentiated when combined with protein supplementation, especially fast proteins.
Methods
Participants and study design
This study is a per-protocol, randomised, double-blind/controlled trial. Seventy-five older men aged over 60 years old (69 (sd 7) years) were recruited from the community via social communication (flyers and meetings in community centres) in the Greater Montreal area. This study included men exclusively considering that they experience a greater loss of lean mass (LM) (3 v. 1·7 % per year for women(Reference Reid, Callahan and Carabello48)) and a shorter life expectancy than women(Reference Reid, Callahan and Carabello48). To be included in the study, participants had to (1) have a BMI between 18 and 30 kg/m2; (2) be sedentary (<120 min of physical activity/week; (3) not be on protein supplement; (4) have a stable weight over the last 6 months and (5) have no physical activity restriction. Participants were excluded from this study if they (1) had physical disability or orthopaedic problem; (2) took medication or had condition known to affect muscle metabolism (chronic obstructive pulmonary disease, etc.); (3) had cognitive impairment (Montreal Cognitive Assessment score < 26); (4) were smoker and heavy drinker (>2 drinks/d) and (5) had protein allergy, lactose intolerance, any acute health condition, known hepatic or renal diseases and asthma. All procedures were approved by the Ethics Committee of the University of Quebec at Montreal (CIEREH – UQAM; No.: A-120006). All participants were fully informed about the nature, goal, procedures and risks of the study and gave their written informed consent. Upon enrolment, men were invited to visit the Département des sciences de l’activité physique at UQAM, where their body composition, MS and functional capacity were assessed. After the completion of baseline measurements to ensure their eligibility, participants (range of initial protein intake (0·7–2·5) g/kg BM per d) were randomised by blocks into three groups: (1) placebo (n 25); (2) fast protein supplementation (F-PROT; n 25) and (3) slow protein supplementation (S-PROT; n 25) but all performing the exercise protocol. All measurements were repeated after 12 weeks of intervention (24–72 h after the last MPT session).
Interventions
Protein supplementation
PROT consisted of a daily ingestion of three doses of powder (10 g of proteins (322 kJ (77 kcal) per single dose)) from milk protein (casein or whey proteins containing high leucine concentration) provided by Lactalis©. The placebo consisted of maltodextrin and had the same weight, appearance, taste and number of energy content (322·168 kJ/dose (77 kcal/dose)). The F-PROT was composed of the whey protein, whereas the S-PROT consisted of the casein protein as detailed in Table 1. Supplements were taken every day (30 g) in three separate and equal drinks (powder + water) during meals (breakfast, lunch and dinner). More specifically, subjects were instructed to take the supplement at the end of the meals except during training days, where they were asked to ingest their morning dose in the hour following the training session, as recommended by Yang et al. (Reference Yang, Breen and Burd49). The dose and pattern of protein supplement distribution were based on results from Symons et al. (Reference Symons, Schutzler and Cocke50) and from our laboratory(Reference Filion, Barbat-Artigas and Dupontgand51). The treatment was assigned (slow, fast or control) to each subject’s number, based on a pattern that was kept blinded from the research personnel. The laboratory received the containers identified by the subject number and accompanied by a sealed individual envelope that contained the nature of the supplement. Envelopes were kept in a locked container, and codes were broken at the end of the study. All investigators and participants were kept blinded from the nature of the supplement until completion of data collection and analysis. Compliance was assessed by giving supplementation each month and by randomly assigning different quantity of powder (lower, equal or higher) to participants independently of the supplementation. Based on this amount, the staff knew when participant needed to come back to renew the prescription and could therefore control supplementation compliance.
Composition of the supplementation*

* Protein (slow and fast) and control nutrient composition in details (kJ, protein, carbohydrate and lipid) for fast protein (F-PROT), slow protein (S-PROT) and placebo (PLA) groups, respectively.
Mixed power training
The physical activity intervention was a power training programme mixed with functional exercises hence the name MPT. It consisted of 12 weeks of three non-consecutive sessions supervised by kinesiologists. All pre-intervention measurements were repeated at no more than 7 d following the last MPT session. The level of difficulty was controlled and adjusted (augmenting instability or increasing load) according to a modified Borg fatigue Scale (1–10)(Reference Tieland, Franssen and Dullemeijer42) and the observations made by the kinesiologists. Each training session began with a 10-min warm-up period (treadmill or ergocycle (1–3 on Borg Scale)) and ended with 10-min stretching exercises. The core of the training session was divided into two distinctive parts. The first part consisted of four high velocity loaded exercises: (a) leg curl; (b) chest press; (c) lateral pull down and (d) seated leg press. The participants were instructed to contract as fast as possible for the concentric phase and to slowly control the eccentric phase of each contraction under the supervision of the kinesiologists. The tempo resembled a 1-0-2-1 (1-s concentric, 0-s isometric, 2-s eccentric and 1-s rest between contractions). A 1-min rest was given between each set, and a maximum of 3 min was given between each exercise. A 1-maximal repetition (MR) test was conducted at weeks 2 and 6 to ensure that training intensity reached 80 % of the 1-MR (8–10 Borg Scale). The first 2 weeks were used as a habituation period, and participants performed three sets of 10–12 repetitions (intensity: first set at 3–5 Borg Scale and the two other sets at 6–8 Borg Scale). The following weeks, the participants performed the first set at 50 % of the 1-MR (3–6 on Borg Scale) and the two last sets at 80 % of the 1-MR (8–10 Borg Scale). From week 7, an additional set was added for each exercise. During the 12-week intervention, if they were able to complete all sets of twelve (not less) repetitions during three consecutive sessions and with the kinesiologist approval, the load was increased between 3 and 5 % of the previous load. The second part consisted of performing three sets of ten repetitions of six functional exercises that targeted posture and balance: (a) squats against the wall with a Swiss ball, (b) pelvis rotation on a Swiss ball, (c) shoulder external rotations, (d) stair (20 cm) climbing, (e) biceps curls with dumbbells and (f) bird-dog exercise (from a hands-and-knees position, one leg extends back, while the opposite arm extends forward). All functional exercises were performed at minimally 8 on the Borg Scale. In each part (power and functional), the exercises were performed randomly. As per protocol study design, subjects who accomplished <80 % (twenty-nine out of thirty-six sessions) of the training sessions were excluded from the study.
Anthropometric measurement and body composition
BM and standing height were determined using an electronic scale (Tanita 558) and a stadiometer (Seca), respectively. BMI was calculated as follow as: BM (kg)/height (m)2. Total body composition (LM (excluding bones) and FM) was measured by dual-energy X-ray absorptiometry (GE Prodigy Lunar). Participants were required to remove all jewels prior to being positioned on the dual-energy X-ray absorptiometry table. Scans were performed with subjects in fasting state (12 h) and in supine position. The entire body was scanned beginning at the top of the head and moving in a rectilinear pattern down the body to the feet. The regions of the body were automatically determined by the system region of interest(Reference Ramos, Azpeitia Armán and Arévalo Galeano52). The CV of this device, in vivo, is 0·8 % for fat percentage, 2·1 % for total FM and 1·5 % for total LM(Reference Boneva-Asiova and Boyanov53). The dual-energy X-ray absorptiometry was regularly calibrated throughout the study, and the same specialised technician carried out measurements.
Muscle function
Lower and upper limb muscle strength
Maximum voluntary handgrip strength was measured with a hand dynamometer with adjustable grip (Smedley-Type) as previously described(Reference Barbat-Artigas, Rolland and Cesari54). Participants were standing upright and were instructed to apply as much handgrip pressure as possible for at least 4 s, performing the test three times alternating the right and left hand with 1 min between each set. The maximum score was recorded and used for analyses. Maximum isometric knee extension strength was assessed using 1-MR with the leg press as previously described(Reference Verdijk, van Loon and Meijer55).
Lower limb muscle power
Lower limb (LL) muscle power was measured using the Nottingham Leg Extensor Power rig(Reference Bassey and Short56). The subject was seated and asked to push the pedal down as hard and fast as possible, accelerating a flywheel attached to an A-D converter(Reference Skelton, Kennedy and Rutherford57). Power was recorded for each push until a plateau/decrease was reached. This method of evaluating power is safe, sensitive and reliable in older adults(Reference Skelton, Kennedy and Rutherford57). In addition, based on the functional sit-to-stand test, a power index was also calculated using the Takai equation, which has been shown to be reliable, accurate and validated in older adults (see the equation below)(Reference Takai, Ohta and Akagi58).
 $${\rm{Takai\ equation}}:\ P = {{\left( {L - A} \right) \times BM \times g \times 10} \over T}$$
where P is the power (watts); L is the leg length (the distance from the greater trochanter of the femur to the lateral malleolus) (m); A is the height of the chair (m); g is the acceleration due to gravity (9·8 m/s2); 10 is the number of repetitions and T is the time to perform the test.
Muscle quality
LL MQ was calculated using the maximum knee extensor strength(Reference Verdijk, van Loon and Meijer55) (1-MR in kg) divided by the LL LM (kg) measured by dual-energy X-ray absorptiometry. This definition of MQ is commonly used in large-scale studies because of its relation with functional impairments(Reference Barbat-Artigas, Rolland and Cesari54,Reference Newman, Kupelian and Visser59) .
Functional capacities
Participants were asked to perform the 4 m walking test, the chair stand test and the balance test from the validated Short Physical Performance Battery(Reference Freire, Oliveira Guerra and Alvarado60) and the Timed Up & Go test and the stair climbing test from the Senior Fitness Tests battery(Reference Rikli and Jones61), which are assessments of physical and mobility functions for the elderly.
Blood metabolic profile
A 15-ml blood sample was collected following an overnight fast to assess fasting serum levels of biochemical and hormonal markers.
Glucose was measured using the glucose oxidase method(Reference Rosevear, Pfaff and Service62); insulin was measured using a human insulin ELISA kit (Mercodia ELISA assay; detection limit: 6 pmol/l per tube; intra-assay CV: 3·7 %). The homoeostatic model assessment of insulin resistance index was calculated using the formula: fasting serum insulin (pmol/l) × 0·167 × glucose (mmol/l)/22·5. The insulin sensitivity index was calculated with the quantitative insulin sensitivity check index (1/(log fasting insulin (µU/ml) + log glucose (mg/dl))).
Levels of total insulin-like growth factor-1 (IGF-1) (intra-assay CV: 5·9 (sd 0·6) %; detection limit: 0·03 ng/ml) and insulin-like growth factor-binding protein 3 (IGFBP3) (intra-assay CV: 3·9 (sd 0·4) %; detection limit: 0·14 ng/ml) were measured in a single assay using human ELISA kits (IGF-1 DG100; IGFBP3 DGB300) from R&D Systems Inc. The IGF-1:IGFBP3 molar ratio was calculated considering that 1 ng/ml IGF-1 = 0·130 nmol IGF-1 and 1 ng/ml IGFBP3 = 0·036 nmol IGFBP3.
Serum leptin (intra-assay CV: 5·5 (sd 0·5) %; detection limit: 0·5 ng/ml) and total adiponectin (intra-assay CV: 3·9 (sd 0·4) %; detection limit: 0·78 ng/ml) were also measured in a single assay using human ELISA kits (leptin EZHL-80SK; adiponectin EZHADP-61 K) from EDS Millipore.
Skeletal muscle characteristics
Muscle composition (peripheral quantitative computed tomography scan)
Peripheral quantitative computed tomography scan of the right leg was obtained using the Stratec XCT3000 (STRATEC Medizintechnik GmbH; Division of Orthometrix) at the 33 % distance of the femur, starting from the lateral epicondyle up to the greater trochanter. The total length was entered into the software as well as other scanning parameters, such as voxel size (0·5 mm) and speed (10 mm/s). All peripheral quantitative computed tomography scans were done by the same trained operators for peripheral quantitative computed tomography data acquisition following guidelines provided by Bone Diagnostics, Inc. Image quality was visually assessed following data acquisition by a second evaluator who analysed the data. The visual inspection rating scale classified all images as a rate up to 3, according to a previously reported visual scale of movement artifact(Reference Blew, Lee and Farr63). For image analysis, the freely available source code for the peripheral quantitative computed tomography density distribution plugin for BoneJ (version 1.3.11) was used(Reference Doube, Kłosowski and Arganda-Carreras64). BoneJ’s soft tissue analysis uses a 7 × 7 median filter to reduce noise. Soft tissue and bone area and density were defined according to the tissue thresholds selected. Muscular, bone, intramuscular adipose tissue and subcutaneous adipose tissue thresholds were defined based on parameters of a previous study(Reference Doube, Kłosowski and Arganda-Carreras64), and results were all provided automatically in the BoneJ analysis output. For muscle area, density and subcutaneous fat area, precision error ranges are reported to be between 2·1 and 3·7 %, 0·7 and 1·9 %, and 2·4 and 6·4 %, respectively, and for intramuscular adipose tissue area, the less accurate measure, varying from 3 to 42 %(Reference Frank-Wilson, Johnston and Olszynski65).
Muscle architecture (ultrasound)
Muscle architecture was measured by real-time ultrasound (Portable ultrasound – Sonosite Inc.). To standardise measurements, the length of the femur was measured and a mark was made at the lower third of the femur with a hypoallergenic pen (the same place used for muscle composition)(Reference Narici, Reeves and Morse66). Participants were seated with a knee angle of 90°, and the legs were relaxed. Three images were obtained using a 38 mm, 7·5 MHz probe. The probe was coated with a water-soluble transmission gel to provide acoustic contact without depressing the dermal surface and was positioned perpendicular to the dermal surface of the vastus lateralis (VL) muscle and oriented along with the median longitudinal plane of the muscle. Pennation angle, thickness and fibre length were measured in the VL. The sagittal plane sonographs of the VL were analysed by ImageJ software(Reference Narici, Reeves and Morse66).
Skeletal muscle biopsies (phenotype)
Skeletal muscle samples were obtained from the VL using Bergstrom needle biopsy(Reference Gouspillou, Sgarioto and Kapchinsky67). The biopsy was performed under local anaesthesia. Muscle histology was performed on solid pieces (50 mg), mounted on high-density plastic blocks in tragacanth gum and frozen in liquid isopentane cooled in liquid N2. Eight micron thick serial cross sections were cut in a cryostat at –18°C and mounted on lysine coated slides (Superfrost) to determine fibre type and mitochondrial content as previously described(Reference Gouspillou, Sgarioto and Norris68). Histology blocks were stored at –80°C until further analyses. The first two sections were immunolabelled for the different myosin heavy chains (MHC) as previously described(Reference Gouspillou, Sgarioto and Kapchinsky67,Reference Gouspillou, Sgarioto and Norris68) . The first cross sections of each muscle sample were used to immunolabel for MHC type I, IIA and IIX. These cross sections were first allowed to reach room temperature and rehydrated with PBS (pH 7·2). These sections were then blocked using goat serum (10 % in PBS) and incubated for 1 h at room temperature with the following primary antibody cocktail: mouse IgG2b monoclonal anti-MHC type I (BA-F8, 1:25), mouse IgG1 monoclonal anti-MHC type IIA (SC-71, 1:200), mouse IgM monoclonal anti-MHC type IIX (6H1, 1:200) and rabbit IgG polyclonal anti-laminin (Sigma L9393, 1:750). Muscle cross sections were then washed three times in PBS before being incubated for 1 h at room temperature with the following secondary antibody cocktail: Alexa Fluor 350 IgG2b (y2b) goat anti-mouse (Invitrogen, A-21140, 1:500), Alexa Fluor 594 IgG1 (y1) Goat anti-mouse (Invitrogen, A-21125, 1:100), Alexa Fluor 488 IgM goat anti-mouse (Invitrogen, A-21042, 1:500) and Alexa Fluor 488 IgG goat anti-rabbit (A-11008, 1:500). Muscle cross sections were subsequently washed three times in PBS, and slides were then cover slipped using Prolong Gold (Invitrogen, P36930) as a mounting medium. All primary antibodies targeting MHC were purchased from the Developmental Studies Hybridoma Bank (University of Iowa).
Confounding variables
Dietary intakes
As previously described and validated in the elderly population, dietary intake was assessed before and after the intervention using the 3-d food record method (two weekdays and one weekend day)(Reference Lührmann, Herbert and Gaster69) and participants were asked not to change their dietary habits during the intervention. Dietary analyses (total energy and protein intake (g/kg BM per d)) were completed by a nutritionist using the CANDAT SYSTEM version 5.1 software (CANDAT, USDA Food file (USDA SR28) & Canadian Food file (CNF2015))(Reference Lührmann, Herbert and Gaster69).
Physical activity level and frequency
Participants wore a tri-axial accelerometer (Sensewear armband by BodyMedia©) on their arm (at the mid-humerus level) for seven consecutive days as recommended(Reference Jakicic, Marcus and Gallagher70–Reference Welk, McClain and Eisenmann72). This is the ‘gold standard’ portable instrument to measure the number of steps per d, sleeping hours, inactive hours (hours spent in sedentary position; defined as an absence of motion and acceleration captured by the two-axis micro-electro-mechanical sensors) and also to indicate the intensity of physical activity (such as physical activity periods over three metabolic equivalents). The device captures data through a two-axis accelerometer and heat flux, galvanic skin response, skin temperature and near-body ambient temperature sensors. The data like sex, age, body weight, height, handedness and smoking status were entered into the software (Armband Sensewear Standard Software 8.0).
Sample size and statistical analysis
Based on the literature and according to the studied population and our intervention, a difference of 20 kg(Reference Verdijk, Jonkers and Gleeson73,Reference Goodpaster, Chomentowski and Ward74) for LL MS was expected between groups after the intervention. Using G*Power Software, it was determined that a total of sixty participants divided equally into three groups was required to achieve a power of 80 %, with an alpha error of 0·05, at the end of the study. Based on our previous studies(Reference Irwin, Yasui and Ulrich75,Reference Aubertin-Leheudre, Lord and Khalil76) , it was predicted that the dropout rate would be 20 %; hence, seventy-five participants were enrolled.
We used the general linear model approach which corresponds here to a two-factor repeated-measures ANOVA to test the intervention effect (time effect) and the protein supplementation effect (group effect) and their interaction (time × group effect). Fibre size was analysed using a similar general linear model approach with three-factor (time, group and fibre type) repeated-measures (subjects) ANOVA. Fibre-type proportion was analysed using a two-way Repeated Ordinal Regression. The main effect of each independent variable (time and group) was tested, as well as the effect of the interaction. Bonferroni post hoc analyses were performed on all significant effects (i.e. for intervention, protein, fibre size, fibre-type proportion and interactions). Finally, delta changes (i.e. ((post − pre)/pre) × 100, expressed in %) are provided in each table for the clinical significance of the intervention.
Results of the present per-protocol study are presented as mean values and standard deviations, and a P < 0·05 was considered statistically significant. Analyses were performed using R 3.6.2 software (R Core Team) with Rstudio software 1.2.5033.
Results
Participant’s characteristics
The dropout rate of the study was around 20 %, as expected(Reference Verdijk, Jonkers and Gleeson73,Reference Goodpaster, Chomentowski and Ward74,Reference Aubertin-Leheudre, Lord and Khalil77,Reference Labonté, Dionne and Bouchard78) (i.e. mostly for personal reasons, including lack of time and personal family issues). None of the participants dropped because of injuries, lack of enjoyment or perceived level of difficulty (intensity) related to the MPT. At the end of the study, groups were composed as follows: (1) placebo with MPT (PLA; n 19, 70·7 (sd 8·6) years); (2) F-PROT with MPT (n 21, 68·3 (sd 5·3) years) and (3) S-PROT with MPT (n 20, 69·0 (sd 6·1) years) (Fig. 1). There were no differences in age amongst participants of the three groups (one-way ANOVA, group effect: 0·53). As displayed in Table 2, there was a significant time effect (P = 0·01) and a time × group effect (P = 0·006) for BMI but not between groups, at pre- and post-intervention. Furthermore, no difference in the daily number of steps, dietary protein intake and energy intake were observed indicating that all participants maintained their lifestyle habits (Table 2).
Study design – this figure describes the design of the study including the recruitment, all pre- and post-intervention tests and the interventional attrition in each group. PT, power training; F-PROT, fast proteins; S-PROT; slow proteins; PLA, placebo.

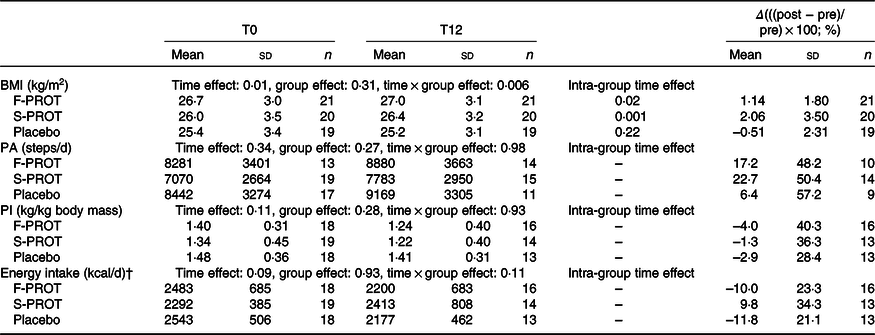
* PA (physical activity in numbers of steps/d measured with a tri-axial accelerometer), PI (protein intake in kg/kg body mass measured with a 3-d food dietary record) and energy intake (per d in kcal measured with a 3-d food dietary record) of participants of fast protein (F-PROT), slow protein (S-PROT) and placebo groups (group effect) pre (T0) and post (T12) intervention (time effect), Δ (differences between post and pre values divided by pre value and expressed in %). Two-factor repeated-measures ANOVA to test the intervention effect (time effect) and the protein supplementation effect (group effect) and their interaction (time × group effect).
† To convert kcal to kJ, multiply by 4·184.
Anthropometric measurement and body composition
As shown in Table 3 and Fig. 2, a time effect was observed on total and trunk FM (% or kg) as well as on total and LL LM (kg). No group effect could be evidenced. A time × group effect was observed only on trunk FM (in kg; P = 0·01). Interestingly, only the control group displayed a significant and clinically meaningful (>5 %) decrease in trunk FM (P < 0·001).

F-PROT, fast protein, S-PROT, slow protein; placebo groups, (group effect) pre (T0) and post (T12) intervention (time effect); Δ, differences between post and pre values divided by pre value and expressed in %; FM, fat mass; LM, lean mass; LL, lower limb.
* Two-factor repeated-measures ANOVA to test the intervention effect (time effect) and the protein supplementation effect (group effect) and their interaction (time × group effect).
Effect of 12 weeks of power training (with fast, slow or without protein) on body composition – results pre- and post-intervention for fast proteins (F-PROT), slow proteins (S-PROT) and control for (a) total fat mass (FM); (b) trunk FM; (c) total lean mass (LM) and (d) lower limb LM. Data are mean values and standard deviations. * Significant difference (P < 0·05) between pre and post tests within groups using general linear model (GLM) repeated measures (2 × 2) and post hoc Bonferroni. ** Significant difference (P < 0·01) between pre and post tests using GLM repeated measures (2 × 2) and post hoc Bonferroni. ![]() , F-PROT (pre);
, F-PROT (pre); ![]() , S-PROT (pre);
, S-PROT (pre); ![]() , placebo (pre);
, placebo (pre); ![]() , F-PROT (post);
, F-PROT (post); ![]() , S-PROT (post);
, S-PROT (post); ![]() , placebo (post).
, placebo (post).

Muscle function
A time effect was observed for handgrip strength (kg) as well as for LL strength and quality (Fig. 3 and Table 4). However, no group or group × interaction differences could be evidenced observed (P > 0·05) (Fig. 3 and Table 4). Importantly, all groups displayed a clinically meaningful increase in their LL strength and quality (delta > 15 %; see Table 4).
Effects of 12 weeks of power training (with fast, slow or without protein) on muscle function – results pre- and post-intervention for fast proteins (F-PROT), slow proteins (S-PROT) and control for (a) handgrip strength (Newtons: N); (b) lower limb (LL) strength (N); (c) LL muscle quality (N/leg lean mass (kg)) and (d) LL strength index (N/body mass (kg)). Data in the graphs are mean values and standard deviations. * Significant difference (P < 0·05) between pre and post tests within groups using general linear model (GLM) repeated measures (2 × 2) and post hoc Bonferroni. ** Significant difference (P < 0·01) between pre and post tests using GLM repeated measures (2 × 2) and post hoc Bonferroni. ![]() , F-PROT (pre);
, F-PROT (pre); ![]() , S-PROT (pre);
, S-PROT (pre); ![]() , placebo (pre);
, placebo (pre); ![]() , F-PROT (post);
, F-PROT (post); ![]() , S-PROT (post);
, S-PROT (post); ![]() , placebo (post).
, placebo (post).


F-PROT, fast protein; S-PROT, slow protein; placebo groups, (group effect) pre (T0) and post (T12) intervention (time effect); Δ, differences between pre and post values divided by pre value and expressed in %; BM, body mass; LM, lean mass; LL, lower limb.
* Two-factor repeated-measures ANOVA to test the intervention effect (time effect) and the protein supplementation effect (group effect) and their interaction (time × group effect).
Functional capacities
With the exception of the balance test, all groups displayed significant improvement on the functional evaluations including the stair test, chair stand test, Timed Up & Go test as well as in their gait speed during a 4-m walking test (time effect; see Fig. 4 and Table 5). All of these improvements were clinically meaningful (>5 %). However, no group or group × time effects were observed (P > 0·05; Table 5).
Effect of 12 weeks of power training (with fast, slow or without protein) on functional capacity – results pre- and post-intervention for fast proteins (F-PROT), slow proteins (S-PROT) and control for the (a) 4-m walking test, (b) stair test, (c) balance test, (d) Timed-up & Go test and (e) chair-stand test. Data in the graphs are mean values and standard deviations. * Significant difference (P < 0·05) between pre and post tests within groups using general linear model (GLM) repeated measures (2 × 2) and post hoc Bonferroni. ** Significant difference (P < 0·01) between pre and post tests using GLM repeated measures (2 × 2) and post hoc Bonferroni. ![]() , F-PROT (pre);
, F-PROT (pre); ![]() , S-PROT (pre);
, S-PROT (pre); ![]() , placebo (pre);
, placebo (pre); ![]() , F-PROT (post);
, F-PROT (post); ![]() , S-PROT (post);
, S-PROT (post); ![]() , placebo (post).
, placebo (post).


F-PROT, fast protein; S-PROT, slow protein; placebo groups, (group effect) pre (T0) and post (T12) intervention (time effect); Δ, differences between pre and post values divided by pre value and expressed in %; nb, number; rep, repetition.
* Two-factor repeated-measures ANOVA to test the intervention effect (time effect) and the protein supplementation effect (group effect) and their interaction (time × group effect).
Blood metabolic profile
As shown in Table 6, a time effect was observed on serum insulin and total adiponectin levels and on the quantitative insulin sensitivity check index and homoeostatic model assessment of insulin resistance indexes. No group effect was observed on serum metabolic profiles except for total IGF-1 levels. A time × group effect was observed only for the quantitative insulin sensitivity check index. More specifically, only the placebo group displayed an increase in an index of insulin sensitivity (quantitative insulin sensitivity check index; +7 %; P = 0·0005) (Table 6).
Blood characteristics of the participants*
(Mean values and standard deviations; numbers)

QUICKI, quantitative insulin sensitivity check index; HOMA-IR, homoeostasis model assessment-insulin resistance; IGF-1, insulin-like growth factor-1; IGFBP3, insulin-like growth factor binding protein-3; Δ, differences between post and pre values divided by pre value and expressed in %.
*Fifteen millilitre blood sample was collected following an overnight fast. Serum levels of insulin and glucose were measured, using ELISA© and glucose oxidase assay, respectively. These values were used to calculate the QUICKI and HOMA-IR indexes (with the formulas: (1) fasting serum insulin (pmol/l) × blood × blood sample was collected following an overni(log fasting insulin (µU/ml) + log glucose (mg/dl)), respectively). Serum total adiponectin, leptin, total IGF-1 and IGFBP3 were measured by ELISA and were used to measure IGF-1:IGFBP3 molar ratio. Data were obtained from participants of fast- (F-PROT) and slow-digested protein (S-PROT) and placebo groups (group effect) pre (T0) and post (T12) intervention (time effect). Two-factor repeated-measures ANOVA to test the intervention effect (time effect) and the protein supplementation effect (group effect) and their interaction (time × group effect).
Skeletal muscle characteristics
Composition (computed tomography scan)
No differences in muscle composition were observed (Table 7). A time × group effect for total and subcutaneous fat area was observed. Post hoc analyses revealed that the F-PROT group displayed increases in total and subcutaneous fat area (Table 7).
Skeletal muscle composition characteristics of the participants*
(Mean values and standard deviations; numbers)

* Measured with peripheral quantitative computed tomography (pQCT). Data were obtained from participants of fast protein (F-PROT), slow protein (S-PROT) and placebo groups (group effect) pre (T0) and post (T12) intervention (time effect). Δ: differences between post and pre values divided by pre value and expressed in %. Two-factor repeated-measures ANOVA to test the intervention effect (time effect) and the protein supplementation effect (group effect) and their interaction (time × group effect).
Architecture (ultrasounds)
Regarding muscle architecture, only a time effect on VL thickness is observed (P = 0·04; see Table 8).
Skeletal muscle architecture characteristics of the participants*
(Mean values and standard deviations; numbers)

VL, vastus lateralis.
* Measured by real-time ultrasound. Data were obtained from participants of fast protein (F-PROT), slow protein (S-PROT) and placebo groups (group effect) pre (T0) and post (T12) intervention (time effect). Δ, differences between post and pre values divided by pre value and expressed in %. Two-factor repeated-measures ANOVA to test the intervention effect (time effect) and the protein supplementation effect (group effect) and their interaction (time × group effect).
Phenotype (skeletal muscle biopsies)
To portray muscle phenotype, VL cross sections obtained from all participants who underwent a biopsy were immunolabelled for the three MHC isoforms expressed in human muscles. Using a three-factor (time, group and fibre type) repeated-measures ANOVA, a time effect (P < 0·0001), no group effect (P = 0·44), a fibre-type effect (P < 0·0001), a time × fibre-type effect (P < 0·0001), a group × fibre-type effect (P < 0·0001), a time × group effect (P < 0·0001) and a time × group × fibre-type effect (P < 0·0001) were observed. As can be seen in Table 9, no between-group difference in fibre size was observed and this, regardless of fibre types, after the intervention. MPT significantly increased the overall fibre size in all groups. All groups displayed an increase in type I fibre size after the intervention. Type IIA fibre size only increased in the S-PROT and placebo groups, while type IIX fibre size only increased in the S-PROT group (Table 9).
Skeletal muscle fibre size of the participants‡
(Mean values and standard deviations; numbers)

* Significant difference between F-PROT and S-PROT
† Significant difference between placebo and S-PROT, P < 0·05.
‡ Measured by vastus lateralis biopsies. Data were obtained from participants of fast protein (F-PROT, n 7), slow protein (S-PROT, n 7) and placebo (n 3) groups pre and post intervention. Fibre size is represented as minimal Feret’s diameter (µm). Two-factor repeated-measures ANOVA to test the intervention effect (time effect) and the protein supplementation effect (group effect) and their interaction (time × group effect).
In our ordinal regression model to assess the impact of our intervention on fibre-type proportion (see Fig. 5), only a significant time × group effect was observed (P < 0·0001). All groups had a similar fibre-type proportion at T0. No effect of the intervention on fibre-type proportion was observed in our F-PROT (n 7; I 57 %, I/IIA 0 %, IIA 32 %, IIA/IIX 5 %, IIX 6 % at T0 and I 58 %, I/IIA 0 %, IIA 34 %, IIA/IIX 3 %, IIX 4 % at T12) and Control (n 3; I 61 %, I/IIA 0 %, IIA 29 %, IIA/IIX 7 %, IIX 3 % at T0 and I 60 %, I/IIA 3 %, IIA 32 %, IIA/IIX 1 %, IIX 3 %) groups. However, there was a significant shift in the S-PROT group (P < 0·0001; n 7; I 52 %, I/IIA 1 %, IIA 36 %, IIA/IIX 8 %, IIX 3 % at T0 and I 48 %, I/IIA 0 %, IIA 42 %, IIA/IIX 5 %, IIX 4 % at T12). At the end of our intervention, a significant difference in fibre-type proportion between S-PROT and placebo groups (P = 0·04) was observed. It is however important to note that care should be taken in the interpretation of this result due to our small sample size in our placebo group (n 3).
Effects of 12 weeks of power training with fast (F-PROT), slow (S-PROT) or without (control) protein supplementation on muscle fibre-type proportion – Results pre- and post-intervention for F-PROT, S-PROT and control in type I, type I/IIA, type IIA, type IIA/IIX and type IIX fibre from vastus lateralis muscle biopsies. Data in the graphs are presented as percentages. Two-factor repeated-measures ordinal regression model to test the intervention effect (time effect) and the protein supplementation effect (group effect) and their interaction (time × group effect). * Significant difference (P < 0·05) between S-PROT and placebo groups. *** Significant difference (P < 0·001) between pre- and post-intervention within groups. ![]() , Type/IIX;
, Type/IIX; ![]() , type/IIA/IIX;
, type/IIA/IIX; ![]() , type/IIA;
, type/IIA; ![]() , type I/IIXA
, type I/IIXA ![]() , type I.
, type I.

Discussion
The aim of this study was to investigate if combining fast protein supplementation with MPT results in greater improvement in MF and functional capacities than combining slow protein with MPT or using MPT alone in older men. Surprisingly and contrary to our initial hypothesis, results showed that adding either slow or fast protein supplementation to MPT did not provide any extra benefit as compared with MPT intervention alone in these healthy older men. These results are in line with the review by Kim et al. (Reference Kim, Wilson and Lee23) that reported persisting controversies regarding protein supplementation and strength training. The present results are also supported by several studies showing that, for older individuals who already had a sufficient initial protein intake, taking protein supplementation for 12 weeks, while doing strength training, does not affect the rate of change in MS and lean BM(Reference Haub, Wells and Tarnopolsky44,Reference Candow, Chilibeck and Chad79) . Furthermore, Godard et al.(Reference Godard, Williamson and Trappe80), Walrand et al.(Reference Walrand, Short and Bigelow81) and Welle & Thornton(Reference Welle and Thornton82) showed no beneficial effect of protein supplementation during exercise training in cohorts of elderly men and women. On the other hand, the present results differ from the bulk of evidence showing that combining protein supplementation and training is more efficient for increasing muscle mass and MS in elderly people than training alone(Reference Paddon-Jones, Sheffield-Moore and Zhang24,Reference Benton, Wagner and Alexander31,Reference Filion, Barbat-Artigas and Dupontgand51,Reference Omura83–Reference Cermak, Res and de Groot86) . A meta-analysis conducted by Liao et al.(Reference Liao, Tsauo and Wu45) also concluded that combining resistance training and protein supplementation may have stronger effects in preventing the ageing-related loss of muscle and strength in elderly individuals than both interventions alone. These apparent discrepancies might be explained by differences in participants’ characteristics at baseline (age, health status, etc.) and protein intake (type, amount, time of the day, etc.)(Reference Benton, Wagner and Alexander31,Reference Morais, Chevalier and Gougeon84) . An important factor that could contribute to the lack of additional effects of protein supplementation reported in the present study is that participants already had a high protein intake at baseline (1·35 (sd 0·3) g/kg BM per d). This initial protein intake is well above the RDA (0·8 g/kg BM per d) and is even above that of the European consensus for elderly (1·2 g/kg BM per d)(Reference Katsanos, Kobayashi and Sheffield-Moore37). The present results suggest that when older individuals consume enough protein in their diet, regardless of the type, adding more does not potentiate the effect of training(Reference Omura83).
Moreover, recent studies have shown that an increase in the anabolic threshold towards the stimulatory effect of amino acids is part of the anabolic resistance of muscle protein anabolism to food(Reference Dardevet, Rémond and Peyron87). In other words, even if an adequate amount of amino acids is consumed, alterations in signalling pathways due to ageing can lead to anabolic resistance resulting in less muscle protein deposition(Reference Dardevet, Rémond and Peyron87). This suggests that the total amount of protein ingested at each meal may not have reached that anabolic threshold in the present studied population. Alternatively, the necessary amount of protein may have been already reached with dietary protein alone, and supplementation could not add any further stimulation for protein anabolism.
The present study showed that total FM decreased significantly in the No-PROT group following MPT intervention. Similar results were observed by O’Leary et al. (Reference O’Leary, Marchetti and Krishnan88) in sixteen men and women participating in a 12-week supervised exercise programme (5 d/week, 60 min/d, treadmill/cycle ergometer at 85 % of heart rate maximum). LM, MS, MQ and general fibre size of the LL were significantly improved in all groups which is analogous to the results of Miszko et al. (Reference Miszko, Cress and Slade20) obtained from thirty-nine elderly men and women following a 16-week MPT programme (three sessions/week). Of note, among the muscle characteristics measurements, no significant changes were observed, except for the VL thickness by ultrasound. It is likely that we did not have enough power to find differences at that level. More importantly, we report here that functional capacities improved significantly in all groups for the 4 m walking, chair stand, Timed up & Go and stair-climbing tests. Considering that gait speed is a strong predictor of mortality(Reference White, McCoy and Castellano89), this finding is of great clinical relevance.
The present findings support the observations of Reid et al.(Reference Reid, Callahan and Carabello48) that suggested that MPT seems to be efficient for improving functional capacities and MQ. Moreover, Reid et al. (Reference Reid, Callahan and Carabello48) showed that even if MPT and resistance training had comparable beneficial impacts on absolute MS and power in older women, MPT elicited greater improvement in the specific peak power during leg press. These results suggest that MPT had a greater impact on MQ, likely through neuromuscular adaptations(Reference Reid, Callahan and Carabello48). MPT therefore represents the best non-pharmacological intervention that could reduce healthcare costs related to the risk of falls, fractures and physical disabilities(Reference Hughes, Frontera and Wood3,Reference Goodpaster, Park and Harris4,Reference Clark and Manini90,Reference Janssen91) , which increase with ageing(Reference Jakobsen, Rask and Kondrup8,Reference Sasaki, Kasagi and Yamada9) .
Regarding our hormonal measurements, insulin decreased in all groups suggesting a lesser insulin resistant state with MPT as evidenced by the indices used. Such improvement carries health benefits to older adults who are at increased risks of CVD as insulin resistance is at the basis of this greater risk(92). Other hormones (adiponectin, leptin, IGF-1 and binding proteins) were not significantly affected by the intervention which may be explained in part by an insufficient statistical power for these specific outcomes.
An important strength of this study is that it was the first to compare the type of protein supplementation (fast v. slow) in addition to MPT in older men together with clinical and biological measurements of MF. Moreover, the nature of the double-blinded randomised controlled design of this study eliminated several possible biases. Hopefully, our findings would stimulate interest for further research about protein supplementation and MPT in older adults. More research in older populations and employing other types of proteins should be used to confirm our results and help to investigate the mechanisms underlying the potential effects of MPT with and without protein supplementation. However, the present study has some limitations. Firstly, the cohort was composed of healthy non-frail men aged over 60 years, which means that our findings are applicable to this population only and therefore may not be generalisable to others. Secondly, there was a lack of statistical power for some of the outcomes due to our sample size in each group. Lastly, the baseline relatively high dietary protein intake of the participants combined to the fact that they were healthy could also have influenced our findings. Thus, further randomised controlled trial including older adults of differencing health states and adapted to lower or normal initial protein intake (0·8–1·2 g/kg BM per d) should be carried out to further validate our results.
Conclusions
Our results show that a 12-week MPT intervention is efficient in improving body composition, MF (strength and quality) and functional capacities in healthy older men. However, our results also indicate that providing 3 × 10 g of protein supplement per d, of either fast or slow digestibility, to participants already ingesting a relatively high amount of proteins does not add any extra benefit to MPT. Our findings indicate that MPT could be an easy, affordable and practical tool for clinicians to improve MF and overall physical health in older men already ingesting an adequate amount of protein.
Acknowledgements
The authors are grateful to Carole Roy for her technical assistance, as well as to all the participants who consented to be part of the study. The authors also thank all kinesiologists who performed the training programme.
This work was supported by grants from the FRQS (Fonds de Recherche du Québec – Santé), RQRV (Réseau Québécois de Recherche sur le Vieillissement) and GRAPA-UQAM (Groupe de Recherche en Activité Physique Adaptée – Université du Québec à Montréal). Mylène Aubertin-Leheudre was supported by the FRQS.
C. H. P., M. B., G. G. and M. A. L. designed the research. C. H. P., F. C. L. and G. E. H. B. conducted the research. M. C. D., C. H. P., L. P. C., P. N. and M. A. L. analysed the data. M. C. D., P. N., G. G. and M. A. L. wrote the paper. M. C. D., C. H. P., L. P. C., P. G., S. C., J. A. M., P. N., G. G. and M. A. L. edited the paper. M. A. L. supervised the project.
The authors declare that there are no conflicts of interest.


