


Excessive consumption of Na can lead to the development of hypertension and subsequent risk for CVD, stroke and other metabolic conditions(Reference Meneton, Jeunemaitre and de Wardener1–Reference Buttar, Li and Ravi4). South Africa has high hypertension rates, and trends over time revealed this prevalence is increasing, with higher risk among males, those that identify as black, live in an urban area and those with self-reported high blood cholesterol(Reference Mungal-Singh5,Reference Kandala, Nnanatu and Dukhi6) . These increasing hypertension rates in South Africa have resulted in increased stroke and CVD, adding a major strain to the healthcare system and to the government health budget(Reference Pestana, Steyn and Leiman7).
As most dietary Na in South Africa comes from packaged and prepared foods such as breads, dried and processed meats, and ultra-processed snack foods, the reduction of Na in these products can be an effective strategy to reduce overall consumption of Na and risk of CVD. Thus, in response to the increasing concern over consumption of these foods, in 2013 the South African National Department of Health passed new mandatory regulation limits on the quantity of Na used in selected processed foods to be implemented starting in 2016(8,Reference Webster, Santos and Hogendorf9) . This regulation, called the Reduction of Sodium in Certain Foodstuffs and Related Matters, set a maximum total Na content for certain packaged food products, for thirteen food categories (Table 1). The Na reduction goals were targeted across several industrially produced food categories that utilised high Na levels in their products. Mandatory guidelines for Na levels limited specific foods with high consumption rates in South Africa, including bread, margarine and soup mixes. It had a phased approach whereby the food manufacturers were instructed to reduce Na levels in two waves by end of June 2016 and end of June 2019. For certain processed meat products, the limits were revised and the implementation date were amended to 30 April 2020.
Table 1. Food groups and sodium targets under regulations relating to reduction of sodium in certain foodstuffs and related matters of 2013 (R.214) and amendments (no.989 of 2016; no.1071 of 2017; no.812 of 2019) in South Africa

By implementing this Na reduction, South Africa is one of the first countries in the world (followed by Argentina in December 2013) to regulate Na consumption at the manufacturing level for several commonly consumed industrially produced foods(10). The food environment within South Africa is rapidly changing, with cheaper, energy-dense, ultra-processed and unhealthy food options becoming the food of choice for many(Reference Temple and Steyn11–Reference Armstrong, Lambert and Lambert14). A recent study by Charlton et al. reported that the population Na intake of South Africans reduced by 1·16 g salt per d between 2015 and 2018/early 2019, with the median salt intake in their sample group being 6·1 g of salt per d after the first phase of the Na reduction strategy(Reference Charlton, Corso and Ware15). The same study found that younger people had substantially higher salt intakes than older adults, with a median salt intake of those aged 18–49 years estimated to be 7·8 g/d(Reference Charlton, Corso and Ware15). However, no studies have shown how the reformulation of these food products changed Na consumption, without the influence of behaviour change due to increased awareness of the regulation or rising CVD rates. Furthermore, studies should consider the potential for these reformulations among younger, low-income, high packaged and processed food consumers, as the regulation may have a higher impact on the Na consumption and subsequent health implications in these populations.
To bridge the existing research gaps regarding the effects of Na regulations on low-income subpopulations, the objective of this study is to evaluate the changes in Na intake among young adults aged 18–39 years residing in a low-income township in the Western Cape, both before and after the Na regulation was implemented in 2016. By applying food composition tables (FCT) reflecting formulation of packaged and ultra-processed foods, we estimated how the Na regulation resulted in reformulation of foods and thus changes in Na intake, not accounting for changes in knowledge and subsequent nutrition-related behaviours. Given the anticipated reformulation of products containing an excessive amount of Na that are known to be highly consumed in this population, we hypothesised that there will be a significant reduction in the consumption of Na in this population due to the reformulation of packaged foods.
Methods
Updating sodium content in food composition tables
Previous work has found that an estimated two-thirds of packaged foods in the South African Food Composition Database were reformulated to comply with the maximums set in the first phase of the regulation(Reference Peters, Dunford and Ware16–Reference van der Westhuizen, Frank and Karim18). To update the FCT for the country and assess the Na contents of foods, The South African Food Data System (SAFOODS) division of the South African Medical Research Council (SAMRC) directly sourced nutrient data via food company representatives. Locally accredited food laboratories chemically analysed data were used for updating the FCT with newer Na values and other components. Standardised food compilation data quality assurance methods were applied to these data prior to updating the values in the FCT used in this analysis: the 2017 FCT which represents the Na content of foods pre-regulation which were finalised prior to the 2016 regulation implementation date, and the 2021 version which represents the Na content of foods post-regulation(19,20) . Data from nutrient facts panels or labels were not used to update the nutrient information in either version of the FCT.
24-h recall collection
We analysed single-day 24-h dietary recalls from a cross-sectional survey of young township adults aged 18–39 years living in the lower income Langa township near Cape Town, South Africa. Data for this analysis were collected in February–March 2018 (n 2148). All participants gave written, informed consent to participate in the dietary recalls, which were collected as part of an evaluation of another policy change. Systematic door-to-door sampling was conducted and one randomly selected consenting adult between the ages of 18–39 years per household was included in the study. The interviewer-administered household questionnaire was completed digitally using android phones and included a geolocation. For the diet assessment, 24-h diet recalls were conducted by interviewers with nutrition training. Individual participants reported what foods and drinks were eaten, how foods and beverages were prepared, whether anything was added and the quantity consumed. Data collectors did not prompt about addition of salt in meals at the table or in the cooking process. A multiple-pass approach, including detailed prompting, was used to enhance completeness. Only one diet assessment was completed for one individual within a given household.
Dietary recalls were coded by trained data capturers with high levels of previous nutrition experience. The SAMRC Food Quantities Manual and Composition Tables were used for coding. An extensive assumptions manual was developed to ensure coding decisions were made in a standardised manner.
Analytical approach
All analyses were conducted in Stata, version 16. Our key outcome variable was change in mg of Na for all foods reported in the 24-h recalls. By linking 2018 dietary intake data only to FCT created to reflect the pre-regulation period and then separately to the post-regulation period, we are able to calculate changes in Na intake due to reformulation, not behaviour change (since we are keeping the diet data consistent). Specifically, Na content of foods reported were compared with Na contents using the two versions of the South African Food Composition Database. Differences in nutrient values were statistically tested with paired t tests to compare the mean Na values of this sample between the two time points. Subgroup analyses were performed to look at changes in Na consumption specifically among participants that were identified as ‘high’ consumers of Na in the pre-regulation period. High consumers were defined as those that consume more than the WHO recommended 2000 mg of Na per d(21).
Results
Changes in reported intake
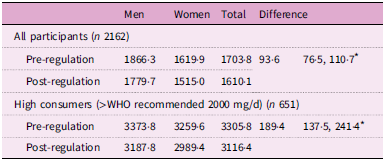
Using the 2021 FCT values (representing Na values post-regulation), the mean estimated Na intake was 1780 mg per d for men and 1515 mg per d for women. This is a decrease from the 1866 mg/d for men and 1620 mg/d for women when applying the pre-regulation FCT values (representing Na values pre-regulation). The mean estimated Na intake measured using pre-regulation and post-regulation values was under the recommended maximum intake of 2000 mg per d set by the WHO and the South African government for both men and women (Table 2). Between pre-regulation and post-regulation, there was a statistically significant decrease in the estimated Na intake among adults of 93·6 mg (76·5, 110·7; P = 0·00).
Table 2. Mean change in sodium intake values (mg) for men and women in one township in Western Cape, South Africa

* Indicates statistical significance (P < 0·05).
Thirty per cent of respondents reported consuming more than the recommended 2000 mg before the implementation of the regulation. Among this population of high Na consumers, the mean estimated Na intake was 3188 mg per d for men and 2989 mg per d for women, as opposed to pre-regulation values of 3374 mg/d for men and 3260 mg/d for women. Between pre-regulation and post-regulation, there was a statistically significant decrease in the estimated Na intake among high Na consumers of 189·4 mg (137·5, 241·4; P = 0·00).
Changes by food category
In our study population, the food sub-categories that contributed the most amount of Na in the diet were Russians, instant noodles, soup from powder mixes, grilled sausages and brown bread (Table 3).
Table 3. Difference in sodium consumption (mg) by applying pre- and post-regulation food composition table sodium values to same dietary intake data

In comparing the values from the pre- and post-regulation FCT, the Na content from salami meat and in certain types of soup powder was on average 9 to 10 per cent lower, and nuts and seeds had a 10 to 33 per cent lower Na content (given that they were classified as a savoury snack under the regulation). We found that cereal products overall had a 16 % reduction in Na values driven by vast reduction in certain branded products. As an example, Rice Crispies in the pre-regulation FCT reported 1323 mg per 100 g, whilst newer reference values listed in the 2021 FCT reported 330 mg per 100 g, which is approximately four times more Na in earlier years reported by the manufacturer. Na content in other categories of foods had not changed significantly.
Discussion
When we applied Na values from FCT reflecting the pre- and post-Na regulation period to dietary intake data from a low-income adult population, we observed a statistically significant difference in estimated Na intakes due to reformulation of packaged and ultra-processed foods. This study was done as a theoretical assessment to postulate effects of the regulation on Na intake, so there are limitations in interpretation. Awareness of the Na regulation could change food choice and consumption behaviours, which could be assessed with diet recalls performed before and after the implementation of the regulation on the same individuals. Our conclusions show that independent of any behavioural changes on the part of consumers, it is possible to lower Na intake by using regulations to induce food manufacturers to lower the Na levels in their products. We also showed that a policy such as this regulation may have a greater impact for high Na consumers.
A modelling study that informed the design of the Na legislation in South Africa estimated that reducing current daily Na intake by 850 mg per person, per day was a clinically relevant amount to show a decrease in cardiovascular mortality on a population level(Reference Bertram, Tollman and Hofman22). Although we observed a decrease between 93·6 and 189 mg of Na, the values we saw represent an underestimation of the true Na intake in this population because addition of table salt was not prompted during the collection of the 24-h dietary recalls. For the 2017 FCT representing pre-implementation values, most values were updated after 2013 when the regulation was announced. The comparisons may underestimate the true level of change as ‘early adopted’ companies may have reformulated shortly after the publishing of the draft regulations. Many FCT codes represent composite values of many foods – including some that are a mix of regulated (e.g. grilled sausage) and unregulated products (boerewors) which limits our ability to observe accurate changes in Na. Additionally, updates to the Na contents of the 2021 FCT excludes recipes and foods prepared outside the home, which include highly consumed items such as chips (French fries). Furthermore, because differences in behaviour were not assessed, we cannot tell if participants in the post-regulation period might have made up for the loss of Na in packaged foods by adding salt at the table. However, the differences in Na intake observed specifically from the consumption of packaged and ultra-processed food intake (93·6 overall and 189·4 in high consumers) will likely be similar if these behaviour changes were introduced.
Conclusion
Subsequent to South Africa becoming the first sub-Saharan African country to implement such a Na regulation, other countries around the world are exploring similar strategies to reduce the growing rates of hypertension and CVD. Our findings suggest that regulatory approaches to induce manufacturers to reduce Na in their products can be a useful tool for improving population health. This work can add to that body of evidence, to inform policies to improve this imbalance in the food system in similar contexts.
Acknowledgements
The authors wish to thank Ria Laubscher for exceptional assistance with the data management. The authors also want to thank Chuma Maqina, Kelly Leman Scott, Sarona Munyai, Sikhumbule Joni, Lamla Sajini, Sisa Honesi Martins, Olwethu Mateta, Siyabulela Mditshwa, Andiswa Magwaza, Abongwe Benge, Ayakha Sigwabe, Masingita Nyalungu, Namhla Baskiti, Andisiwe Siramza, Siphesihle Thotsho, Nomhle Poni and Ntombizodwa Nako for dietary intake and anthropometry collection, as well as Mawande Nelani, Pamela Magubane, Emmanuel Obasa, Zukiswa Mfinyongo, Ziyanda Lufele, Zikhona Lobola, Asisipho Majongile, Nqabakazi Majeke, Yanga Gadu, Busiswa Mqhayi, Priscilla Nkhensani, Thandokazi Magqaza, Onele Maqambayi, Nonelwa Ngcingane, Tembakazi Msutwana, Sisipho Mabaso, Chumani Matiwane, Akhona Rasmeni and Sisipho Mngqnge for household questionnaires.
Authorship
A.R. completed analysis of data and was primarily responsible for the drafting and revision of the main manuscript. E.C.S. and Av.G. contributed to the conception and design of the study, as well as the interpretation of the data and revision of the manuscript. J.C., M.J. and T.F. aided in interpretation of the data and revision of the manuscript. All authors (A.R., E.C.S., T.F., Av.G., J.C. and M.J.) have approved this version ofc.
Financial support
AR received the National Institutes of Health Global Cardiometabolic Disease T32 (grant # HL129969) pre-doctoral training grant for funding the travel that supported this work. The authors thank the funders of the primary data collection namely Bloomberg Philanthropies (https://www.bloomberg.org/) funded this work subagreement number 124183. TF received additional funding from the International Development Research Centre (IDRC), Canada, (https://idrc.ca/en) for this work
Competing interests
None of the authors have conflict of interests of any type with respect to this manuscript.
Ethics of human subject participation
This study was conducted according to the guidelines laid down in the Declaration of Helsinki, and all procedures involving research study participants were approved by the Biomedical Research Ethics Committee of the University of the Western Cape (#BM17/8/20 and BM18/6/2) as well as by University of North Carolina at Chapel Hill Institutional Review Board (IRB: #18-2028). Written informed consent was obtained from all subjects.


 Open access