

In recent years, overweight and obesity has continued to grow as a global epidemic( Reference Finucane, Stevens and Cowan 1 , Reference Ng, Fleming and Robinson 2 ). The prevalence of obesity has more than doubled in adults over the past 30 years( 3 ). In Australia, the percentage of overweight and obese adults increased from 56·3 to 62·8 % between 1995 and 2011-2012( 4 ). Overweight and obesity is closely linked to death and chronic diseases (e.g. CVD)( 5 ).
The first-line treatment and management of overweight and obesity are lifestyle interventions including dietary interventions, increased physical activity and support for behavioural change( 6 , Reference Grima and Dixon 7 ). Consuming an energy-restricted diet regardless of macronutrient profile is an effective strategy to lose weight( Reference Sacks, Bray and Carey 8 ). However, research has demonstrated that overweight and obese individuals who choose foods that are aligned with a healthy dietary pattern before dietary intervention may experience difficulties complying with energy restrictions compared with those who do not( Reference Grafenauer, Tapsell and Beck 9 ). Moreover, in the long term, the adherence to a dietary prescription tends to be poor in the overweight and obese population( Reference Heymsfield and Wadden 10 ). Approximately half of the participants who were involved in weight-loss trials regained their weight after the intervention( Reference Barte, Bogt and Bogers 11 ). The literature suggests that the method of achieving dietary goal for weight loss may play an important role in adhering to dietary prescription for weight loss( Reference Looney and Raynor 12 ). Thus, exploring foods usually consumed by overweight and obese individuals may help in developing sustainable strategies for better food choices to weight loss.
Research suggests that there may be value in considering the meals in which foods are consumed. Food choice events are colloquially labelled as meal occasions (e.g. breakfast, lunch, dinner or snacks)( Reference Gatenby 13 ). During meal occasions, individual foods and/or mixed dishes, which are prepared and/or cooked from individual foods known as ingredients, are eaten( Reference Gorgulho, Pot and Sarti 14 , Reference Gorgulho, Pot and Sarti 15 ). Thus, meal patterns appear to be closely linked to eating habits( Reference Leech, Worsley and Timperio 16 ). Furthermore, the American Heart Association has suggested that translating energy intakes at each meal occasion into food choices is required, when considering meal patterns( Reference St-Onge, Ard and Baskin 17 ). Therefore, it may indicate that the ultimate translation of dietary recommendations to practice requires identifying the actual foods consumed that make up the meals. Thus, understanding how food choices are made at meal occasions can be a crucial element in developing dietary strategies for better food choices for weight loss, but little research has been conducted in this area.
A challenge to exploring food choices at meals is the inter- and intra-individual variation in food consumption. This relates to both the different types of food and the frequency in which they are consumed. Variations in food choices could create inaccessible numbers of food choice combinations, but short-cuts are not the answer. Previous studies suggest that a food combination requires disaggregation into single food groups to provide a more precise intake distribution( Reference Krebs-Smith, Cronin and Haytowitz 18 – Reference Probst, De Agnoli and Batterham 21 ). Adding considerations of time intervals (e.g. daily v. weekly) while identifying closely related food groups at meals may improve the accuracy of intake estimation.
Advances in data analysis techniques may overcome these challenges for exploring food choice within meals. Meal-based food consumption relationships may be examined through descriptive data mining tools, such as the Apriori algorithm of association rules, which apply a variety of data analysis tools to discover hidden patterns and relationships in a data set( Reference Han, Pei and Kamber 22 ). The Apriori algorithm has been applied for identifying meal-based food combination patterns in many studies( Reference Burden, Probst and Steel 20 , Reference Hearty and Gibney 23 – Reference Murakami, Livingstone and Sasaki 25 ). The Apriori algorithm of association rules is a two-step descriptive method of creating rules to determine associations between items in a data set( Reference Agrawal, Imieliski and Swami 26 , Reference Agrawal and Srikant 27 ). In the first step, the possible combinations of the items are identified based on a specified frequency threshold of combined item sets, referred to as frequent item sets. Second, the identified frequent item sets are used to generate the desired association rules shaped by study interest, with the strength of the identified relationship being an example. The outcomes of the analysis suggest closely related food items at each meal occasion. For example, at the breakfast meal, if bread and butter were reported, milk was also reported. Knowing such a relationship may assist in individualising nutrition counselling for participants, by planning what participants can do to increase the intake frequency of low-energy nutrient-dense foods. It may help determine which food item may be affected by reducing high-energy low-nutrient-dense food intake. The closely related food items may also be suggested to be eaten together to improve dietary adherence to recommendations. Thus, using the Apriori algorithm of association rules may provide better insights into food choices at each meal occasion, and help to translate and develop novel dietetic strategies for weight loss at the individual level. The aim of this study was to explore food choices at meal occasions, reported by a sample of overweight and obese volunteers in a weight-loss trial.
Method
Participants
The HealthTrack study was a randomised controlled trial (Australian and New Zealand Clinical Trial Registry ANZCTRN 12614000581662) investigating a novel interdisciplinary lifestyle intervention, compared with usual care, on weight loss in overweight and obese adults from the Illawarra region, south of Sydney, Australia. The HealthTrack study was approved by the University of Wollongong/Illawarra Shoalhaven Local Health District Human Research Ethics Committee (HE13/189). Written informed consent from each participant was obtained before data collection. Detailed study protocols are described elsewhere( Reference Tapsell, Lonergan and Martin 28 ). For the present analyses, screening dietary data from the HealthTrack study before randomisation was analysed. The WHO BMI classifications were applied to determine overweight (BMI of 25·00–29·99 kg/m2) and obese (BMI of ≥30·00 kg/m2) participants( Reference World Health Organization 29 ). Dietary intake data were analysed from participants who were overweight and obese at the screening phase.
Food intake data and food intake data preparation
Self-reported food intake data were obtained from a dietitian-administered diet history interview( Reference Martin, Tapsell and Denmeade 30 ) collected between May 2014 and April 2015. The diet history interview protocol was validated previously( Reference Martin, Tapsell and Denmeade 30 ). Participants were asked to recall their usual intake over the past 3-month period during the interview. A food checklist was used to assess commonly omitted food items during the interview. The food intake data were self-reported, reflecting usual weekly consumption recorded on the basis of participant-defined meal occasions, including breakfast, lunch, dinner, beverages, morning tea, afternoon tea, extras, snacks and/or desserts. The intake data were sorted to align with a 7-d equivalent to weekly intake patterns for this study based on reported intake of frequencies. For example, consuming one can of unflavoured tuna (one can weight 70 g as 645·4 kJ) one time per week automatically produces an average daily energy contribution of 92·2 kJ (645·4 kJ/7=92·2 kJ). All food intake data were analysed using FoodWorks Professional nutrient analysis software (version 7, 2007; Xyris Software), drawing originally on the AUSNUT 2007 food composition database( 31 ). The analyses did not address data on beverage consumption because of previously identified inconsistencies in the reporting within this data set( Reference Guan, Probst and Neale 32 ). Thus, ‘non-alcoholic beverage’ (e.g. tea, coffee, juice, cordial, soft drink or water) and ‘alcoholic beverage’ (e.g. beers, wines or sprits) were excluded from the analyses. Participant-defined meals other than ‘breakfast’, ‘lunch’ and ‘dinner’, such as morning tea, afternoon tea, desserts, extras and snacks, were all grouped into an other meal. Thus, food intake was grouped into four meal occasions (events): breakfast, lunch, dinner and other meals.
The AUSNUT 2007 food composition database (used in the Australian Health Survey) was the most recent Australian food composition database available when the HealthTrack study commenced. The more recent release of the nested hierarchical food groups of the AUSNUT 2011–2013 food classification system was used for the analyses of this study( 33 ). For this to occur, a matching file was used to translate food items from the AUSNUT 2007 to the AUSNUT 2011–2013 food classification system( Reference Neale, Probst and Tapsell 34 ). There are three food group levels in the AUSNUT 2011–2013 food classification system, including the major (n 24), sub-major (n 132) and minor (n 515) food groups( 33 , 35 ). Examples of food items at each level are presented in the online Supplementary Table S1. At the major food group level, foods are categorised on the basis of the dominant nutrients or ingredients, such as cereal, fruit and vegetable. The sub-major food groups aggregate foods from similar animal/plant species or family, or sharing similar cooking methods and presentations. Detailed and specific characteristics of a food are described at the minor food group level to further differentiate between the food items. For example, a major food group ‘cereals and cereal products’ is divided into the following sub-major food groups: ‘flours and other cereal grains and starches’, ‘regular breads, and bread rolls’, ‘breakfast cereals, ready to eat’ and so on. ‘Grains (other than rice) and grain fractions’ and ‘rice and rice grain fractions’ are included at the minor food group level for ‘flours and other cereals grains and starches’. In addition, a total of 106 food groups represent mixed dishes (n 12, 21 and 73; at a major, sub-major and minor levels, respectively)( 33 ). Examples of mixed dish food groups include ‘pizza, saturated fat ≤5 g/100 g’, ‘mixed dishes where cereal is the major ingredient’ and ‘cereal-based products and dishes’ at minor, sub-major and major food group levels, respectively.
All the food items listed in the FoodWorks software output were identified using a food group code and food group name for each of the three food grouping levels described above. To prevent duplication, repeated food items at each food group level within meals were removed from the data set to ensure that each food group was only included once for each meal occasion at each food level. For example, four items reported at breakfast – ‘bread, from white flour, toasted’, ‘bread, mixed grain’, ‘Kellogg’s crunchy nut clusters’ and ‘Kellogg’s nutri-grain’ – belonged to the same major food group: ‘cereals and cereal products’. Thus, only one listing of ‘cereals and cereal products’ was retained. Further, at the sub-major food group level, two of the four foods belonged to the ‘regular breads and bread rolls’ sub-major group and two belonged to the ‘breakfast cereals, ready to eat’ sub-major food group. One food group was retained for each. At the minor food group level, each food item belonged to a different food group; therefore, all the food groups were retained. The food groups at the major, sub-major and minor levels for the above example are shown in Table 1. The frequencies of individual food groups within meals were identified using RStudio, version 1.0.44 (incorporating R, version 3.2.5; The R Foundation for Statistical Computing)( 36 ).
Exemplar reported food items at the major, sub-major and minor levels based on food groups of the 2011–2013 Australian Health Survey food classification system ( 33 )

Statistical analysis
The present study is a cross-sectional secondary analysis of screening dietary intake data from a 12-month clinical trial for weight loss (the HealthTrack study), with primary results on the randomised group described elsewhere( Reference Tapsell, Lonergan and Batterham 37 ).
In the present analyses, the Apriori algorithm of association rules was applied to examine the food choices at meal (events) at each food group level( Reference Agrawal, Imieliski and Swami 26 , Reference Agrawal and Srikant 27 ), using RStudio, version 1.0.44 (incorporating R, version 3.2.5)( 36 ). In the first step of the algorithm, a frequency threshold was used to determine the frequent item sets. This is referred to as support and represents the percentage of the records containing identified frequent item sets( Reference Agrawal, Imieliski and Swami 26 , Reference Agrawal and Srikant 27 ). In the second step, the support and confidence are used to determine the association rules containing both precursor and consequent items, which reflect the strength of an identified rule( Reference Agrawal, Imieliski and Swami 26 , Reference Agrawal and Srikant 27 ). The association rules are presented to indicate that if the precursor food items are reported the consequent food items are also reported. The confidence of a rule is the percentage of records containing both precursor and consequent items and is calculated as the percentage of the records containing both items divided by the percentage of the records only containing precursor items( Reference Han, Pei and Kamber 22 ). The confidence indicates how likely the consequent item is presented in the identified association rules( Reference Agrawal, Imieliski and Swami 26 , Reference Agrawal and Srikant 27 ). Higher values of support and confidence imply a stronger relationship for the identified association rule. Another variable used to select the desired rule is referred to as lift, which is used to assess the dependency between precursor and consequent items, and is determined by the confidence of a rule divided by the percentage of records only containing the consequent item( Reference Han, Pei and Kamber 22 ). A lift >1 indicates that precursor and consequent items are more likely to depend on each other. An example of the two-step algorithm is as follows: in a data set of 100 food choice records, where 80 % of records contained both breakfast cereal and milk (n 80), 75 % of records contained banana (n 75) and 65 % of the records contained the combination of breakfast cereal, milk and banana (n 65), the support of the frequent item set (breakfast cereal, milk and banana) would be 0·65. The confidence of the association rule (e.g. if breakfast cereal and milk are reported, then banana is also reported) is 0·81 (0·65÷0·8). This indicates that 81 % of the times that a participant reports having breakfast cereal and milk, a banana is also reported. The lift of the rule is 1·08 (0·81÷0·75), which suggests that reporting intake of breakfast cereal and milk depends on the reporting intake of consuming a banana.
In the analyses reported here, the threshold of the possible food group combinations at events (meals) was set as the proportion of participants in the HealthTrack study who were overweight( Reference Brossette, Sprague and Hardin 38 , Reference Ramezankhani, Pournik and Shahrabi 39 ). In other words, the proportion of the possible combinations of food groups at meals was required to be greater than the proportion of overweight participants in the study. For example, if a total of 20 % of participants in the study were overweight, at least 20 % of participants in the study would need to report a specific combination of food groups for the food combination to be reported in the present analysis. The percentage of times that a participant reported consuming closely related food groups at meals was determined by the default value for the Apriori algorithm within the R software (0·80)( 36 ). Dependency between food groups in the identified food combinations was also assessed( 36 ), which was calculated as follows:
 $${\rm the}\,{\rm percentage}\,{\rm of}\,{\rm times}\,{\rm closely}\,{\rm related}\,{\rm food}\,{\rm groups}\,{\rm were}\,$$
 $${\rm reported}\,{\div}\,{\rm percentage}\,{\rm of}\,{\rm records}\,{\rm containing}\,{\rm related}\,{\rm food}$$
 $$\,{\rm groups}\:\:\,\gt\,\:{\rm 1}.$$
Because of food consumption variability, at each event, many closely related food groups may be found in the data set. Thus, to minimise unnecessary complexity, redundant closely related food groups were removed( Reference Pasquier, Taouil and Bastide 40 ). They were determined by comparing closely related food groups at events( Reference Han, Pei and Kamber 22 , Reference Pasquier, Taouil and Bastide 40 ). For example, two closely related food groups at breakfast were generated, which contained the following:
(1) 81 % of the times that a participant reported having ready-to-eat breakfast cereal and dairy milk, it was also reported with tropical fruit, and
(2) 32 % of the time that a participant reported having ready-to-eat breakfast cereal, dairy milk and nuts, tropical fruit was also reported.
The second combination was based on the first combination but with a much lower percentage of occurrences. Thus, the second combination was considered redundant and removed from further analysis. Subsequently, the major food group combinations for this data set were retained. In addition, to prevent removal of relevant food group combinations, those combinations comprising a high number of food groups reported by at least half of the sample in the study were scrutinised.
Results
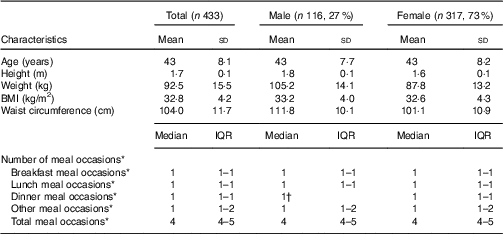
Data for 433 participants screened for the HealthTrack study were analysed (116 male and 317 female) (Table 2). Within the analysed sample, 32 % of the participants (n 128, twenty-seven male and 111 female) were overweight. Thus, the threshold of the possible food group combinations at events was set at 0·32.
Participant characteristics of the data set (Mean values and standard deviations; medians and interquartile ranges (IQR))

* Excluded beverage intakes.
† The number of dinner meal occasions of male was constant.
A total of 432 records contained breakfast meal entries and 428 and 432 records contained lunch and dinner meal entries, respectively. A total of 433 records contained other meals. The numbers of meal occasions are presented in Table 2. Data for one participant included reported intake data as a ‘main meal’ only, which was unable to be differentiated into meal types. A total of thirteen participants reported skipping a meal (nine breakfasts and four lunches). Meal-based energy and macronutrient intakes are provided in the online Supplementary Table S2.
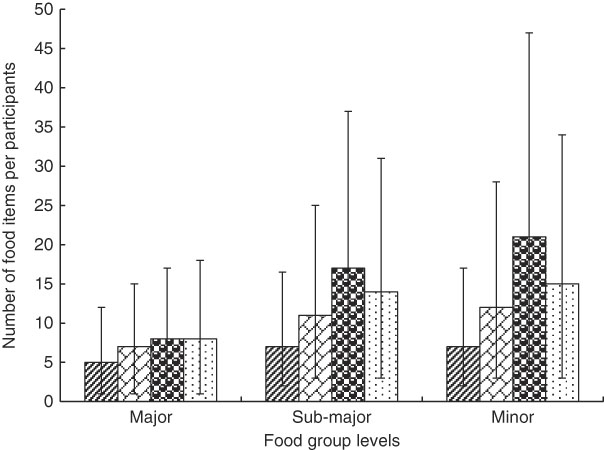
Overall, participants reported more food groups for the dinner meal than the breakfast, lunch and other meals at the sub-major and minor food group levels, Fig. 1. At the major food group level, the number of reported food groups was the same for the dinner meal and the other meal (n 8). There were slightly more reported food groups at the minor food group level than those at the sub-major food group level for the number of food items per participant (median: 17 (interquartile range (IQR) 14–20) v. 21 (17–26)), online Supplementary Table S1.
Number of reported food items per participant per meal occasion. Values are medians and interquartile ranges represented by vertical bars. ![]() , Breakfast;
, Breakfast; ![]() , lunch;
, lunch; ![]() , dinner;
, dinner; ![]() , other meals.
, other meals.

Breakfast meal occasion
At the major food group level, the highest proportion of reported food groups at the breakfast meal was ‘cereals and cereal products’ (94 %) (online Supplementary Table S1). A total of seven items of closely related food groups were identified, with 76 % of the participants reporting the combination of ‘milk products and dishes’ and ‘cereal and cereal products’. Overall, 96 % of the time that ‘milk products and dishes’ were reported, ‘cereal and cereal products’ was also reported.
At the sub-major food group level, the highest proportion of reported food groups was ‘regular breads and bread rolls’ (74 %) (online Supplementary Table S1). There were two closely related food groupings. A total of 42 % of the participants reported having a combination of ‘regular bread and bread roll’ and ‘eggs’, and 92 % of the time the ‘eggs’ food group was reported ‘regular bread and bread roll’ was also reported. There were also 35 % of participants reporting a combination of ‘dairy milk’, ‘regular bread and bread roll’ and ‘breakfast cereal, ready to eat’, and 82 % of the time that ‘regular bread and bread roll’ and ‘breakfast cereal, ready to eat’ were reported ‘dairy milk’ was also reported.
At the minor food group level, the highest proportion of reported food groups was ‘egg, chicken’ (45 %) (online Supplementary Table S1). ‘Milk, cow, fluid, reduced fat, <2 g/100 g’ was the most frequently reported food group for milk (n 113). The proportions of reported mixed grain, wholemeal and white bread were similar for 25, 25 and 24 % of the participants, respectively. There were no closely related food groups identified at the minor food group level for the breakfast meal.
Lunch meal occasion
At lunch, the highest proportion of reported food groups at the major food group level was ‘vegetable products and dishes’ (91 %) (online Supplementary Table S1). In addition, 71 % of the participants reported the combination of ‘cereal and cereal products’, ‘meat, poultry and game products and dishes’ and ‘vegetable products and dishes’, including 51 % of the participants also having ‘milk products and dishes’. A total of thirteen closely related food groupings were identified. Half of the participants reported having the combination of ‘fish and seafood products and dishes’ and ‘vegetable product and dishes’, and 95 % of the time that ‘fish and seafood products and dishes’ was reported ‘vegetable product and dishes’ was also reported. In addition, half of the participants reported that ‘savoury sauces and condiment’ was combined with either ‘cereals and cereal products’ or ‘vegetable products or dishes’, and when ‘savoury sauces and condiment’ was reported ‘cereal and cereal products’ or ‘vegetable products or dishes’ was also reported (94 and 96 % of the time, respectively).
At the sub-major food group level, the highest proportion of reported food groups was ‘regular breads and bread rolls’ (76 %) (online Supplementary Table S1). There were four closely related food groupings identified at the lunch meal. Approximately half of the participants reported having ‘regular bread and bread roll’ combined with either ‘cheese’ or ‘leaf and stalk vegetables’ or ‘processed meat’ in food combinations (51, 49 and 44 %, respectively). Furthermore, 92 % of the time when ‘processed meat’ was reported, ‘regular bread and bread roll’ was also reported, and ‘cheese’ also at 85 % of the time. ‘Leaf and stalk vegetables’ was reported with ‘regular bread and bread roll’ of 81 % of the time.
At the minor food group level, the highest proportion of reported food groups was ‘leaf vegetables’ (59 %) (online Supplementary Table S1). Almost half (45 %) of the participants reported ‘cheese, hard cheese ripened style’. Approximately 40 % of the participants reported having ‘chicken’, ‘ham’ or ‘packed fin fish’ and 34 % of the participants reported having white bread. There was two closely related food groupings identified related to ‘leaf vegetables’, with 44 % of the participants reporting the combination of ‘tomato’ and ‘leaf vegetables’, and the combination of ‘other fruiting vegetables’ and ‘leaf vegetables’ by 40 % of participants.
Dinner meal occasion
At dinner, the highest proportion of reported food groups at major food group level was ‘vegetable products and dishes’ (99 %) (online Supplementary Table S1). The combination of ‘cereal-based products and dishes’, ‘cereals and cereal products’, ‘meat, poultry and game products and dishes’, ‘savoury sauces and condiments’ and ‘vegetable products and dishes’ was reported by 52 % of the participants. Moreover, although 90 % of the participants reported having the combination of ‘cereals and cereal products’, ‘meat, poultry and game products and dishes’ and ‘vegetable products and dishes’, half of the participants reported the additional food group or either ‘fish and seafood products and dishes’ or ‘milk products and dishes’ in the combination to form a combination comprising four food groups. In addition, more than 72 % of the participants reported having the combination of ‘cereal and cereal product’, ‘savoury sauces and condiments’ and ‘vegetables products and dishes’ or the combination of ‘meat, poultry and game products and dishes’, ‘savoury sauces and condiments’ and ‘vegetables products and dishes’. There were fifteen closely related food groupings identified. If either ‘cereal-based products and dishes’ or ‘cereal and cereal products’ or ‘fats and oils’ or ‘fish and seafood products and dishes’ or ‘meat, poultry and game products and dishes’ or ‘milk products and dishes’ or ‘savoury sauces and condiments’ was reported, then ‘vegetable products and dishes’ was also reported 100 % of the time.
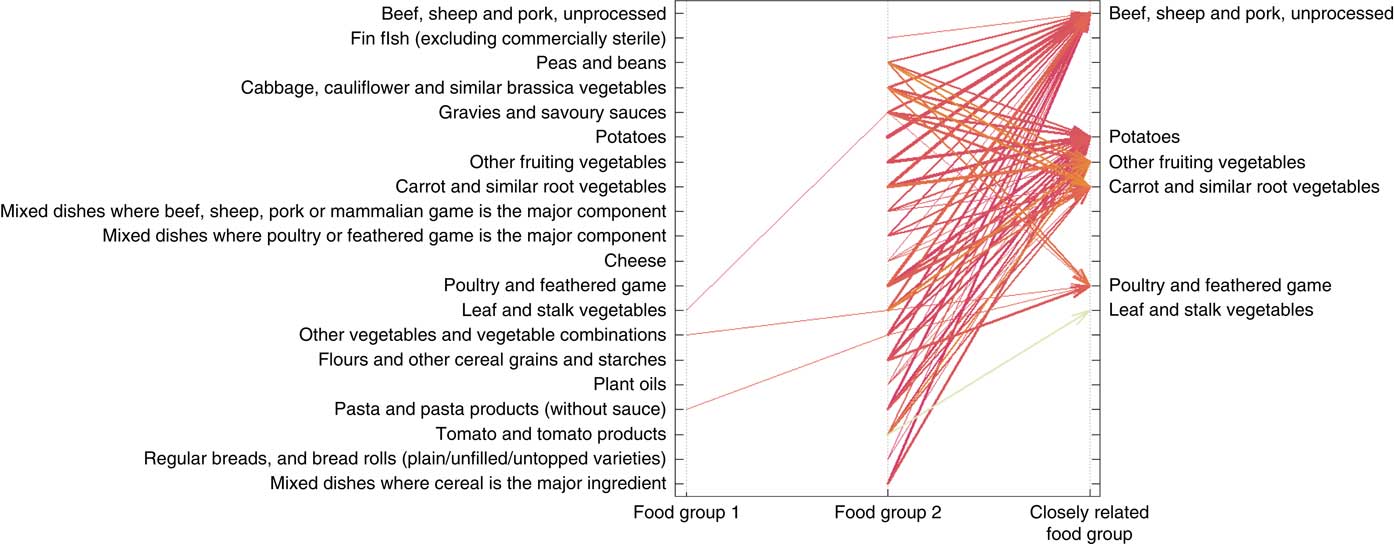
At the sub-major food group level, the food group reported most frequently at dinner was ‘beef, sheep and pork, unprocessed’ (84 %) (online Supplementary Table S1). Half of the participants reported having the combination of ‘beef, sheep and pork, unprocessed’ and ‘carrot and similar root vegetables’ with the addition of any two food groups of ‘potatoes’, ‘other fruiting vegetables’ or ‘poultry and feathered game’ to form a combination of four food groups. Furthermore, half of the participants reported having the combination of ‘beef, sheep and pork, unprocessed’, ‘potatoes’, ‘other fruiting vegetables’ and ‘poultry and feathered game’. A total of sixty-seven closely related food groupings were identified (Fig. 2). When either ‘fin fish’ or ‘leaf and stalk vegetables’ or ‘poultry and feathered game’ was reported, ‘beef, sheep and pork, unprocessed’ was also reported 90 % of the time. Moreover, 90 % of the time where either ‘cabbage, cauliflower and similar brassica’ or ‘pea and beans’ was reported, ‘carrot and similar root vegetables’ was also reported.
Parallel coordinates plot for closely related food groupings for the dinner meal occasion at the sub-major food group level showing sixty-seven items. Arrows represent closely related food groups and the relationship between individual food group or food group combination and its related food group. The width of the arrows represents the percentage of the records containing identified food group combination( Reference Han, Pei and Kamber 22 ), and the intensity of the colour (from light to dark colour) indicates the numerical percentage value of the time that a participant reported having closely related food groups( Reference Han, Pei and Kamber 22 ).

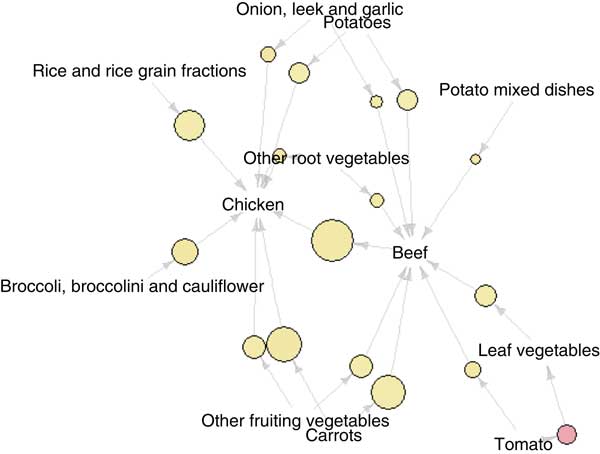
At the minor food group level, the highest proportion of reported food groups was ‘chicken’ (76 %) (online Supplementary Table S1). There were seventeen closely related food groupings identified, as shown in Fig. 3. When one of the above vegetables was reported, then ‘beef’ or ‘chicken’ was also reported approximately 80 % of the time. Moreover, 90 % of time that ‘tomato’ was reported, then ‘leaf vegetable’ was also reported.
Graph-based visualisation of items of closely related food groups for dinner at the minor food groups. Arrows represent closely related food group relationships between individual food groups or food group combinations and its related food group. The size of the sphere represents the percentage of the records containing the identified food group combination( Reference Han, Pei and Kamber 22 ) and the intensity of the colour (from light to dark colour; darker colour indicates a higher value) indicates a numerical percentage value of the time that a participant reported having the item of closely related food groups( Reference Han, Pei and Kamber 22 ).

Other meal occasions
At the major food group level, the highest proportion of reported food groups was ‘cereal-based products and dishes’ (92 %) (online Supplementary Table S1). A total of fourteen closely related food groupings were identified. When either ‘fruit products and dishes’, ‘snacks foods’ or ‘sugar products and dishes’ was reported, ‘confectionery and cereal/nut/fruit/seed bars’ was also reported 89 % of the time. At the sub-group food level, the highest proportion of reported food groups was ‘chocolate and chocolate-based confectionery’ (75 %) (online Supplementary Table S1). There was one closely related food grouping reported. The combination of ‘sweet biscuits’ and ‘chocolate and chocolate-based confectionery’ was reported by 43 % of the participants, and 80 % of time that ‘sweet biscuits’ was reported ‘chocolate and chocolate-based confectionery’ was also reported. At the minor food group level, approximately half of the participants reported having ‘chocolate’ (48 %) or ‘potato crisps’ (47 %). There were no closely related food groupings identified at the minor food group level.
Discussion
The present work applied a descriptive data mining tool to expose food choices at meal occasions based on reported food item characteristics. The study has allowed identification of closely related food groups at meals based on the reported food item frequencies in screening dietary data in the context of a weight-loss trial. When applying more informative food groups data based on characteristics relating to animal/plant origins, plant family or processing methods rather than only the main nutrients, the dinner meal occasion appeared to be the most complex meal compared with breakfast, lunch and other meals (indicated by the number of reported food items and items of closely related food groups). Thus, focusing on the dinner meal may be an important consideration in dietary counselling for weight loss in this context at the individual level, although the findings should be interpreted with caution.
The number and definitions of food groups used in the analyses are essential for revealing reported food choices within meals. Studies suggested that relatively similar food groups tend to be consumed at lunch and dinner( Reference Murakami, Livingstone and Sasaki 25 , Reference de Castro 41 ). The discrepancy between the present analysis and this may be due to the number and definition of food groups applied. Applying a limited number of food groups may be inadequate to appreciate the full range of food likely to be consumed within a food group. In this study, food choices between meals could be characterised when using the sub-major or minor food groups but not at higher levels. The broad nature of the major food groups means they are only based on the key nutrients or ingredients, resulting in groups such as fruit, vegetables and meat, which are a fairly blunt form of categorisation. Therefore, the precision of food groups may be important in a food choice analysis to develop easier and more practical dietary strategies.
The present exploratory results suggest that foods were chosen differently at main meals (e.g. breakfast, lunch and dinner). In our analysis, food choices at breakfast were consistent with the literature from other Western cultures, comprising cereal (e.g. bread or ready to eat breakfast cereal) and milk( Reference Woolhead, Gibney and Walsh 24 , Reference Cho, Dietrich and Brown 42 ). It is also consistent with literature suggesting that the increased BMI appears to be closely associated with consumption of eggs at breakfast( Reference Cho, Dietrich and Brown 42 , Reference Horikawa, Kodama and Yachi 43 ). However, skipping breakfast is also suggested to be related to increased BMI( Reference Horikawa, Kodama and Yachi 43 ), but only 2 % of participants in the present sample reported skipping breakfast. Although different varieties of meat were chosen at lunch and dinner, at the lunch meal people were more likely to choose bread as the food at the centre of food combinations, whereas at dinner unprocessed meat took this position. Choosing meat in meals reflects the Australian tradition of eating habits, aligning with the nation’s historical context aligned to meat consumption( Reference Sui, Raubenheimer and Rangan 44 ).
The findings may also help in developing clinical dietetic strategies for better food choices and behaviour change at the individual level through understanding food choices at meal occasions, particularly for dinner meal occasions. To date, accumulated evidence has suggested that daily energy intake distribution of main meals plays an important role in the effectiveness of achieving weight-loss goals and adhering to a weight-loss plan in the long term( Reference St-Onge, Ard and Baskin 17 ), particularly for reducing intake at dinner( Reference Madjd, Taylor and Delavari 45 , Reference Jakubowicz, Barnea and Wainstein 46 ). The daily energy intake at dinner appears to be positively associated with the risk of obesity( Reference Bo, Musso and Beccuti 47 ), contributed by the desynchronisation of the fasting/feeding cycles in the circadian system( Reference Albrecht 48 ). Therefore, effective strategies for reducing intake at dinner are required for weight loss. In addition, increasing the number of low-energy-dense food items consumed irrespective of intake of quantities is suggested as an effective strategy to lose weight( Reference Vadiveloo, Parker and Raynor 49 ). Given that vegetables are a nutrient-dense food group but are low in energy, increasing vegetable consumption in the diet tends to have desirable effect on controlling energy intakes( Reference Tapsell, Dunning and Warensjo 50 ). However, strategies used to promote consumption of vegetables tend to have limited influence on weight loss( Reference Kaiser, Brown and Bohan Brown 51 ). This may be owing to the wide variety of vegetable types and food forms available and a substantial effort is required to incorporate vegetables into a diet on a daily basis. Moreover, concurrent strategies on restricting other foods when promoting the intake of vegetables is also required for weight loss( Reference Mytton, Nnoaham and Eyles 52 ). This may imply that being more specific about the actual foods to be consumed is required to develop sustainable dietary strategies at the individual level. The present results suggest that participants chose a different variety of vegetables at lunch and dinner meal occasions, where a greater variety of vegetables was consumed with unprocessed meat at dinner. Thus, the current findings may help to provide more practical clinical dietary strategies to improve the intake of vegetables for weight loss, such as reducing the intake of unprocessed meat with increasing the specific vegetable intakes (e.g. carrot and broccoli).
To our knowledge, using a data mining method based on a nested hierarchical food grouping system has not been previously performed to explore food choices at meal occasions in a sample of overweight and obese participants. When applying data mining tools, a large database is commonly required because of the need to split the data set for training and testing purposes( Reference Han, Pei and Kamber 22 ). However, this may not be necessary when using descriptive data mining tools, such as the association rule algorithms( Reference Han, Pei and Kamber 22 ), providing an opportunity to analyse smaller data sets containing detailed data. Detailed food choices at meals reflecting an individual’s habitual food consumption are required to explore food combinations. A diet history interview dietary assessment method uses an open-ended interview approach asking and probing participants to describe habitual food consumption generally from the first meal of the day through to the end of the day( Reference Burke 53 ). This may imply that food intake data generated through a diet history interview are more likely to provide food choices at self-defined meals. The richness of dietary intake data generated from a diet history interview at the screening phase of an intervention study also makes it possible to investigate food choices at meal occasions that are unlikely to be observed using other dietary assessment methods, such as the FFQ. Although studies using objective biomarkers of intake have demonstrated that overweight and obese populations tend to misreport energy intakes using self-reported dietary assessment tools( Reference Lichtman, Pisarska and Berman 54 ), the present study somewhat overcame this issue by focusing on food items reported within meals, rather than consumption quantities and frequencies.
However, there are several limitations for the present study. The study was a secondary analysis of screening data of a randomised controlled trial that was designed to answer a different question. The meals collected in the diet history were defined by participants, and specific names of other meals were not required during the dietary intake data collection and coding. A preliminary study in this sample found that the data coders clearly coded breakfast, lunch and dinner, but they applied different approaches to code other meal occasions( Reference Guan, Probst and Neale 32 ). For example, specific meal names such as morning tea or afternoon tea were used to describe other meal occasions. Snacks were also used in some circumstances to code other meal occasions together. It appeared that analysing the specific meal of other meal occasions was out of the scope of the primary aim of the clinical trial. There are also inherent limitations of self-reported dietary intake data derived by diet history interview, such as recall bias and social desirable reporting behaviour( Reference Smith 55 , Reference Hébert 56 ). Moreover, the preliminary study of the present analyses also demonstrated that the beverages were reported inconsistently( Reference Guan, Probst and Neale 32 ). For example, the beverages were reported alone, with food or with food and alone( Reference Guan, Probst and Neale 32 ). This might indicate that the present study was unable to offer any evidence on food combinations related to beverage intakes. The analysis conducted here was based on a small sample of overweight and obese individuals volunteering for a clinical trial, which may not be representative of the overweight and obese population. Reproducing this analysis in a larger sample is warranted to determine the applicability of the method and the findings. In addition, not all the mixed dishes were disaggregated into food groups in the present data set, as it was out of the scope of the primary aim of the clinical trial. The format and composition of mixed dishes may also be required to examine further in relation to food combination at meals. Therefore, these issues may be required to be addressed in future studies to offer more robust evidence for dietary counselling for weight loss. Notwithstanding this, the 142 closely related food groupings at meal occasions may provide examples on what foods are more likely to be chosen to help researchers develop easier and more practical dietary strategies to use in weight-loss counselling.
In conclusion, this study highlighted the food choices at main meal occasions made by overweight and obese study volunteers, which presented insights for counselling on dietary change to lose weight at the individual level. To date, few studies have investigated the food items consumed at meal occasions and their associations. The present study used a descriptive data mining tool (the Apriori algorithm of association rules) and screening usual dietary intake data from a clinical trial to expose these food choices at meal occasions at a much deeper level. Using a nested hierarchical food grouping system to examine food choices at meal occasions revealed that food choice analyses need to consider the level of detail encapsulated within the food groups. Exploring food choices at meal occasions may complement current dietary strategies on weight management and assist in the development of easier and more practical strategies for food choices to support weight loss.
Acknowledgements
The authors thank all the participants and the HealthTrack study team.
The HealthTrack study was funded by the Illawarra Health and Medical Research Institute and California Walnut Commission. The funding bodies had no involvement in the data analysis, data interpretation or writing of the manuscript.
V. X. G., Y. C. P. and E. P. N. formulated the research question and designed the study. V. X. G. and M. J. B. analysed the data. V. X. G. wrote the manuscript. Y. C. P., E. P. N., M. J. B. and L. C. T. reviewed the manuscript. All authors read and approved the final manuscript.
None of the authors has any conflicts of interest to declare.
Supplementary material
For supplementary material/s referred to in this article, please visit https://doi.org/10.1017/S0007114518001587


 Open access